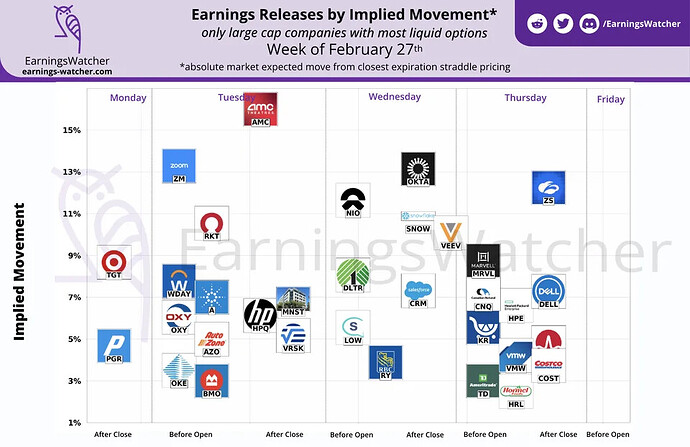
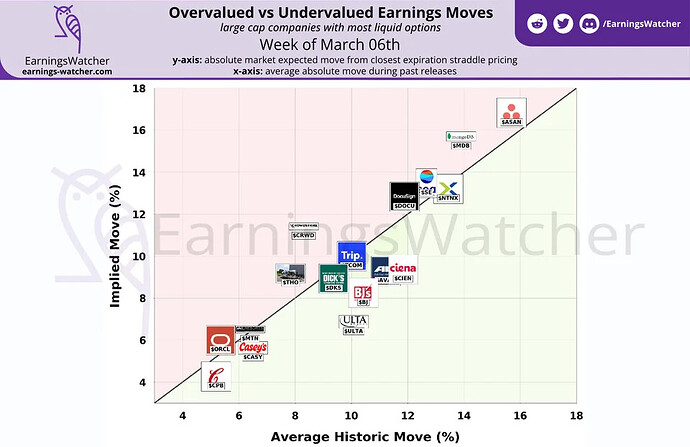
Yup, there doesn’t seem to be any calendar plays for tomorrow. Everything is either too expensive, or doesn’t have enough liquidity. Bummer.
Monday 02/27/23
AMC
| Ticker | Average Historical Move (%) | IVx Implied move (%) | EarningsWatcher Implied Move (%) |
|---|---|---|---|
| $ZM | 15.91 | 11.99 | 13.29 |
| $OXY | 5.40 | 4.76 | 6.05 |
| $WDAY | 7.63 | 6.62 | 7.78 |
Tuesday 02/28/23
BMO
| Ticker | Average Historical Move (%) | IVx Implied move (%) | EarningsWatcher Implied Move (%) |
|---|---|---|---|
| $TGT | 6.84 | 7.75 | 8.68 |
Spot on! These four look great. Vol doesn’t look as messed up as last week, and pricing is more in line with what we’d expect. Checked a bunch of others and none looked good.
These are the spreads am considering:
Sorry, this one’s a little late today.
Tuesday 02/28/2023
AMC
| Ticker | Average Historical Move (%) | IVx Implied move (%) | EarningsWatcher Implied Move (%) |
|---|---|---|---|
| $CPNG | 15.84 | 10.72 | 11.73 |
| $RKT | 8.15 | 7.09 | 10.35 |
| $HPQ | 6.01 | 4.54 | 5.99 |
| $AMC | 11.76 | 16.8 | 17.21 |
Wednesday 03/01/2023
BMO
| Ticker | Average Historical Move (%) | IVx Implied move (%) | EarningsWatcher Implied Move (%) |
|---|---|---|---|
| $LOW (poor liquidity) | 3.42 | 4.03 | 5.06 |
| $DLTR (poor liquidity) | 9.67 | 6.74 | 7.64 |
| $NIO | 11.01 | 8.67 | 10.45 |
I could start to optimise these lists a bit more and only include the plays with a favourable debit/stock price ratio but I think that might introduce too many sources of error, especially since I’m usually making these lists in the morning when prices can change by EOD.
The following seem to be viable plays:
- HPQ: Custom Calculator | OptionStrat - Options Trade Visualizer
- LOW: Custom Calculator | OptionStrat - Options Trade Visualizer
- DLTR: Custom Calculator | OptionStrat - Options Trade Visualizer
DLTR has less liquidity than the others, and has a history of either knifing or spiking after ER.
Unfortunately, CPNG, RKT and NIO tickers are priced such that commissions will end up being a substantial portion of the cost of the trade, requiring a 20%+ profit margin to account for the safely. So leaving those out. And AMC and RIVN are mad expensive.
Another week another EarningsWatcher free trial ![]()
Wednesday 03/01/23
AMC
| Ticker | Average Historical Move (%) | IVx Implied move (%) | EarningsWatcher Implied Move (%) |
|---|---|---|---|
| $CRM | 4.32 | 7.25 | 7.57 |
| $SNOW | 5.66 | 8.62 | 9.83 |
| $OKTA | 12.37 | 11.61 | 12.81 |
Thursday 03/02/23
BMO
| Ticker | Average Historical Move (%) | IVx Implied move (%) | EarningsWatcher Implied Move (%) |
|---|---|---|---|
| $KR | 5.12 | 4.63 | 5.31 |
| $BBY | 5.69 | 6.49 | 7.34 |
| $HRL | 5.60 | 3.42 | 3.76 |
Thanks to Anonyman for bringing attention to OptionNET Explorer for calendar backtesting. I’ve also bought the trial and I’m working on comparing the 0-1/0-2 setup and finding the best days of the week for the trade. Hopefully, I’ll be able to share some actionable data by the start of next week.
I like these ones:
Thursday 03/02/23
AMC
| Ticker | Average Historical Move (%) | IVx Implied move (%) | EarningsWatcher Implied Move (%) |
|---|---|---|---|
| $COST | 2.56 | 3.2 | 3.64 |
| $DELL | 5.64 | 5.25 | 6.84 |
| $MRVL | 6.41 | 6.72 | 7.54 |
| $ZS | 16.56 | 10.46 | 12.27 |
| $HPE | 4.32 | 4.55 | 7.04 |
Friday 03/03/23
BMO
EarningsWatcher has none for friday
Oops, I just noticed HPE only has monthlies. From a quick look, it seems like DELL is the only viable one, at least for the 0-2 setups. All of the wing strikes were determined from the IVx implied move. the price can change by the end of the day so gamma can change the deltas to be less favorable with these specific strikes.
0-2
-
DELL: Custom Calculator | OptionStrat - Options Trade Visualizer
-
COST: Custom Calculator | OptionStrat - Options Trade Visualizer
-
ZS: Custom Calculator | OptionStrat - Options Trade Visualizer
-
MRVL: Custom Calculator | OptionStrat - Options Trade Visualizer
The 0-1 setups have greater r/r potential and might be better suited to EOW plays. I haven’t managed to get any conclusive data from the backtests yet because I’m terrible at excel. I might have some data to share by Monday.
Thanks! Looking at these 4. Minor changes to strikes on ZS and MRVL.
I’ll do the 0-1, for the sake of science. We can compare notes tomorrow.
Looks like I’m only going to get fills on a MRVL 0-1. I swear these were easier to fill before ![]() . Currently with the backtests I’ve been assuming midprice fills but it seems like that might be misleading, I think I’ll make two sets with one getting fills at something like 5% above midprice.
. Currently with the backtests I’ve been assuming midprice fills but it seems like that might be misleading, I think I’ll make two sets with one getting fills at something like 5% above midprice.
It does seem like fills have gotten harder. Liquidity on the distant leg is particularly week. Perhaps we too have become more judicious in what we take ![]()
The data from the backtests of all the plays in this thread so far. Thursday has a few more to add but since OptionNET Explorer doesn’t have live data I have to wait until tomorrow’s market session to fill that, I thought it might be useful to share a bit early though.
The entry prices are the average midprice of the setup every 5 minutes in the last hour of the market, and the sell prices are the average midprice of the setup every 5 minutes for the first 30 minutes after market open. This assumes midprice fills and the wing strikes were solely determined from IVx expected move (I made some very slight manual adjustments for liquidity’s sake, but only for a few).
In my opinion, this really isn’t enough data to do much with. So far it certainly looks like the 0-2 setup is consistently more profitable (though harder to get midprice fills so maybe its benefit is overstated by the data). Once I’ve got the full Thursday data I’ll share the updated results, as well as look through the most profitable plays to see if there’s a trend.
Also important to note: this is EVERY single weekly play in this thread, some were obviously bad plays that we wouldn’t have taken so I’ll post the data with those removed at some point as well.
I only have 5 days left of the trial for OptionNET Explorer and I can’t afford to pay for a full subscription but I’m optimistic that we can increase the win rate of these plays with access to this data.
I’ve been doing this for the past few hours so it’s definitely possible that there’s a mistake. It’s past midnight here so I’m done for tonight but hopefully I’ll be able to find some time tomorrow to check this all again.
![]()
Tuesday 03/07/23
AMC
| Ticker | Average Historical Move (%) | IVx Implied move (%) | EarningsWatcher Implied Move (%) |
|---|---|---|---|
| $SFIX | 20.14 | 13.90 | 17.61 |
Wednesday 03/08/23
BMO
| Ticker | Average Historical Move (%) | IVx Implied move (%) | EarningsWatcher Implied Move (%) |
|---|---|---|---|
| $CPB | 5.91 | 3.35 | 4.03 |
Wednesday 03/08/23
AMC
| Ticker | Average Historical Move (%) | IVx Implied move (%) | EarningsWatcher Implied Move (%) |
|---|---|---|---|
| $MDB | 13.90 | 13.43 | 15.18 |
| $ASAN | 15.59 | 15.18 | 16.90 |
Thursday 03/09/23
BMO
Nothing with weeklies. Lots tomorrow AMC though.
Will get all the data I can until my OptionNET Explorer trial runs out, then i’ll share here.
Thursday 03/09/23
AMC
| Ticker | Average Historical Move (%) | IVx Implied move (%) | EarningsWatcher Implied Move (%) |
|---|---|---|---|
| $ORCL | 5.45 | 4.18 | 4.96 |
| $DOCU | 11.89 | 10.36 | 12.03 |
| $WPM | 6.07 | 2.10 | 3.35 |
| $ULTA | 9.13 | 5.46 | 6.33 |
Friday 03/10/23
BMO
Just BKE but that only has monthlies.
Hello fellow gamblers.
I finally got around to making the backtest data look pretty, so here’s the file. It’s a pretty good confirmation that the 0-2 setups were safer but beyond that, I can’t see much new information. I welcome others to look through the (unfortunately small) dataset to see if there are any discernable patterns.
Remember that these backtests were of the extremely basic setup where the strikes were determined solely from the IVx metric, and
I ran into some issues with the spread. Some of these had massive spreads on the closing day to the point where assuming a midprice fill is probably just wishful thinking but I couldn’t think of a good way of deciding which plays to omit. In the data file, I included the spread at 3pm but not at market-open. If anyone wanted to enter plays with this very simple strategy then I would advise sticking to high volume companies, I personally wouldn’t use this strategy at all.
My greatest success so far has come from Thursday evening/Friday morning calendars and then playing each position by ear. The most comfortable outcome is the stock price opening central to the strikes on Friday morning so that either way the stock moves, it’s approaching a wing. These setups are also typically theta positive, but remember that on edge cases like this, the greeks can be misleading.
Basic DC backtest (1).ods (31.6 KB)


