SPX Tech Anal: Are Bears just gay and retarded now

TLDR: Ever since CCIV said 450 calls, SPY went up to 418 and then now at 412.

I’ll make an actual TA later but it seems like NI has a lot of useful stuff that he wants to post so here is the new thread. Unless I’m wrong, then I’m just a crayon drawing retard

7 Likes

TLDR: I think that we’re going to get some downside soon, maybe starting Monday or Tuesday. Dollar broke out and the yields started to spike up after the job numbers.

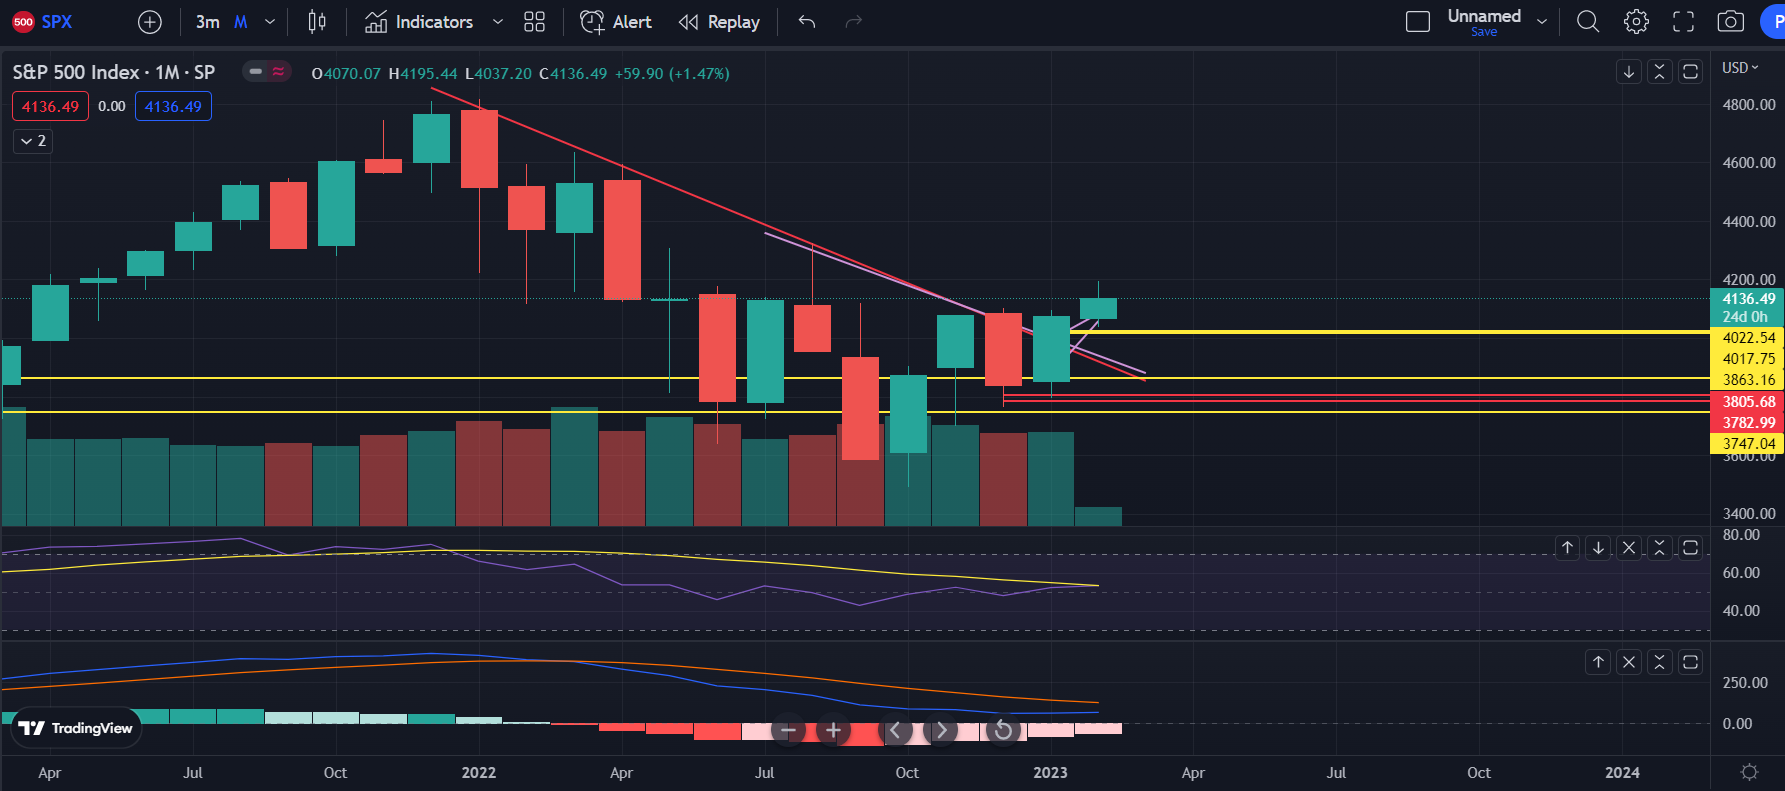
I forgot to do the monthly close for January so we’ll start there. On the monthly, we basically reversed the entire December dickdown and we had an inside bar. This is typically bullish, but the only thing I’m hesitant on is that the monthly volume on the January bar is lower than the December. We’ll see, but on the monthly, it does seem like the trend might be changing and we could have more upside.

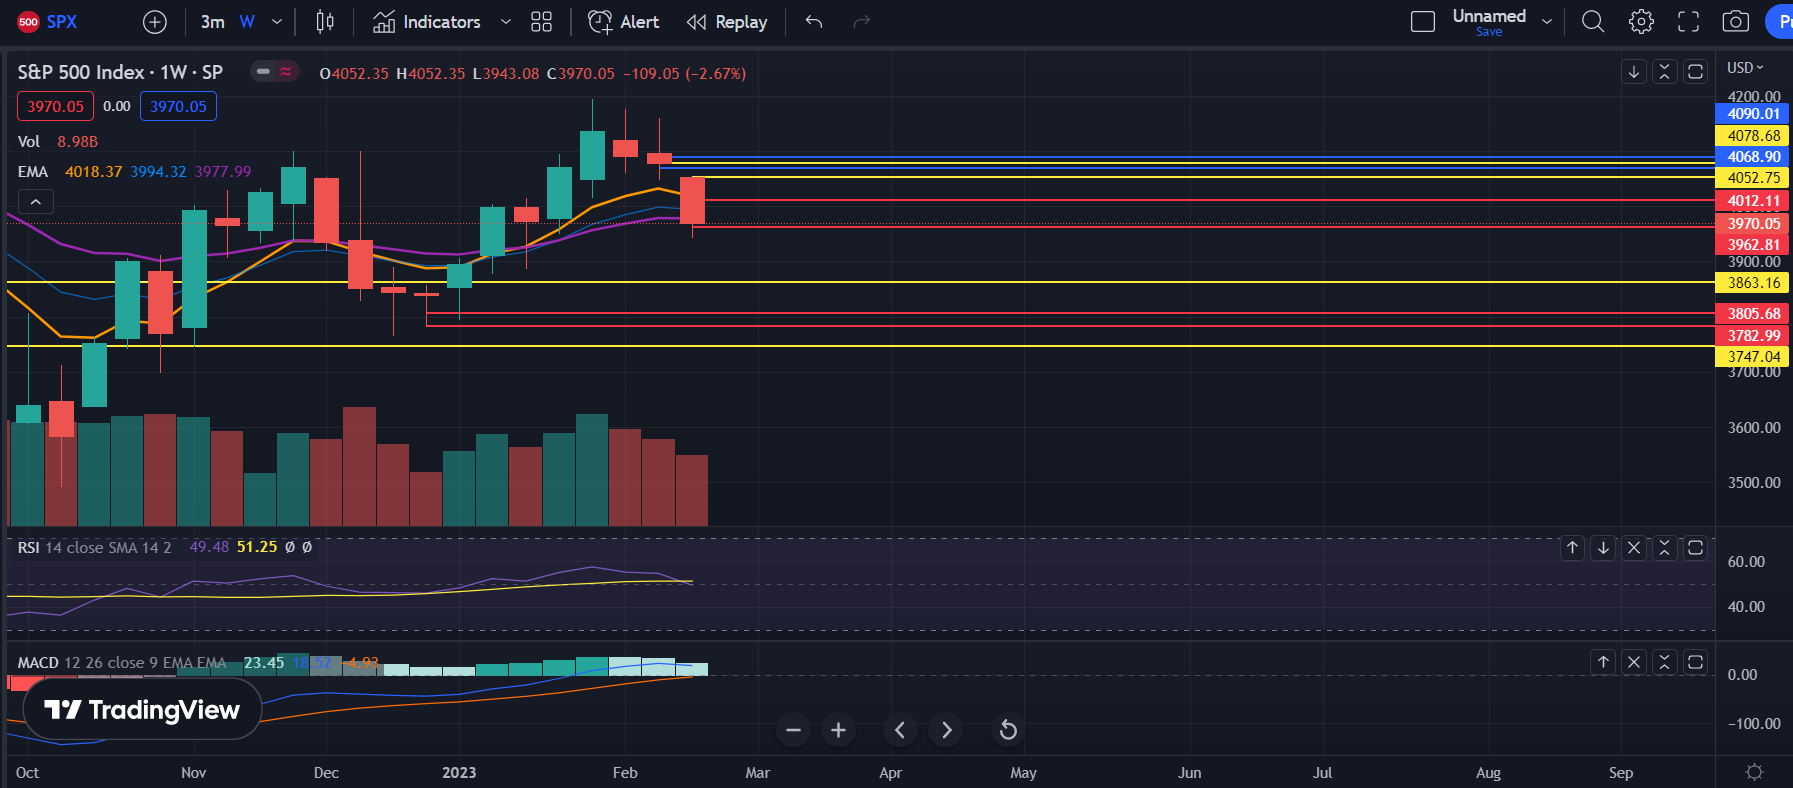
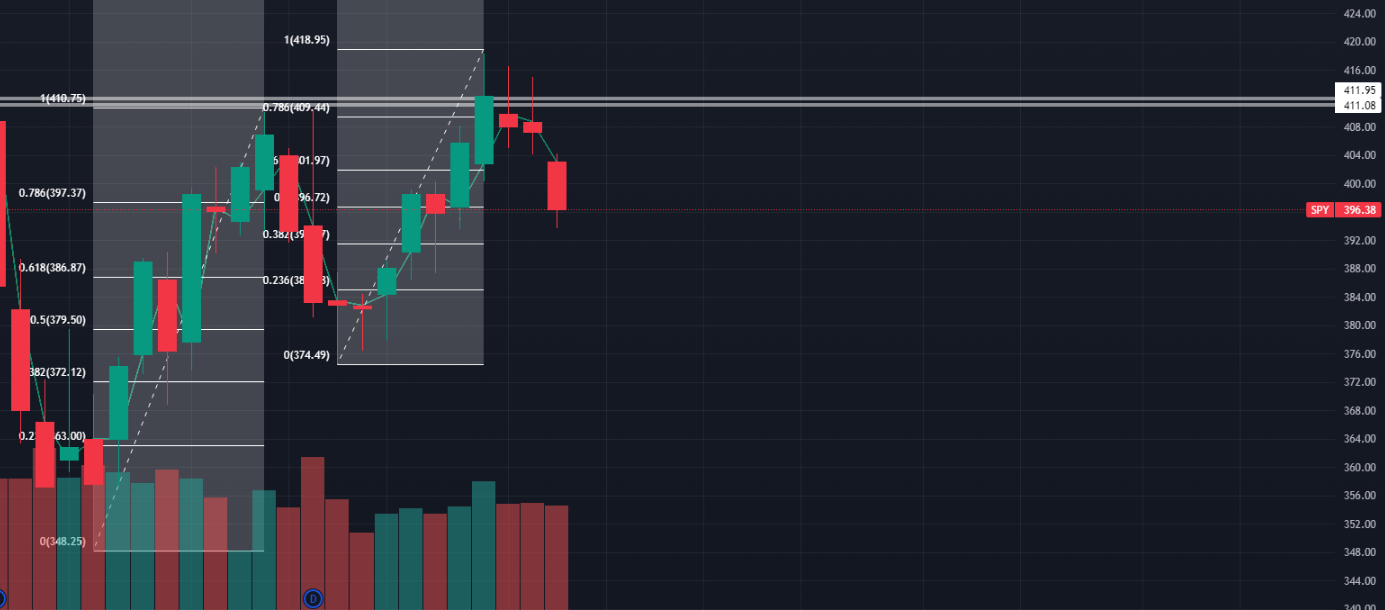
On the weekly chart, we do have an upwick, but it does have increasing volume (using SPY). Which makes sense because this week was full was huge news. So I won’t put too much emphasis on it, but it is good to see that there is increasing weekly volume on this run. Also good to see that us having multiple closes above the downtrend line, which I think shows that we’re can ignore that line now. Only thing that worries me is that the weekly bar is now slightly above the Nadaraya-Watson Envelope (the red and green dotted lines). These are basically just like the bolinger bands, shows the extremes. Last times we were up at these extremes on the weekly, it showed the tops and bottoms. But, it typically lasts like a week above, so maybe we have another green week.

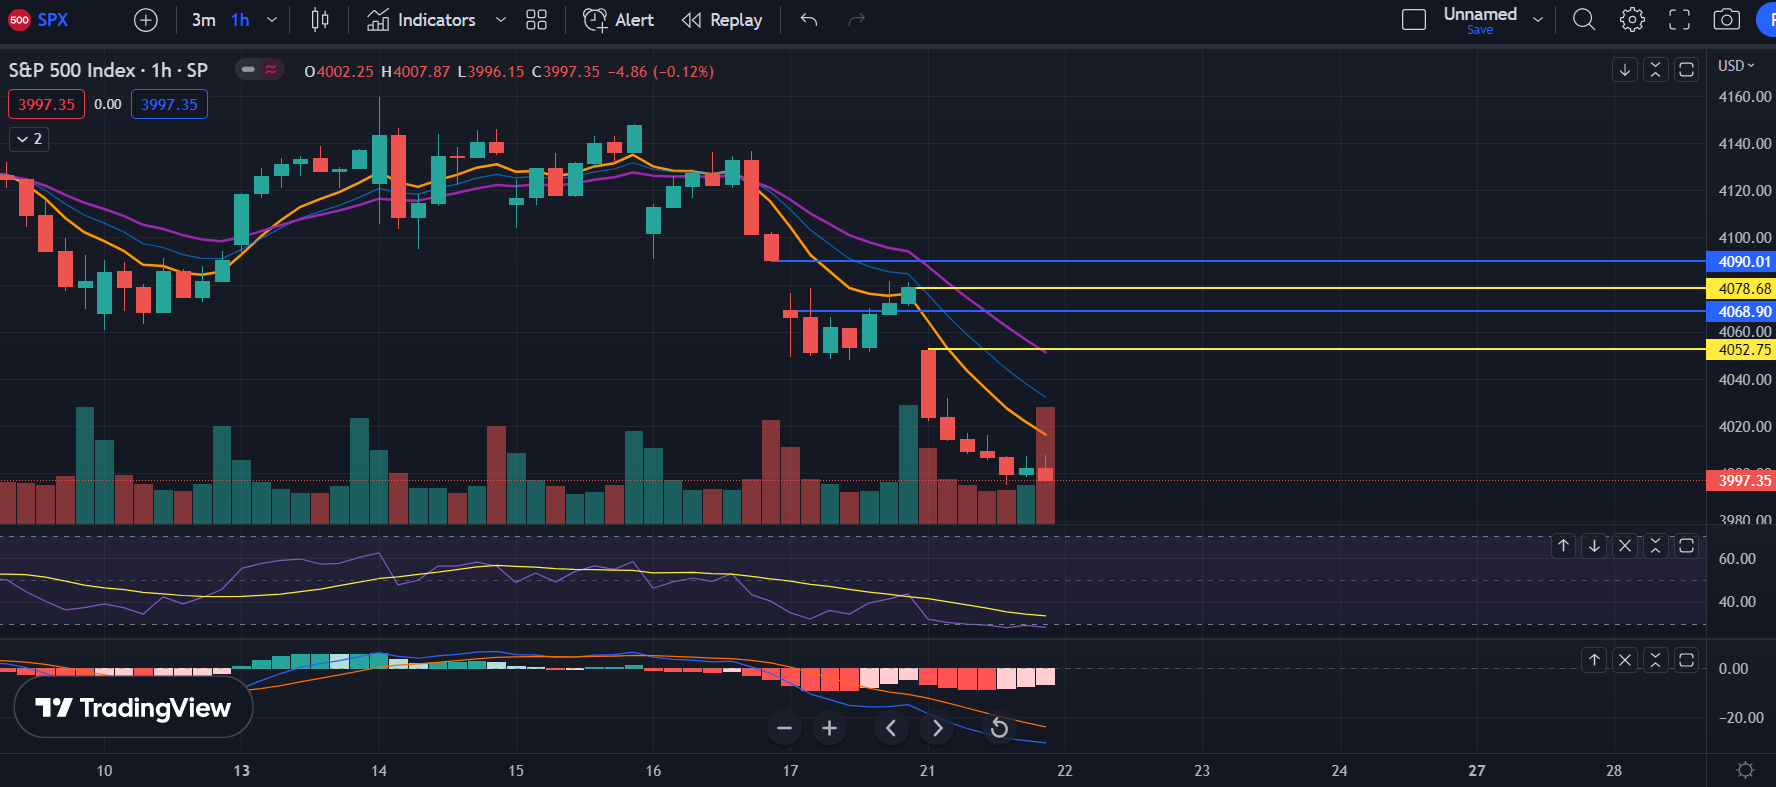
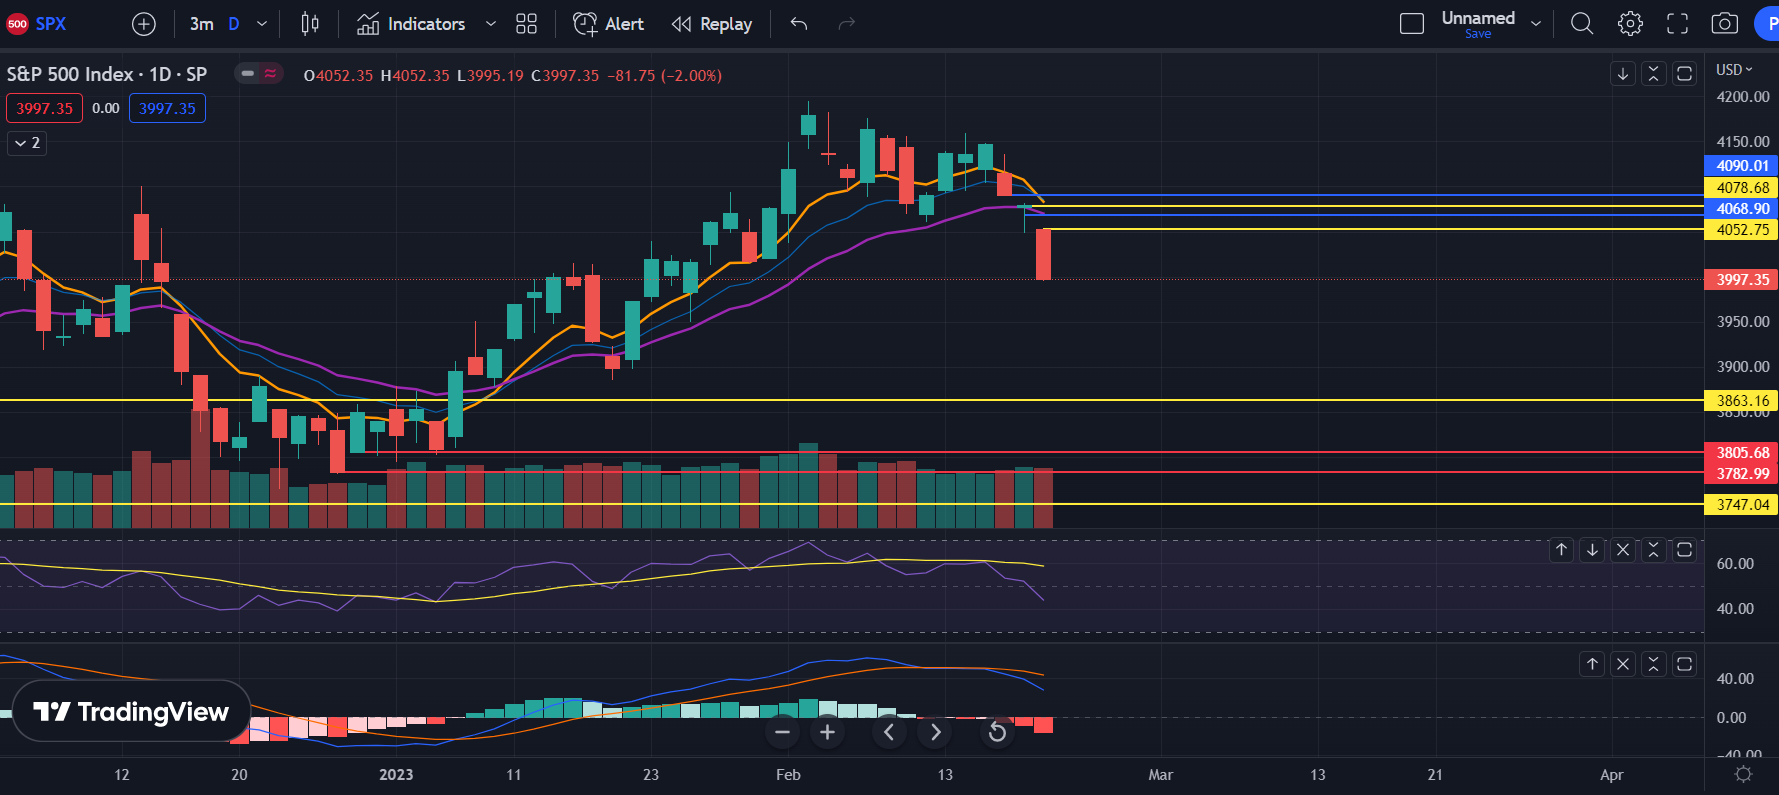
On the daily, we did fill the gap above and below. We formed some bearish candles with a gap up and then a huge upwick. Interesting to see, but we’ll see if bears can follow through on this and push it through to form a higher low and show that the trend is actually changing. MACD and RSI still look strong, so we’ll see what happens. The hourly just shows range trading so nothing to say there.

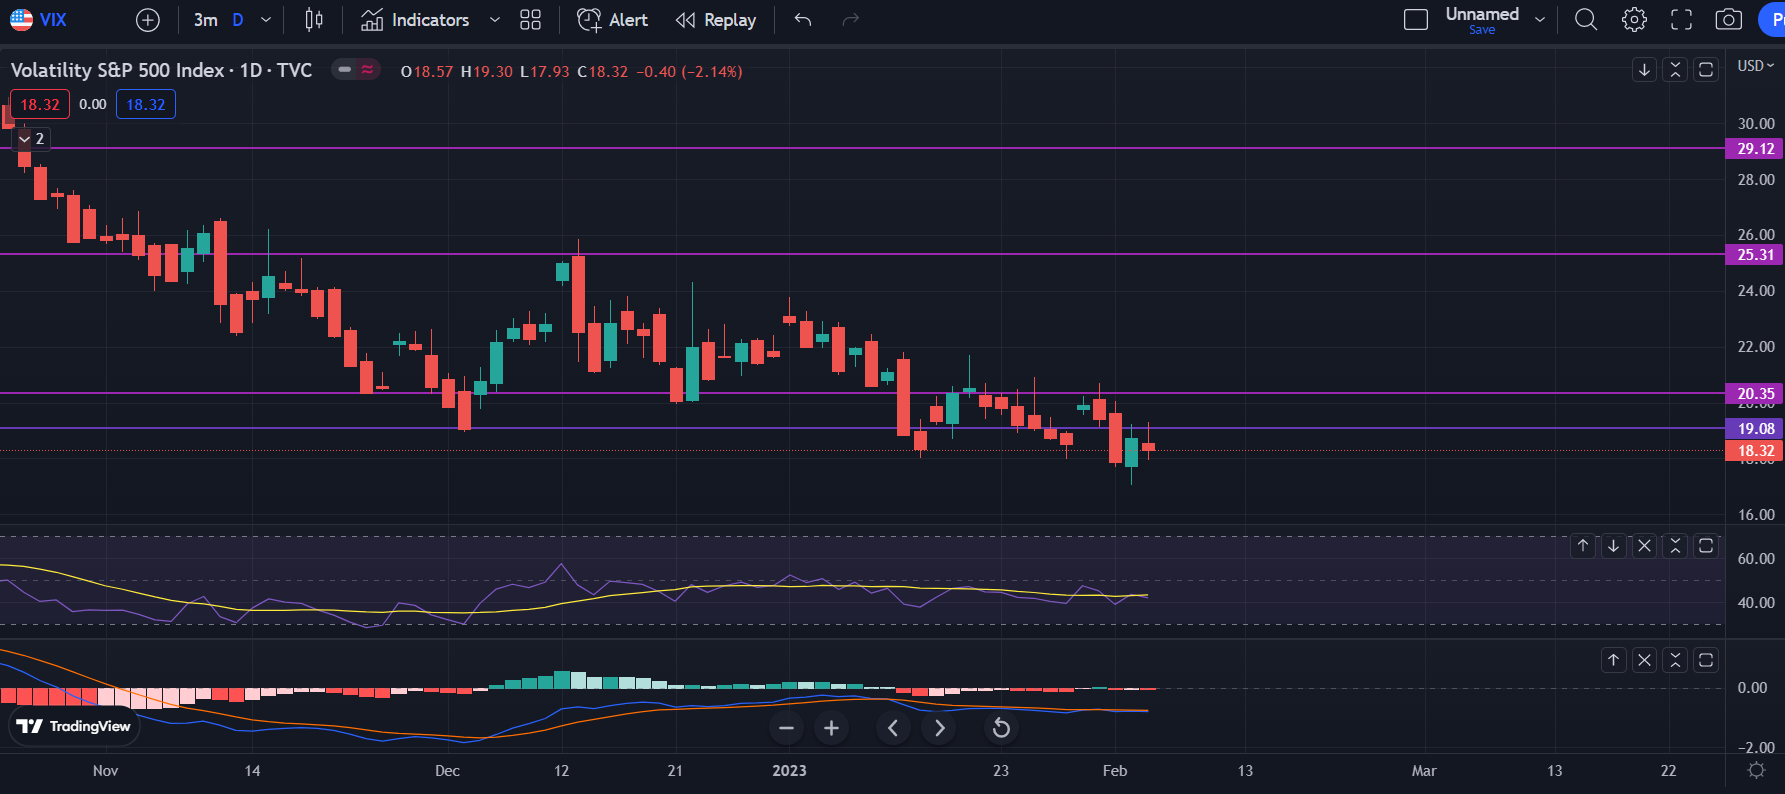
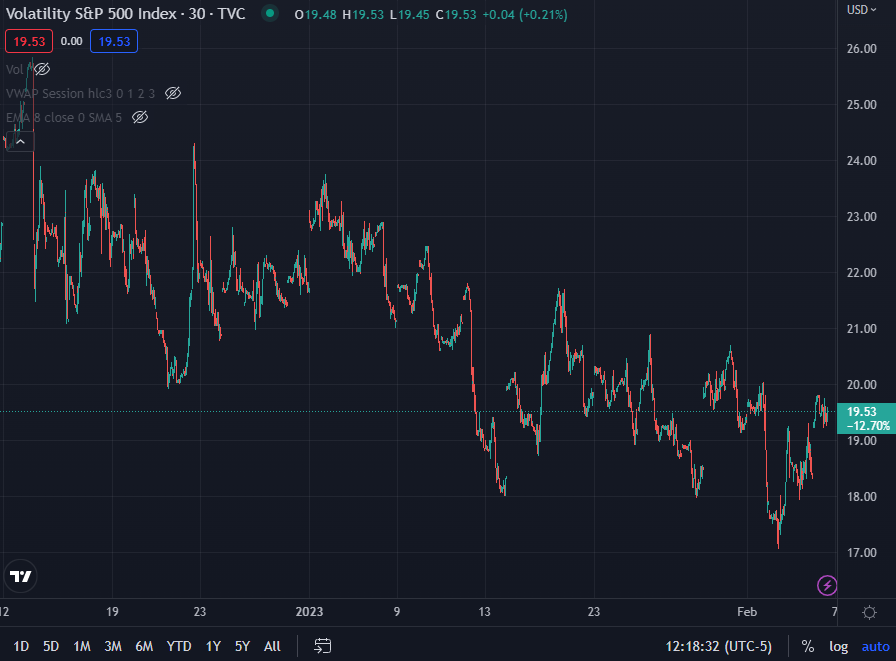
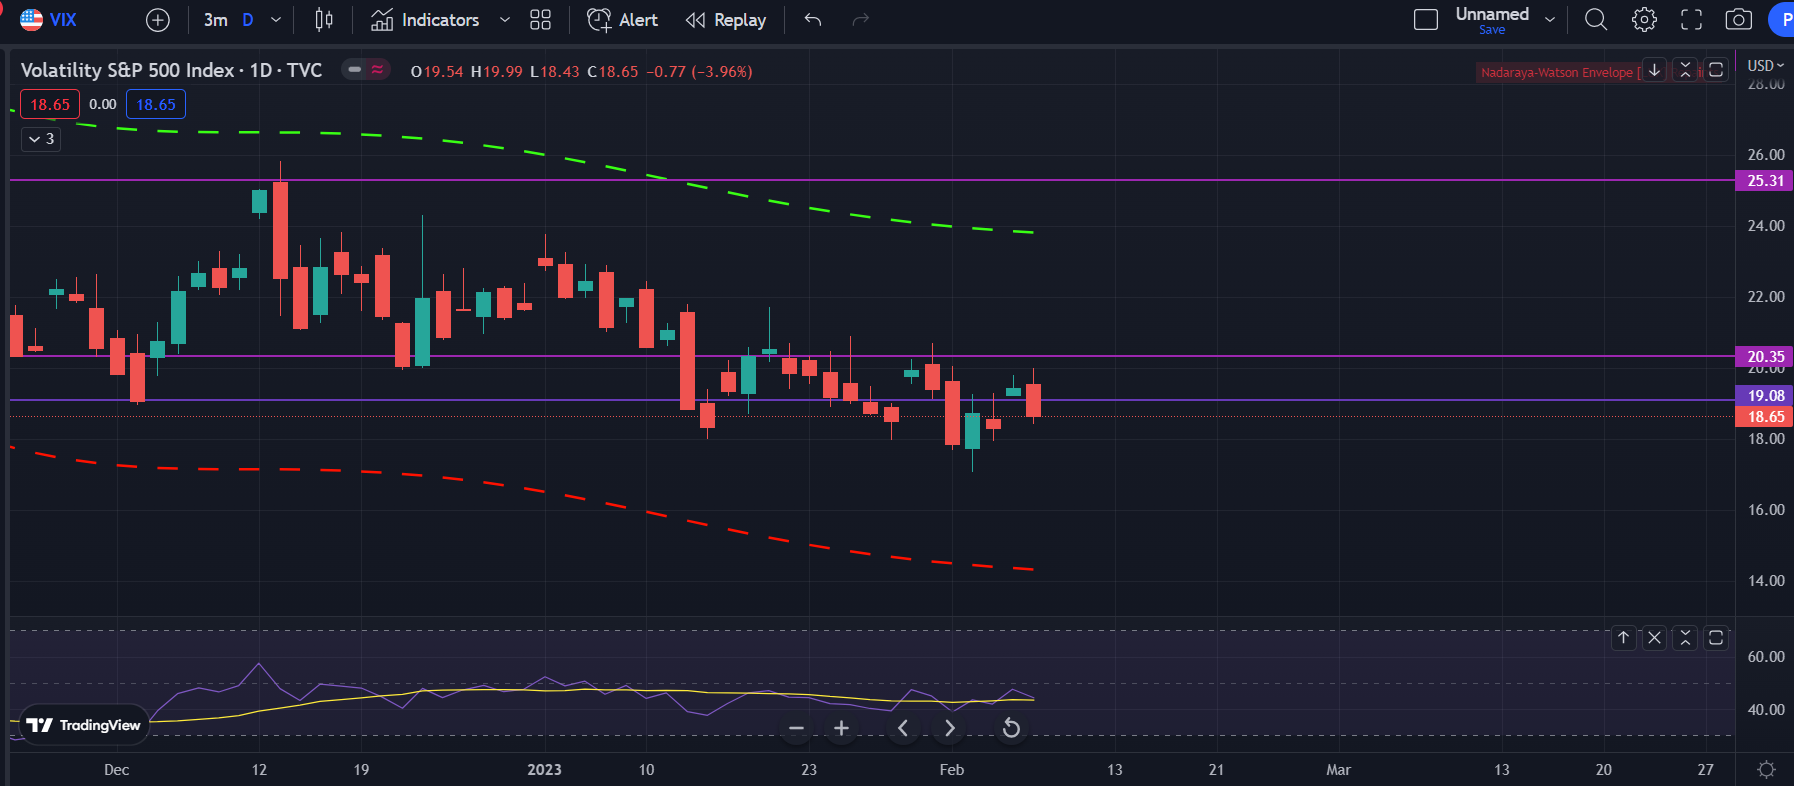
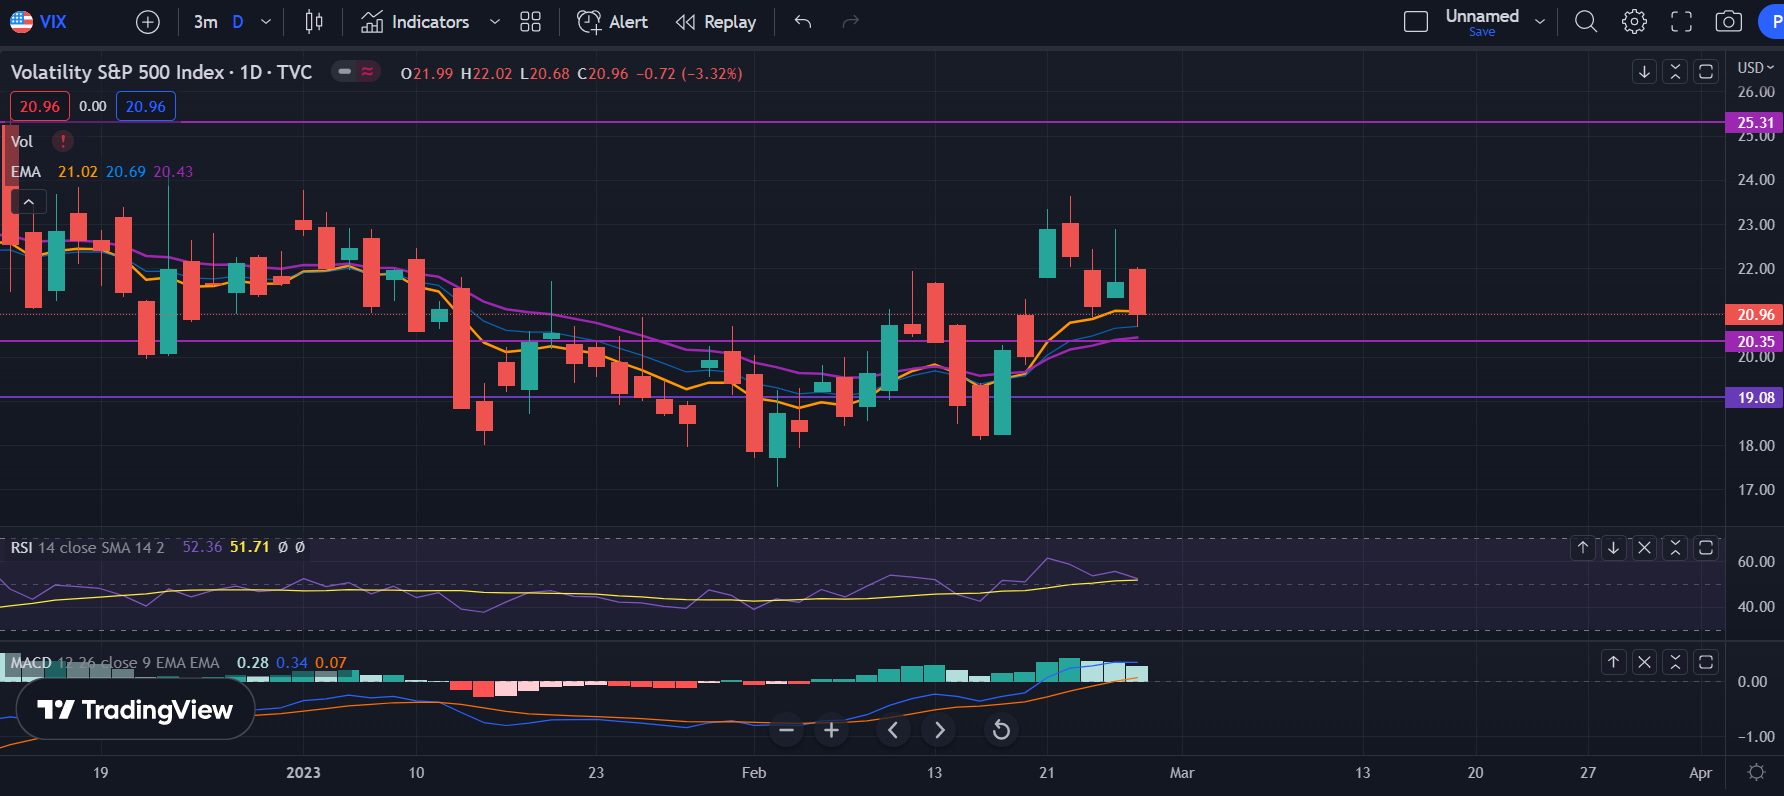
The VIX is dicking around again, so we’ll see if that pump before was just because of the big tech earnings and FOMC.

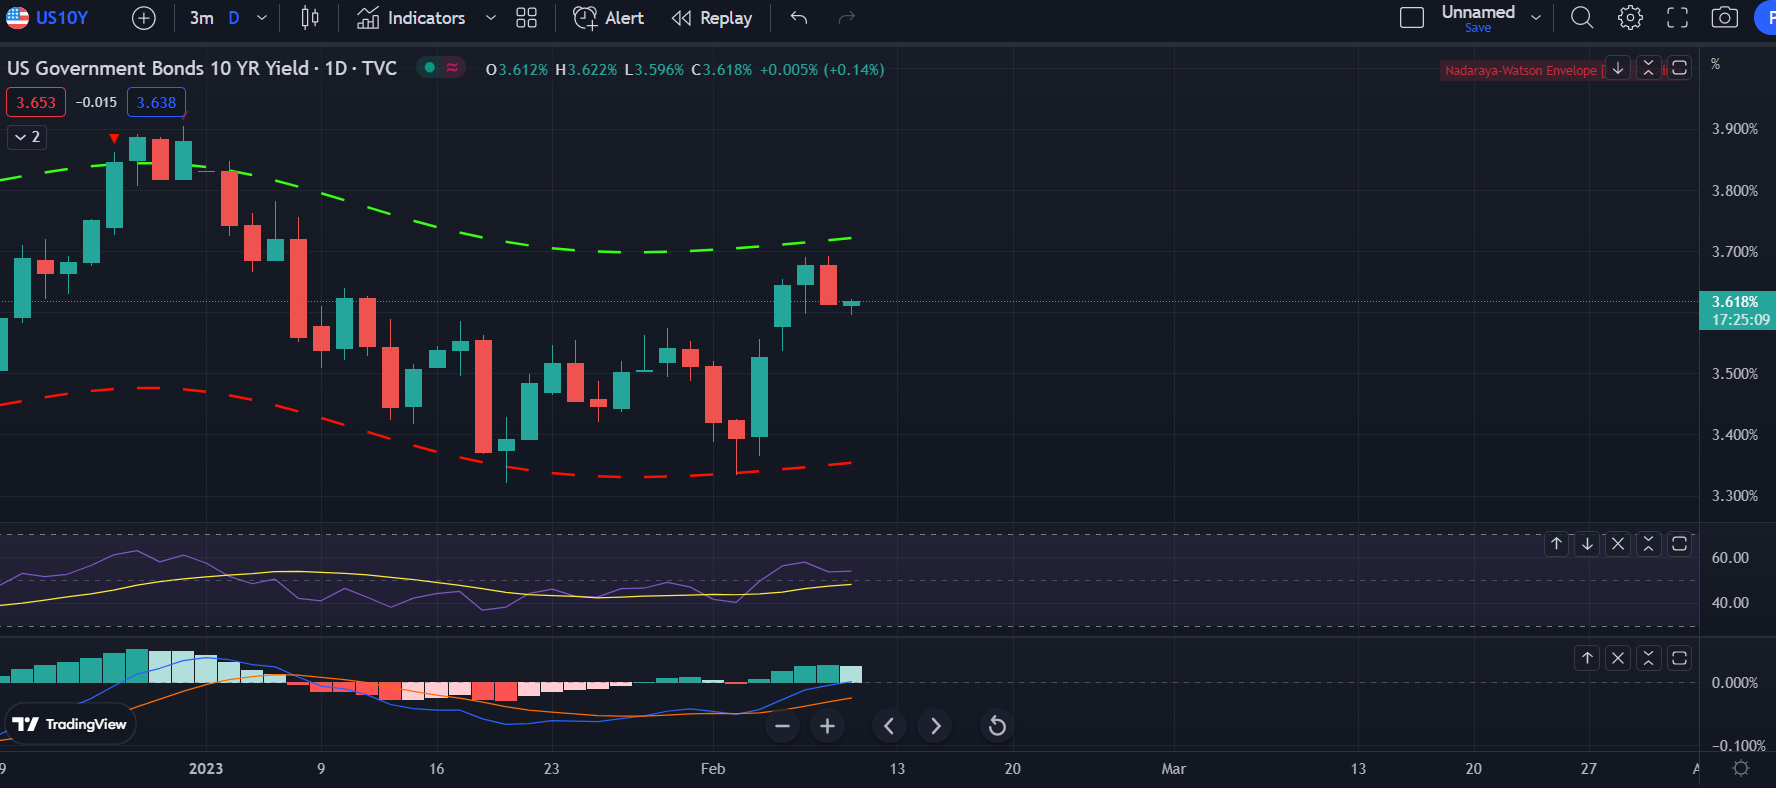
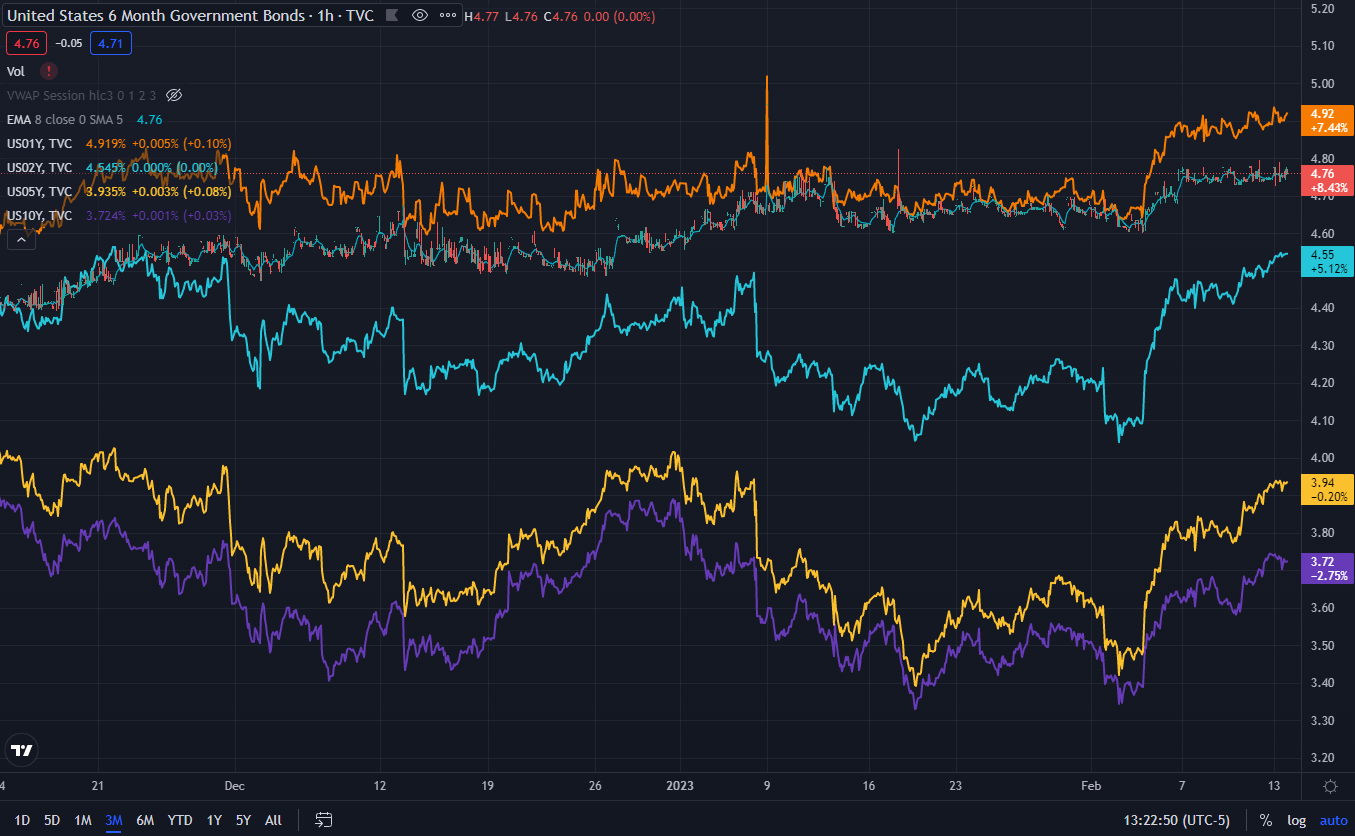
Now here are the biggest factors why I think downside is coming soon. The yields spiked hard when the job numbers hit super strong. Markets are starting to think that Fed will raise rates more or hold it for longer. Interesting to see.

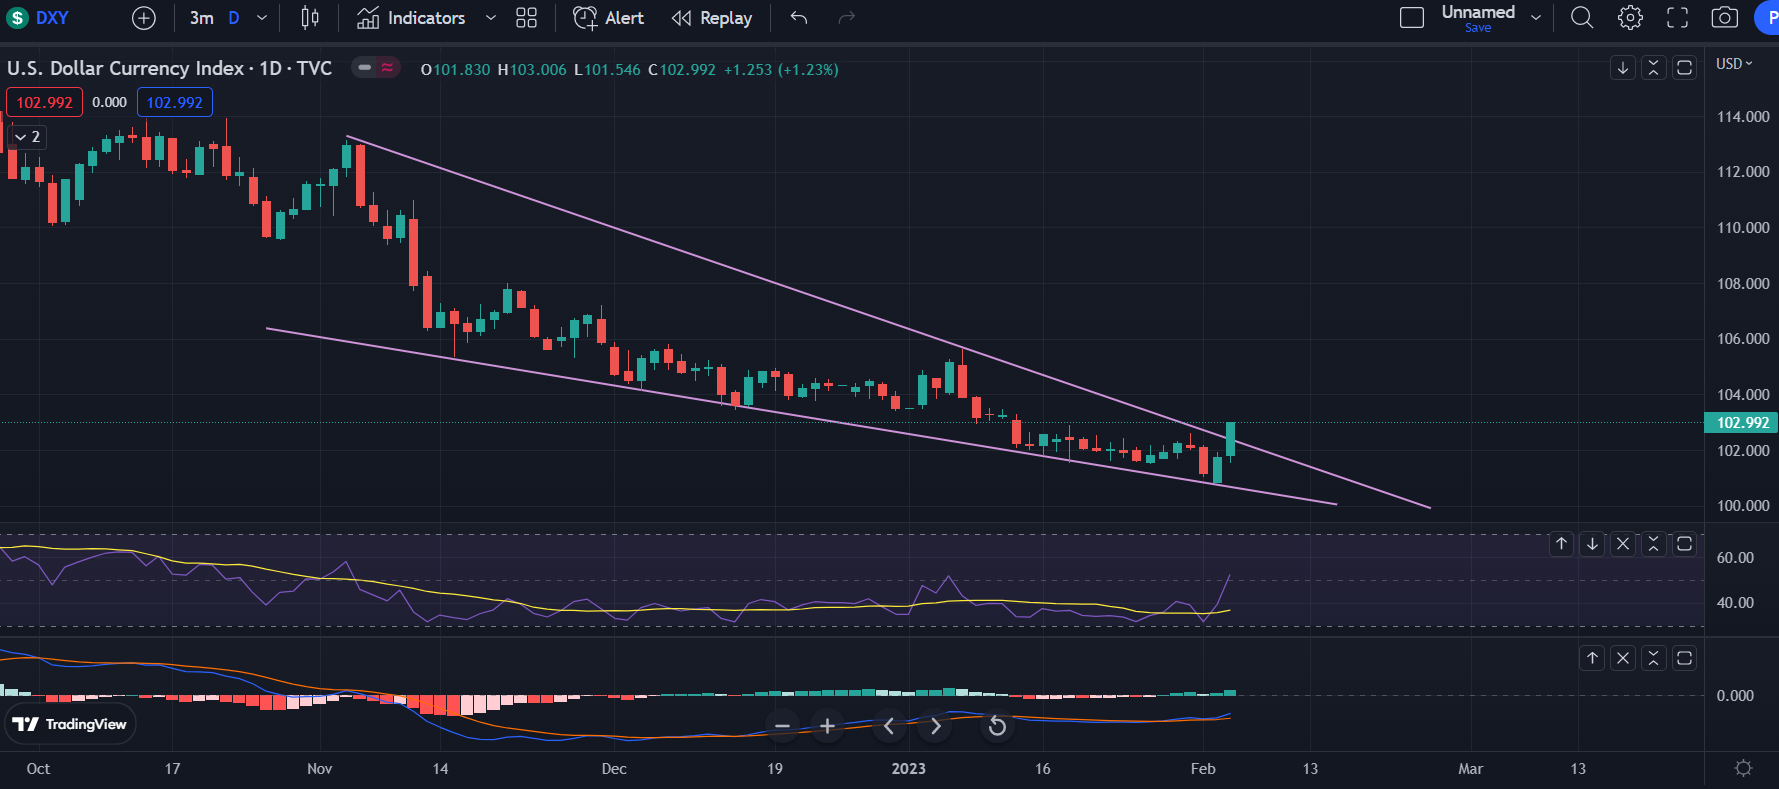
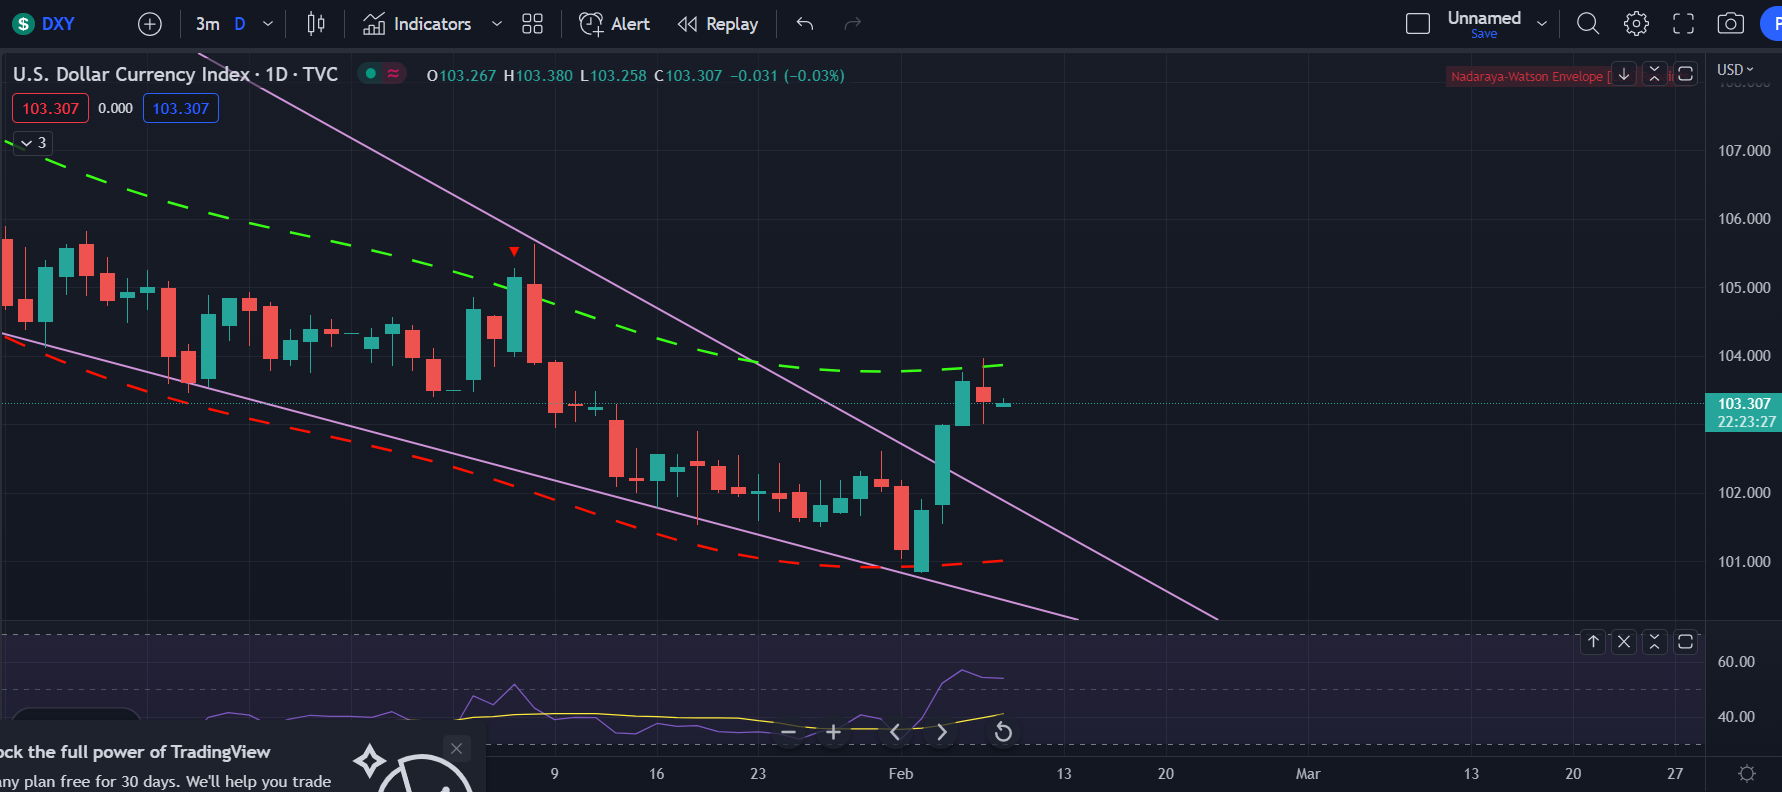
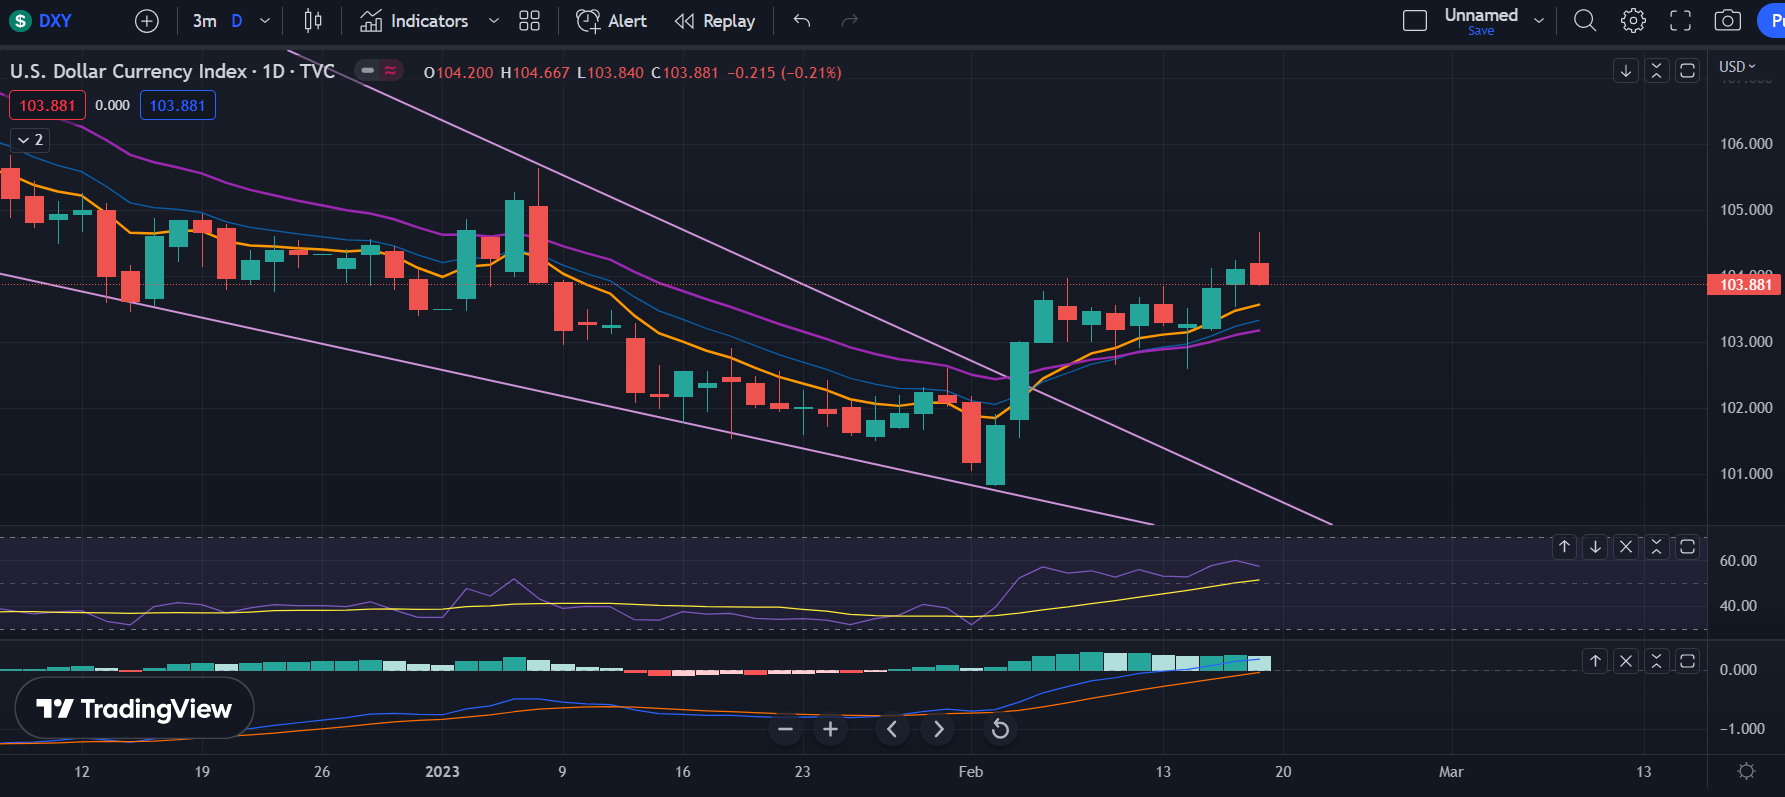
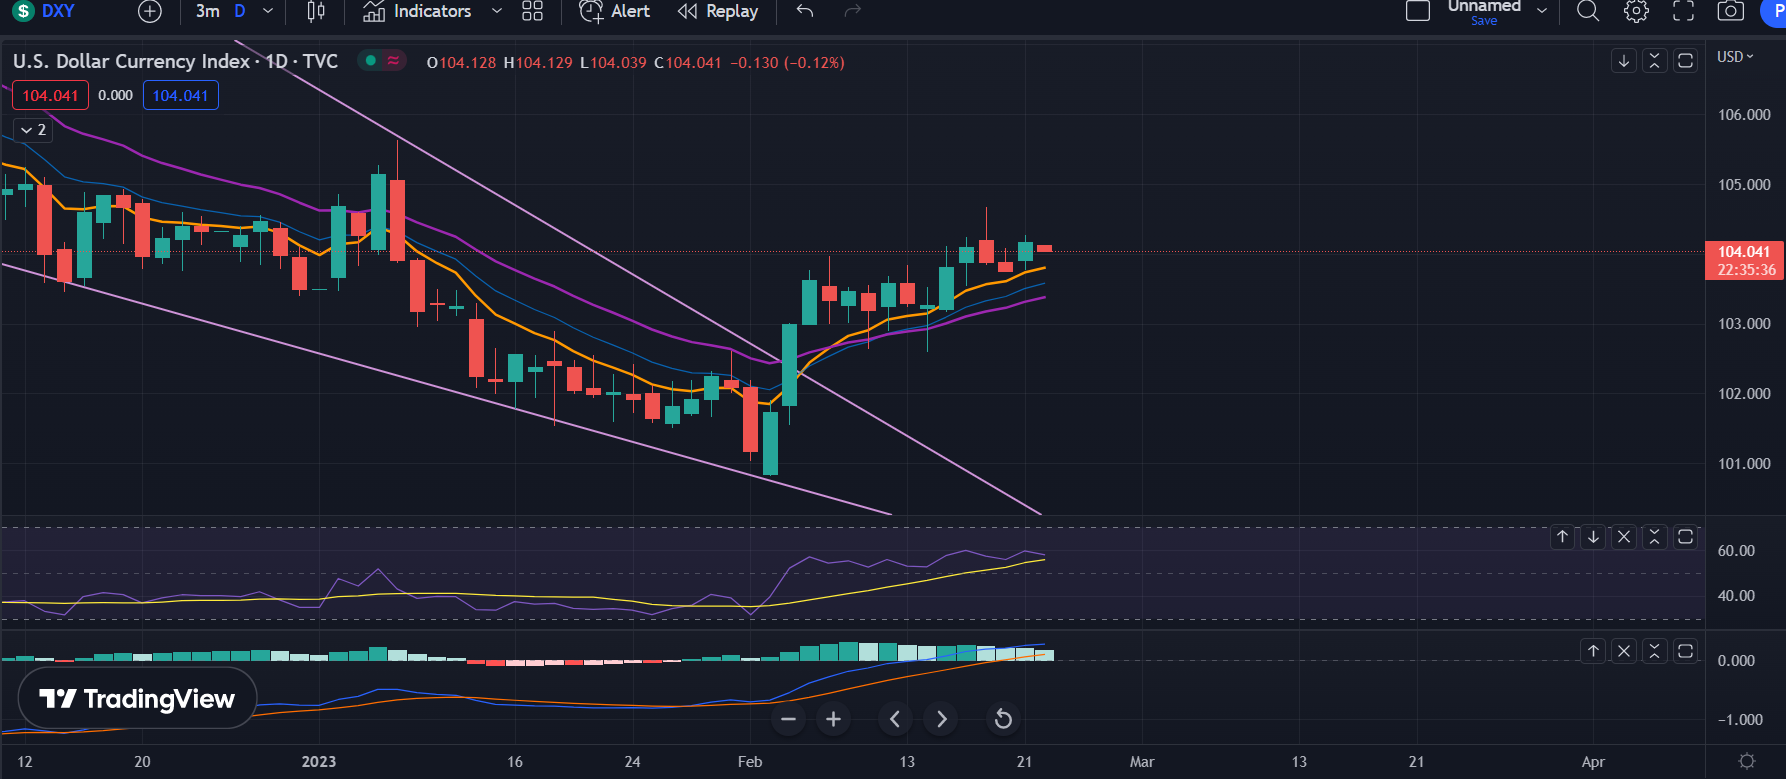
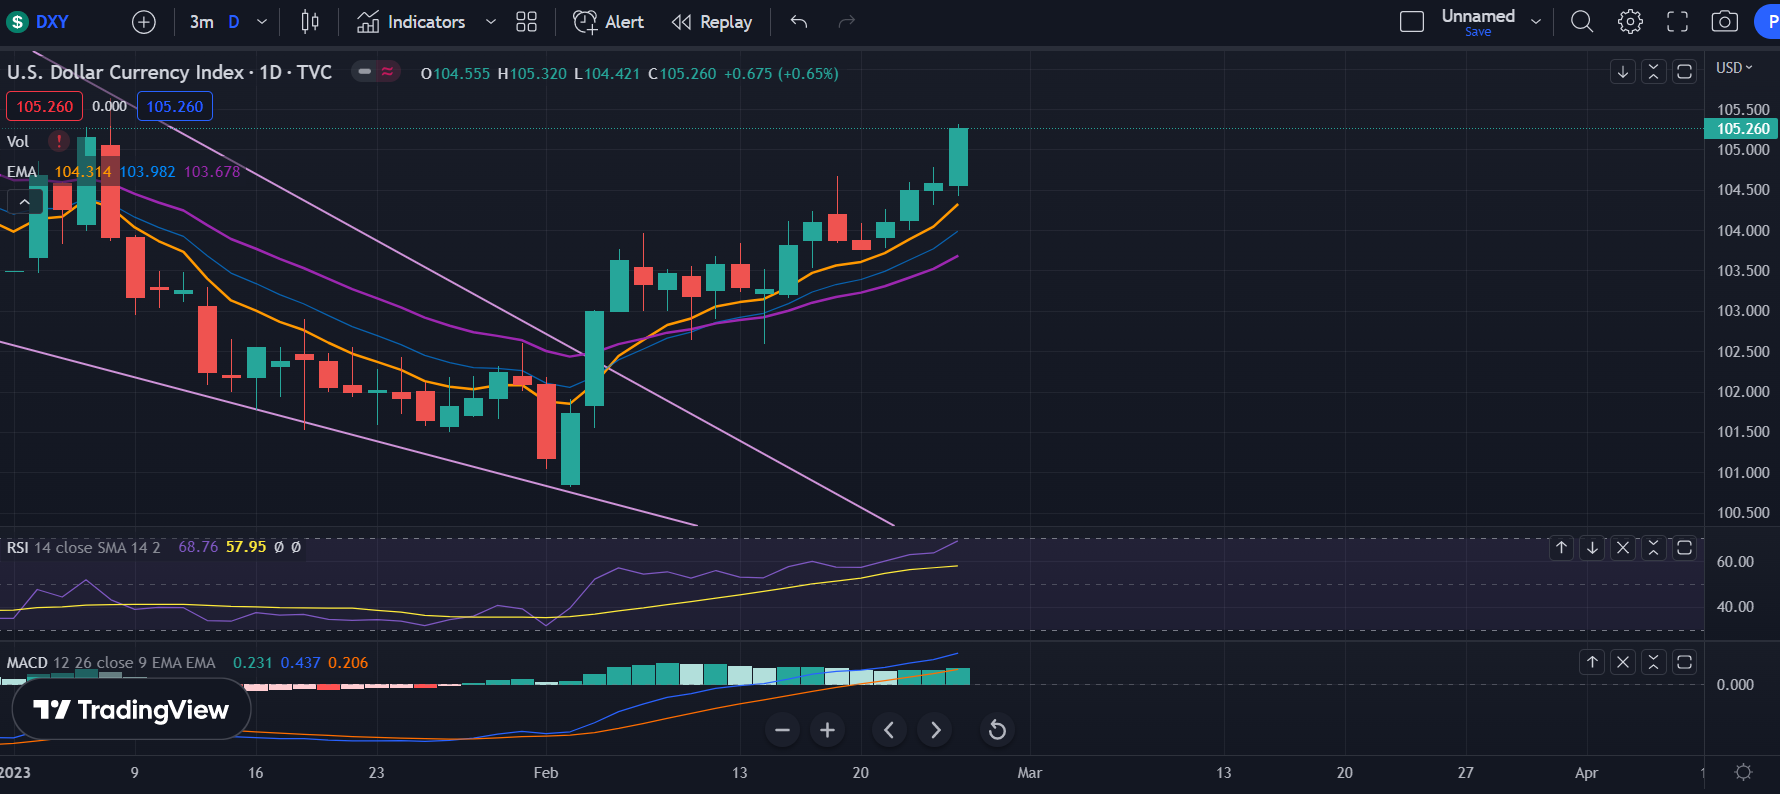
Another big thing that I’m seeing is that the dollar is breaking out. The last time the dollar broke out of the wedge, it was the December top, but it did lead to another big run, so we’ll see if this breakout leads to a huge rug pull or just another higher low form. We’ll see what happens with this breakout, but it hasn’t led to good things in 2022.

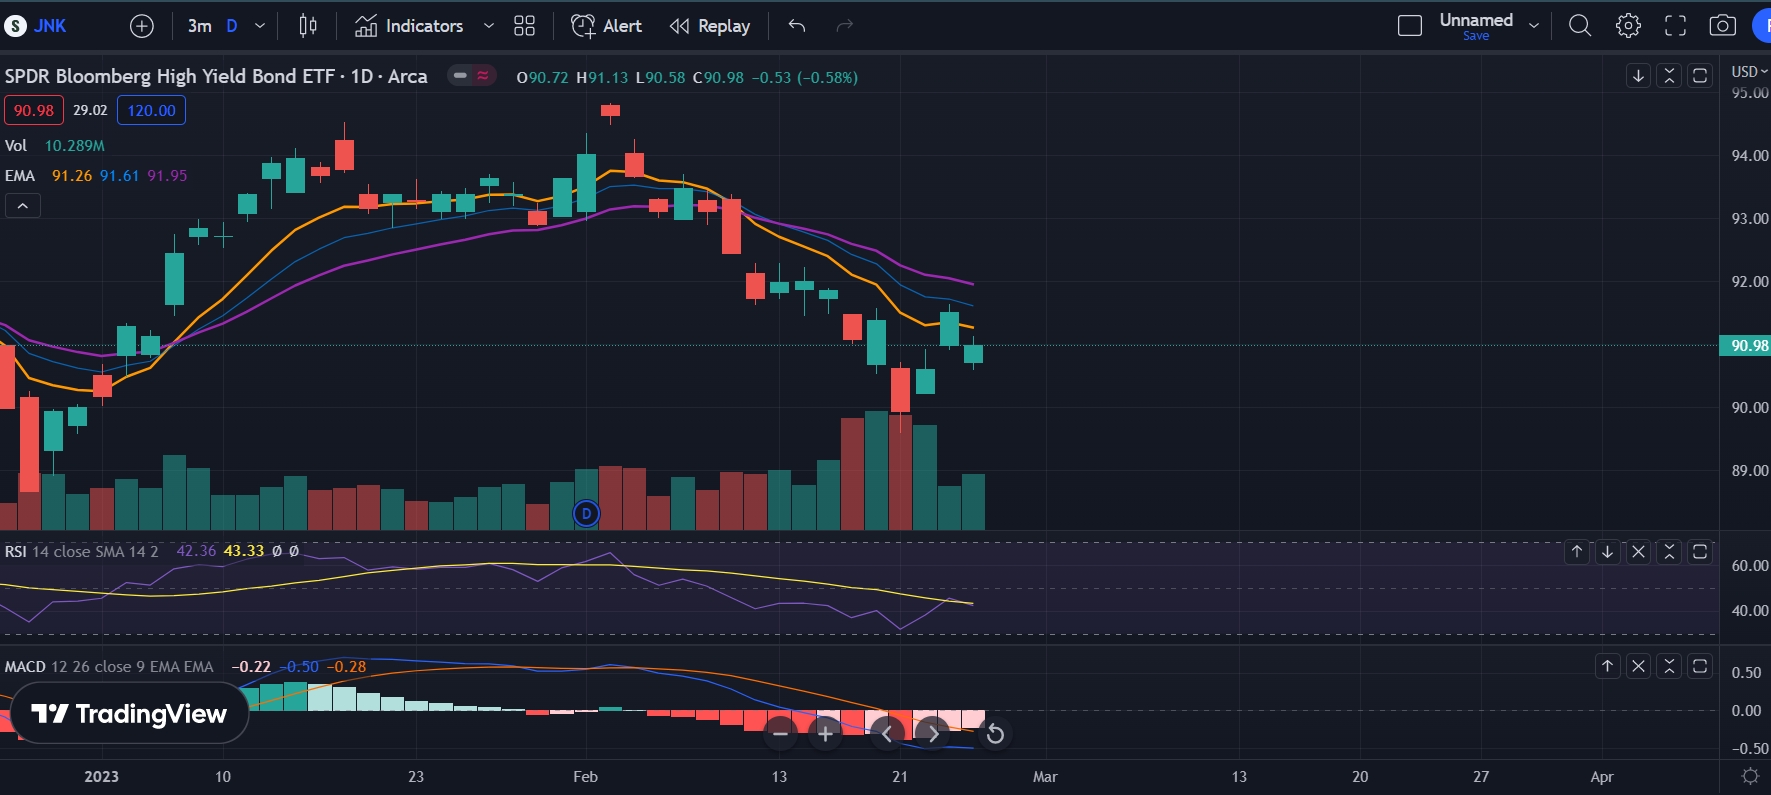
Another red flag I’m seeing is that the junk bonds got shat on and showing an island reversal. Interesting to see, but we’ll see if this is another red flag that’ll play out. If junk bonds are diverging from SPX, it typically shows that the SPX move is not supported.

Now another big red flag I’m seeing is that smart money is pulling out even more. I would think that smart money would be entering the markets if they thought that markets were going to go up more, but we’ll see if the rug pull comes soon. Smart money pulling out this heavily is not a good sign as it has marked the tops of the markets the entirety of 2022, not the exact tops, but around the same points. BUT something to say is that this isn’t a 100% accurate indicator. Smart money was pulling out hard during the post-Covid crash rally and then started re-entering way later on. Maybe this happens again and then smart money re-enters once they realize that markets aren’t coming down anytime soon.

Overall, red flags are flashing for downside on SPX, but we’ll see if any of them even play out. I do think that we’ll have a green day on Monday because VIX and SPY was both red and this typically leads to a green day, but we’ll see what happens afterwards. Good luck all.

6 Likes

Indeed, looking like both are really intent on pissing on the market rally cheerios. Bonds and DXY below. VIX is responding a bit too, and VIX call happening in size.

3 Likes

Sorry for the double post, but this is also important - we are about two weeks out from opex, and this is when gamma starts becoming more and more relevant.

All that net positive gamma over 4000 helps pull markets up. Vol trigger is 4020, so we have a lot of room for flows associated with MM hedging to still remain supportive. However, if we fall to the 4000 level things will likely change very quickly - we swing to negative gamma, and more importantly, that massive amount of calls will get dehedged, and puts will get hedged.

Essentially, we have this 100 points of cushion between now and opex (since SPX is around 4100 now). May make sense to get off the bull train if it looks like that level will get breached.

Having said that… the underlying market structure still remains bullish. Call wall is 4200, and Vix term structure remains relaxed. If these change, then it’s really risk-off season again. CPI on 2/14 and opex on 2/17 will have the decisive say on this.

6 Likes

TLDR: Dunno where we go from here, but we could just dick around here and range, or rail down.

On the hourly, it seems like we’re forming a base here. It seems like we’re setting up for the next move, maybe with the Powell speech tomorrow? Who knows, but it seems like we’re going to make a big move soon. RSI is below 50, MACD is heading towards below 0, but still above it. Overall, just seems like a mixed bag.

On the daily, we had another gap down day, but we didn’t rail down lower. This makes me hesitant to say that we’re going to get a waterfall selling now. I think bulls are still here holding it up, and makes me think that we’re going to have another rally up, maybe a rally to form a lower high. RSI and MACD are still bullish, bouncing off the 8 EMA and the trendlines, so who knows. On SPY, we had super lower volume today too. Interesting to see, just seems like markets are waiting for Powell?

VIX had another day up, giving more signs that we’re going to head lower. Dollar was also up, yields were also up and small caps (IWM) was down more. The DOW also didn’t participate in this rally at all, so it’s all showing sus signs that we’re going to get rug pulled. But, we’ll see when the rug pull comes because right now, it still seems like bulls are in control and bears aren’t going full on yet.

Overall, I’m still looking for a larger downside, but we’ll see if it even plays out. I’m still going to be bullish short term because the trend is strong, but we’ll see when it changes or if it changes. Good luck all

3 Likes

TLDR: I’m personally looking for us to make a new high. On SPX I think we reach 4200 to 4210, on SPY I think we reach 420.

So on the hourly, we weren’t able to break the uptrend lines and had a V recovery after the powell speech. This shows extreme bullish strength and combined with the fact that Powell didn’t say anything much new (although still bearish), I think markets will rally with this uncertainty gone. I forgot to put the MACD, but the MACD turned above the 0 line, maybe to form a bearish divergence.

On the hourly, all the indicators are turning back up and showing bullish signs. Volume increased from the previous day, showing that the follow through is likely. I think we’re on pace to form a bearish divergence, so I’m going to look for a higher high tomorrow before another pullback or the leg down.

The VIX came back down hard today, showing bullishness and that markets aren’t in fear right now.

One warning signt hat I am seeing is that the yields did get back up after getting shit on a bit. Seems like markets aren’t fully sold on a pivot right now.

But a good sign to see is that the dollar came down and this could provide relief for stocks to rally more.

Overall, markets aren’t full of uncertainty right now, lots of bullish momentum, indicators are showing that bears aren’t able to take control at all and all signs are pointing to us making a higher high. Good luck all.

3 Likes

TLDR: Since we didn’t go make the higher high, this is looking like a lower high setting up and more downside coming, but we are holding that uptrend line hella well so we could just bounce up here again.

On the hourly, we can see stuff starting to turn over. Breaking some trendlines, RSI below 50 and MACD back crossed over, but still above the 0 line. Kinda a mixed signal here, but we did form a clear lower peak, but no lower low yet. There is a chance we bounce, but we have not gotten a strong rebound at all, so downside may be coming.

On the daily, we had another low volume day looking at SPY. But on SPX, we finally see the RSI turning down clearly and breaking its MA and also the MACD starting to roll over. Things are still bullish though, so not all gloom. We also have an inside day, which is bearish. Dunno the probabilities on this candlestick formation, but it is known to be bearish.

VIX rose today, showing some signs that maybe we’re going to ehad lower on SPY. But still, seems to just be dicking around, so nothing concrete yet.

Interesting sign that I’m seeing is that the yields aren’t surging anymore. Interesting to see and maybe markets aren’t expecting such a huge increase in unexpected rate hikes.

Dollar is holding up strong here, so a little cautious to think that we’re all bullish.

Overall, seems like there are warning signals pointing to us heading lower, but we’ll see if that actually plays out. We are still very bullish so we could just buy the dip here. Watch out for what happens and good luck all.

6 Likes

TLDR: It seems like we’ll bounce into CPI and then go off of what the data is.

On the hourly, the RSI and MACD turned bearish, but it does seem like we’re finding support as we formed some solid bounces at the 4060ish level and looking to head up. This also makes sense since we’re still in a very bullish sentiment environment. Not much else to say other than the uptrend has changed though. We formed a lower high and a lower low so we’ll see if we form another lower high or a higher high.

The daily also shows some bearish signs. The volume was lower on the green day, but not by much so I wouldn’t put too much emphasis on it. What I’m looking at is a 21 EMA bounce into a retest of the uptrend lines and then rejection if we are starting a new downtrend.

Another bad sign I’m seeing is a double upwick candles on the weekly. But, we also didn’t have increasing volume on the weekly, so it’s not too confirmed that we’re going to go die now. The weekly RSI and MACD are still bullish, so we’ll see if it holds up.

VIX got shat on Friday, so I expect SPX to rally further into the Tuesday CPI data.

Some warning signs I’m seeing is that the yields are coming back up putting pressure on markets. This is making the bond market shit too, which isn’t looking too good for SPX. But, this could all change if the CPI data comes in well again and markets expect the Fed to not raise rates above 5%.

The Dollar is holding up well right now too, which makes sense since the yields are climbing back up. Probably putting more pressure on the markets.

Overall, seems like there are warning signs that we’re about to see a shitter down, but the CPI release has to support that move because if it comes in good, the yields and dollar should come back down and let markets crash upwards. I am expecting a rally into the CPI though, since we did form foundation for a bounce and VIX isn’t rocketing. Good luck all

Tl;dr: We could have three distinct movements: immediately after CPI report, into Fri opex, and after opex.

CPI and Opex

CPI will undoubtedly cause a bit of a movement in SPX/SPY. Unlike in Jan though, there seems to be some chatter around whether it will come in hotter than expected. This is not reflected in options vol. We are also in positive gamma territory (vol trigger is 4060, SPX is at 4127 right now), and the underlying option structure is supportive, with lots of call and put OI. (Both graphs from SG.)

Thus, unless CPI comes in absolutely horrendous and precipitates a selloff into below the 4000 level, option flows will likely be supportive and we could see 4200 by Friday, as vanna effects kick in as vol dissipates, and charm effects kick in on the last days into opex.

0DTEs add some amount of complexity to this. Would be good to keep an eye on live flows tomorrow. Again, unless CPI is terrible and there is overwhelming selloff, I can see smart money going in on 0DTE calls and adding boosters to the vanna/charm rallies. And if it looks bad-bad, we could see 0DTE add fuel to the fire. So 0DTEs could act as a signal of overall market preference early in the day.

After Opex

After opex, movement could be quite different, once these positional flows die down. Even a warmer-than-expected CPI report is still warmer-than-expected. And earnings are not coming in that great.

First, we have seen long end bond yields go up since the jobs report.

As MacroAlf notes, the 2023 rally basically seems to be the 2022 stocks or sectors that really got their sh*t pushed in. So more “reflexive”, with a large dash of short covering thrown in perhaps. (Graph originally from GS.)

MS points out that we are in negative EPS territory now, and its correlation to a correction:

Forward earnings growth is now negative, Morgan Stanley’s Chief U.S. Equity Strategist and Chief Investment Officer Mike Wilson points out. Each of the four times that has happened since 2000, stocks have had a meaningful correction.

All in all, irrespective of whatever happens into opex, we could still see a slide starting next week.

5 Likes

FWIW, JPM posted another “game plan”.

I don’t even know who or what Truflation is but they claim to have a pretty decent track record at CPI forecasts. Their prediction is 5.8% which falls within JPM’s 5% probability.
https://twitter.com/truflation/status/1625173317035474954

Our YoY US CPI forecasts so far:

Oct 2022: 7.7%, actual 7.7%
Nov 2022: 7.4%, actual 7.1%
Dec 2022: 6.5%, actual 6.5%
Jan 2023: 5.8%, actual ?

Our MoM US CPI forecast for Jan is +0.2%

All forecasts are an approximation based on the correlation between our index and the US CPI.

1 Like

What is the time frame on the S&P 500 reaction estimation? Looking back the last few months, the reaction prediction by JPM isn’t very accurate if that is supposed to be in a one day timeframe.

Either way, with today’s market movement of gaining +1.17%, It would seem a lower CPI reading is expected for tomorrow and we can include this “Pre-CPI” rally into any positive reaction.

2 Likes

TLDR: I think that we’re going to get a green Monday to fill the gap and maybe head up a little higher. This is combined with VIX hitting over 10% in one day and us finding strong buy support on Friday. I still think that this will be a countertrend and we’ll head much lower (not to 365 by march).

So on the hourly, we did fully change the trend. We formed a lower high and a lower low. The MACD and RSI are both in the bearish range and we’re in a downtrending 8/21 EMA. But, we did form a foundation in the 4050 area and bouncing off from there. There was solid volume from there as well with multiple touches at those levels. Bulls are clearly still here trying to not let this turn into a massive downtrend so we’ll see how much higher we’ll go. Something interesting to note is that the gap fill is near the 21 EMA too, so maybe we just fill and then drop? We’ll see.

On the daily, we had an increasing buy volume day with a bottom wick. This is showing buyers coming in to support this move and seems like we’re going to get a follow through day. The RSI on the daily is still above the 50 level and the MACD is still well above the 0 line. Overall, seems like the start of a trend reversal, but given the massive bullish momentum, we’ll see if bears can take control. I’m looking at 4090 to 4110 to top, but given this retarded market, we’ll prob make new highs.

On the weekly, we are seeing some bad signs. we have 3 top wicks on the weekly candles, showing that bears are still here stopping bulls. Slowing momentum and possibly a sign that next week will be red. But the RSI is still above the 50 level and the MACD is starting to cross up over the 0 line so we’ll see.

The VIX had a positive 10% day on Thursday. This means that we’ll have a green day in the next 2 trading days 85% of the time. Seeing as how Friday candle played out, there’s a good chance that Tuesday will be the green day (bc markets are closed Monday). Another sign that tells me that we’ll probably rally Tuesday is because the VIX had a fat red candle.

Something that I’m watching too is the yields. Yields seems to have stopped going up too much now. Seeing the red on yields Friday gives me more confidence that Tuesday will be green. But we’ll see if this is just a random red in the new uptrend.

The dollar also had a fat top wick red candle. This also should show strength in the markets and more room to run Tuesday.

The final thing that I’m watching is the JNK. It had a big buy up with big volume. Even though it’s making much lower lows than SPY, showing that SPY is probably going to head lower, this massive buyup gives me more confidence that we’ll get a follow through green day that could last maybe one to couple days.

Overall, I am expecting a bounce before a big move down. Good luck to all and enjoy no trading on Monday.

3 Likes

SPX is down 1.4% an hour and a half into trading this Tue. It could just be the post-opex hangover when all those calls that expired on Fri are now de-hedged, or it could be the equity market catching up with bonds and DXY (or both). It usually takes a day or two for the post-opex flush to happen, so we’ll know which it is if this sell-off persists strongly into tomorrow.

As with other post-opex periods, the next two weeks are when underlying options positions have much less of a say and markets are free to flap around more.

For clues on direction… we’ll likely have to wait for FOMC Minutes on Wed and PCE data on Fri to see where markets go. Since we just got unpinned, “anywhere but here” seems to be a decent bet at this point.

We are in a bit of a tricky situation over all. Note the SPY OI distribution below (tried to pull SPX on Tradytics, failed…) That’s a lot of a puts that will start dragging us down as they come ITM. Vol trigger is SPX 4050 and SPY 408, so we are in somewhat negative gamma territory already.

All in, if markets react negatively, it can fall a bit as the supports we had the last two weeks are no longer there. And then could get stuck there as quarterly opex positions consolidate around that position starting two weeks from now. To prevent this from happening, markets will have to reliably stay above 4000, I think.

SG has a decent thread out today with some additional thoughts.

5 Likes

TLDR: Who knows where we go from here in the short term, but I’m still bearish and think that we’ll continue to head lower. Would I buy puts here? No, but the probability of going much lower than right now isn’t too high given the massive supports we’re at and how much we’ve sold off in 3 days.

On the hourly, we have 2 gaps to fill to the upside. Maybe we fill them tomorrow with the FOMC minutes where there’s nothing too hawkish and markets rally with that and shorts take profit and squeezed. But that’s just a guess. But the hourly looks very bearish. ONe thing to take into account is that the RSI isn’t going lower even though the SPX was going lower. Maybe showing that we’re going to bounce soon, but bears are very strong right now and I wouldn’t bet on calls until the bounce is confirmed.

The SPX on the daily had solid sell volume and everything is turning bearish. Now I’m going to be looking forward to another lower high to form to continue the downtrend. The RSI is now below 50, MACD is fully turned over and looking to get below 0. I honestly don’t expect us to break below 4000 and close on the weekly because of the amount of puts at 4000 expiring this week, but we’ll see how strong bears are and if we continue to sell off since we have seen 4-5 days of strong selling all of 2022.

One thing that makes me think that we’re going to get a bounce with the FOMC minutes or in a couple days is because the VIX had a 10%+ green day. Shows that there is a 85% chance that we’ll have a green day in the next 2 trading days. But VIX is now looking like volatility is coming back and it’s looking strong above 20.

One thing I’m watching is that the yields are continuing higher, showing that this sell off is probably not a pullback into the next leg higher.

The dollar is continuing higher, but not as strong as 2022. Interesting to see, maybe this sell off will end soon and we have a bounce before heading lower.

Looking at junk bonds, it shat down hard again with big volume. Shows confirmation of SPX sell off and given how far it sold off, I’m going to bet that SPX is going to head a lot lower than here.

Overall, I am expecting downside, but I wouldn’t enter puts here. Maybe that’s not a good idea because these strong selloffs could last another $5-10 before a bounce, but not too confident in a continued sell off here. I’m betting on a bounce with FOMC minutes and maybe a selloff with the PCE. Good luck all.

1 Like

TLDR: I expect a bounce tomorrow up to the 21 EMA and maybe a little above so around the 4030 to 4050 area. On SPY/SPX I think either to the gap fill or slightly below.

On the hourly, the RSI has formed a bullish divergence and the MACD is turning back up. We had a strong bounce EOD today, showing some strength. We are near some big supports, we tagged the 397 support on SPY and bounced strong. I’m looking at another retest to the 4000/400 area and then maybe sell off with the PCE data which will probably be hot since all the other inflation stuff was hot too.

On the daily, we had another strong volume day, but not going much lower. Shows that bulls are holding this area and we’re going to need extreme volume to break through this area. Overall, daily looks bearish, but combined with the hourly charts forming divergences and at strong support, I expect a bounce soon.

Another reason why I think that a bounce is coming is because of the 10% green day on VIX two days ago and it making a solid move down. Shows some signs that we’re going to get a bounce.

The yields kinda moved down today. I think that this should give stocks some room to run up, not hella up because this is still a red candle in an uptrend, so I am just expecting a countertrend before the next leg down. The junk bonds moved up today because it’s basically the inverse of yields so there’s some signs pointing to upside.

The dollar continued to move up, showing that if we do get a bounce, it would just be a countertrend.

Overall, I think there are signs pointing to a bounce, but during these strong downtrends, there have been times where we didn’t get a bounce until we were in the extreme oversold areas in the RSI and moved another 2-5% down before a significant bounce. Given that this is a strong downtrend, I would see if we’re going to get the strong bounce or continue to sell. I’m betting on upside to rally into the PCe and then sell off, but we’ll see what happens. Good luck all

3 Likes

Nice setup with SPY - right in that wedge, and on the 50SMA.

The SPY400/SPX4000 line saw action yesterday, but it was not breached conclusively. Post-opex related de-hedging flows should be more or less done. Unless PCE really surprises us tomorrow, it is possible the bloodletting is done for now. We probably want to keep an eye on whether the lower line of the wedge or the 50SMA level is breached.

3 Likes

TLDR: Seems like we’re going to have a bounce soon, but with this strong selling, we could also just keep selling down.

On the weekly, we finally had a follow through on the top wicks. This makes me believe that we’re going to get some more weeks of red candles, but we’ll see what happens. The volume on the weeklies do show continued strength (looking at SPY) and the RSI and MACD does seem like it’s turning back down towards the bearish momentum. Not much else to say other than we’re at the 21 EMA where we have bounced a couple times so it wouldn’t be out of the world if we had a good bounce next week before a continued selling.

On the daily, we have lots of bottom wicks, with a heavily increased buying on Friday close. Given the bottom wicks and us trying to hold this level, I’m guessing that bulls are stepping in here and shorts are taking profit. The MACD and RSI are bearish so I would expect the next rally to just be a countertrend rally.

On the hourly, we have multiple bullish divergences on the RSI with each low having a higher low on the RSI. The MACD is also forming a bullish divergence. This makes me think that we’re going to have a rally soon. There are lots of gaps above so I’ll be looking for the rallies to fill those and then stop around those areas.

Another reason why I’m expecting a rally is because the VIX isn’t shooting up right now. But VIX is kinda fucked because of all the 0DTE so who knows if this actually means anything

The dollar is surging now, giving me confidence that we’re going to have a solid move down. I’m expecting all rallies to be sold at this moment and for selling to continue stronger.

The yields did go up higher too, making the bonds go down. But they still had a slight rally, showing that there’s some strength incoming in the markets. Because the junk bonds weren’t continuously moving down even when the yields were moving higher, I think bulls are trying to gain control here and move back up.

Overall, I am expecting red weeks ahead, but I expect some kind of rally early next week that will be sold off and finish the weekly candle with a big top wick. We’ll see how correct I am or if I’m just here drawing crayons. Point is, lots of bullish divergences in a downtrend which should lead to a countertrend rally to more downside.

3 Likes

I’ve been paying particularly close attention to the weekly charts as of late and I agree that we could get a rally or we could keep going down, and I’m pretty sure we’re not going to have to wait long to figure out which is going to happen. At this point it does seem more likely to me that we run back towards the 380 level before we re-test 411 again, but also looking at the weekly candles gives us some perspective on how long it could take for these things to materialize. The last time we touched 375 it took us 8 weeks to recover, but it only took 4 weeks to get us there.

We’ve had a few consecutive red weeks now but they haven’t exactly been commanding red weeks. Looking at fibs, our last step down erased just over 50% of the impulse, and we’re at basically the same levels right now. There would be grounds for a psychological reversal here just based on good old fashioned dip buying.

Tomorrow morning we have impactful news in the way of Durable Goods. The market is currently pricing in a significant reduction from last month (delta of 9.6% MoM), and if it falls below this I believe in accordance with our inflation narrative we will probably get that rally. If it falls above this or comes in positive, though, we may be on our way back towards the 380 levels sooner than later.

In the spirit of TA though, another fun note is that on the weekly this is exactly what we’d want to see in the form of a more traditional double top. Anyone with longer dated positions should keep their eyes on the news because the TA stars are aligned in such a way that a move in either direction could be one of those trains you don’t want to miss.

6 Likes

Agree with both of you that it feels like market could go either way. I’d go so far as to say that this week will likely determine the direction into March opex. If we do not manage to sell off enough this week, we may rally for the two weeks after.

Reasons to expect a continued selloff:

  • We closed below 50 SMA and just below that wedge. (Image 1) One or two more days below the wedge and below the 50SMA should really signal a solid bear move.
  • Bonds are up. 6M and 1Y are up by about 25bps, and 2Y, 5Y and 10Y are up by about 75 bps. This is sizeable. (Image 2) Image 3 shows the gap between US02Y (inversed) and SPX.
  • DXY is also going up, which should be bearish for stocks. (Image 4) Although this move is likely because of bond yields so its not a primary driver itself.

Yet… I don’t feel the kind of certainty I’ve felt at other times where a post-opex dump felt pretty certain (and delivered). Reasons:

  • We had a drop the day of, and the day after opex, but since then, every day has been a range day. (Image 5) Lots of intra-day volatility thanks to 0DTE, but the days did not look like a selloff was happening.
  • Bonds are up, yes, and so is DXY. But… they aren’t going to go up indefinitely. A 75bps on the 2Y is plenty, and the 10Y is just shy of 4%. The drop in bonds (and therefore rise in yields) may be coming to an end, in which case, so would the pressure on stocks.
  • A ton of puts have come in to provide support, so drops should be more contained. And folks are also adding calls, including many 4200 ones, which indicates bullishness. (Image 6)
  • End-of and beginning-of month flows will kick in shortly, which are always bullish.

Three additional factors:

  • Vol trigger is at 3950, which is just 20 points below where markets closed on Fri. This is the point where MMs stop being supportive and start moving with the market. If we end up a fair bit below 3950, we’re more likely to be in trouble.
  • It doesn’t matter as much for next week, but Mar opex is massive. The flow and hedging effects from those will kick in next week for sure, maybe even toward the end of this week. Those seem supportive so far.
  • 0DTE options are increasingly determining intra-day market movements. While they have not broken something horribly yet, they could tilt us to one side (the downside…) hard enough that they ignite the self-fulfilling feedback loop of a sustained drop.

All in, its a lot to consider. Overall, unless we decidedly embrace the downside Thu, I’d prob get into bullish positions up to Mar opex (3/17). Most important data point btw is probably the ISM Manufacturing Index on Wed.

3 Likes

TLDR: I personally think that we’ll rally up, but anything can happen like another couple weeks of range or us breaking the support and another waterfall selling.

On the hourly, I’m seeing a formation of the inverse head and shoulders with an island reversal (where we have a range and then a gap before and after so it looks like a part of the price action is completely separate from others). The bullish divergences seem to be playing out tooo. We also bounced off the left shoulder’s bottom so I’m seeing more signs that we’re going to continue to rally from here. The MACD is looking strong showing momentum, the RSI isn’t breaking below its MA and given the upwick on the final candle, I’m going to guess more upside.

On the daily, we have a lot less volume, which made sense given how slow moving everything was today. Also had an upwick but given the low volume, I’m not going to give it too much strength. We did bounce off the 8 EMA though, so there are a mix of bullish and bearish signs on the chart. The MACD seems to be bouncing off the zero line, so there’s that.

The VIX moved down lower today, confirming my bias that we could see more upside from here.

The dollar also gave back all its gains from Friday, giving markets more room to breathe. Bullish signs.

Another bullish sign that I’m seeing is the Junk bonds continuing to track higher. This is a good sign to see and shows some bullish strength in the markets. The yields seems to be flattening out too, giving markets less pressure to the downside.

Overall, I am seeing more bullish signs than bear right now, but anything can happen so I’m gonna try to limit my bias when trading. I expect to see more green this week, but we’ll see what happens. Good luck all.

3 Likes