SPX Tech Anal: March is when Bears wake up

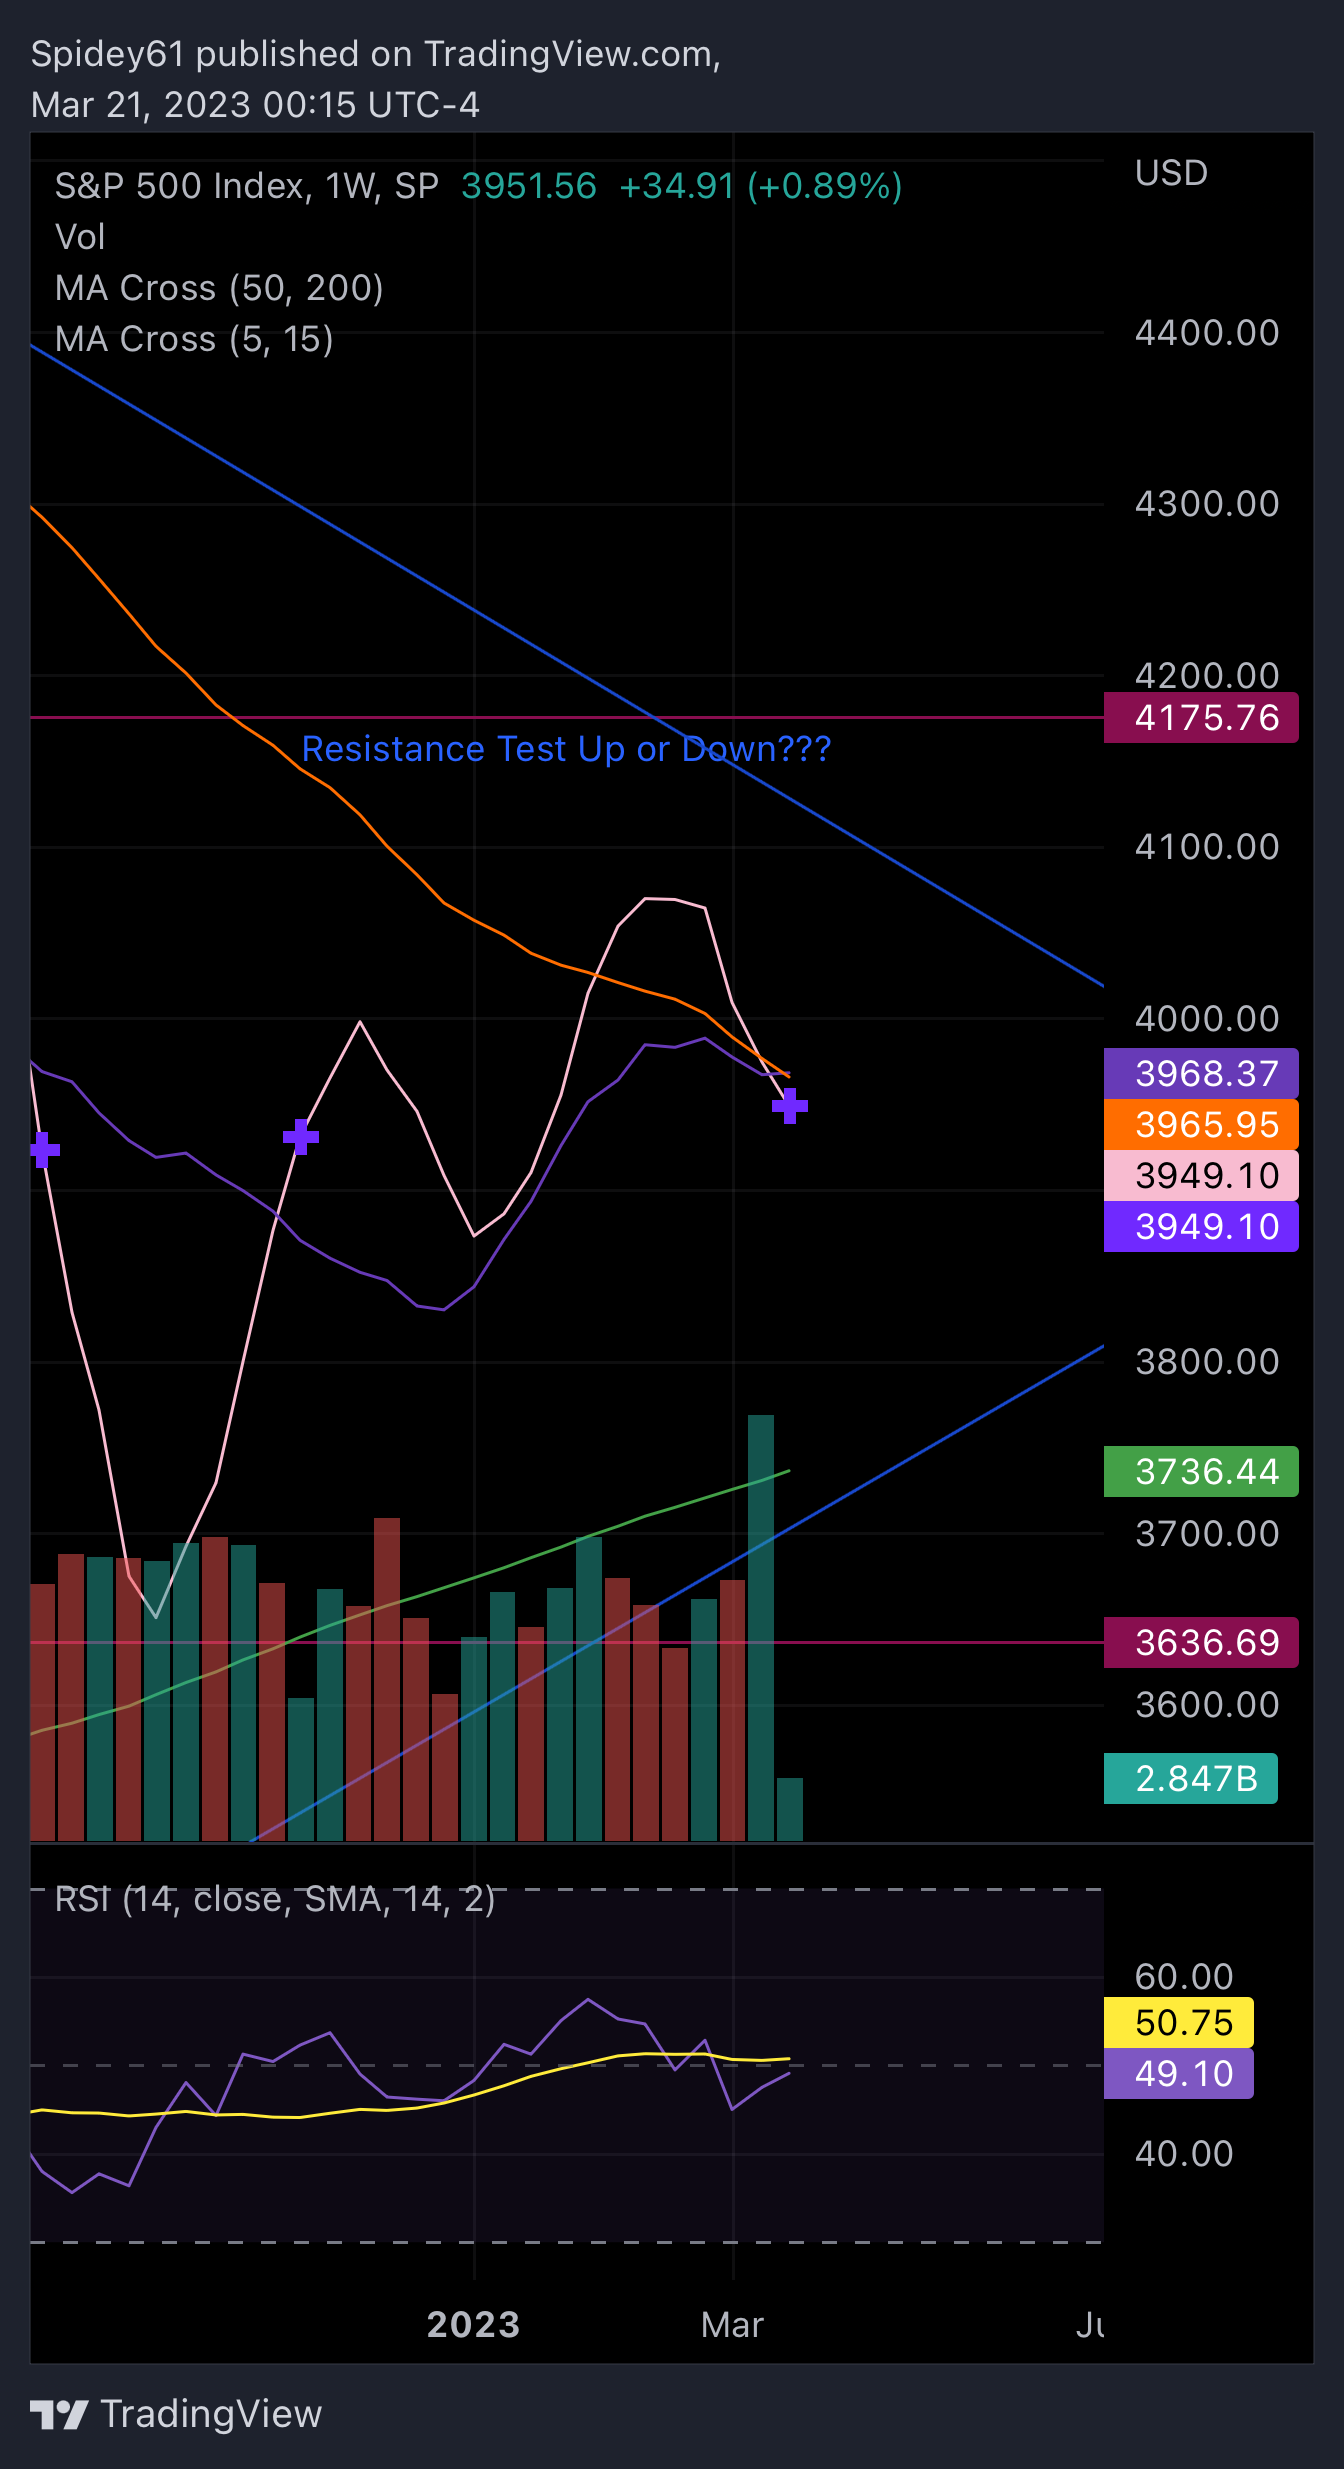
TLDR: Given the monthly candle close and the constant selloffs with increasing volume, I am kinda leaning towards more downside than a rally into more downside.

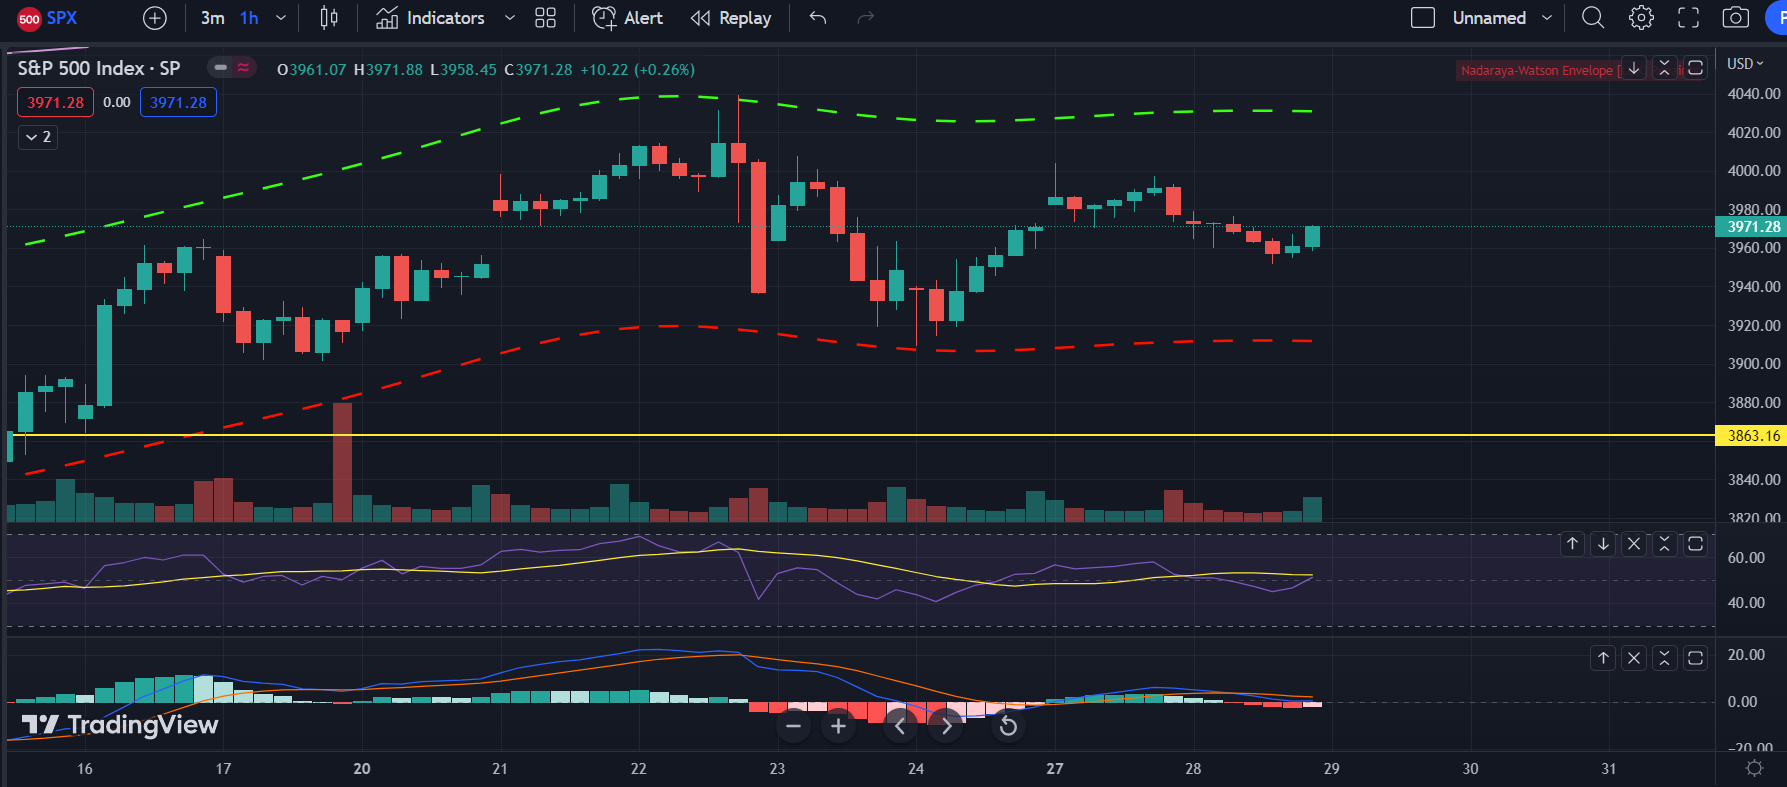
On the hourly, we see multiple bullish divergences on the RSI and the MACD. We have a bigger divergence with the previous 2 lows and another smaller bullish divergence with today’s double bottom. Seems like we want to rally up given the bullish divergence, but there is not enough bullish momentum.

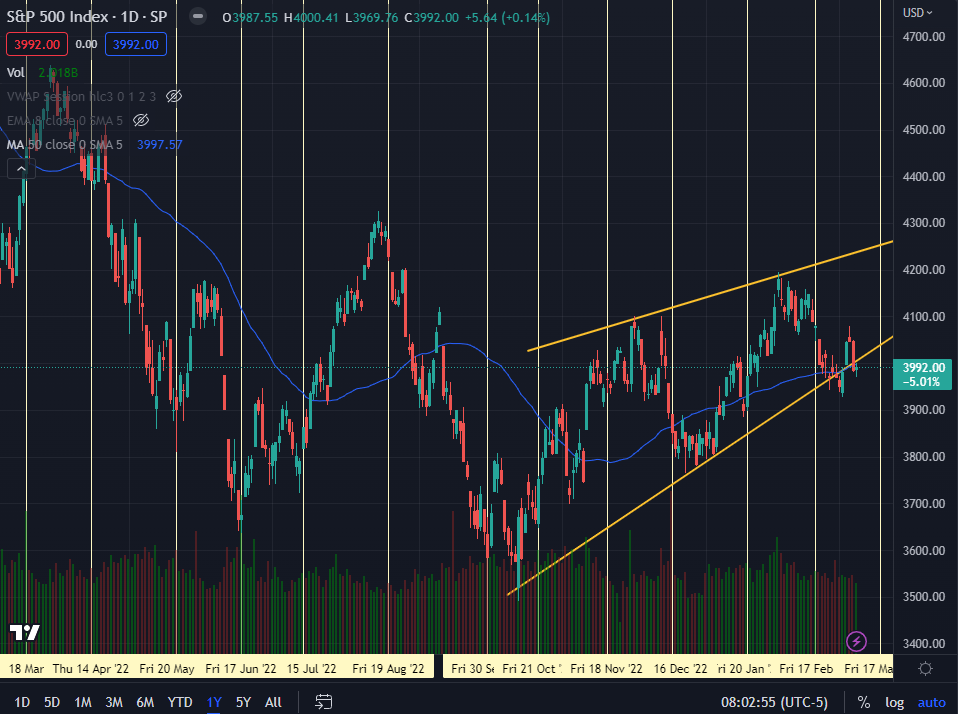
On the daily, we have increasing volume with another upwick. Seems like there are lots of buyers here not willing to let SPX fall to the ground, but there are equally the same number of bears looking to push it down. We also broke an uptrend line that it seems like we backtested and now heading lower. The RSI and the MACD are looking strong to the downside.

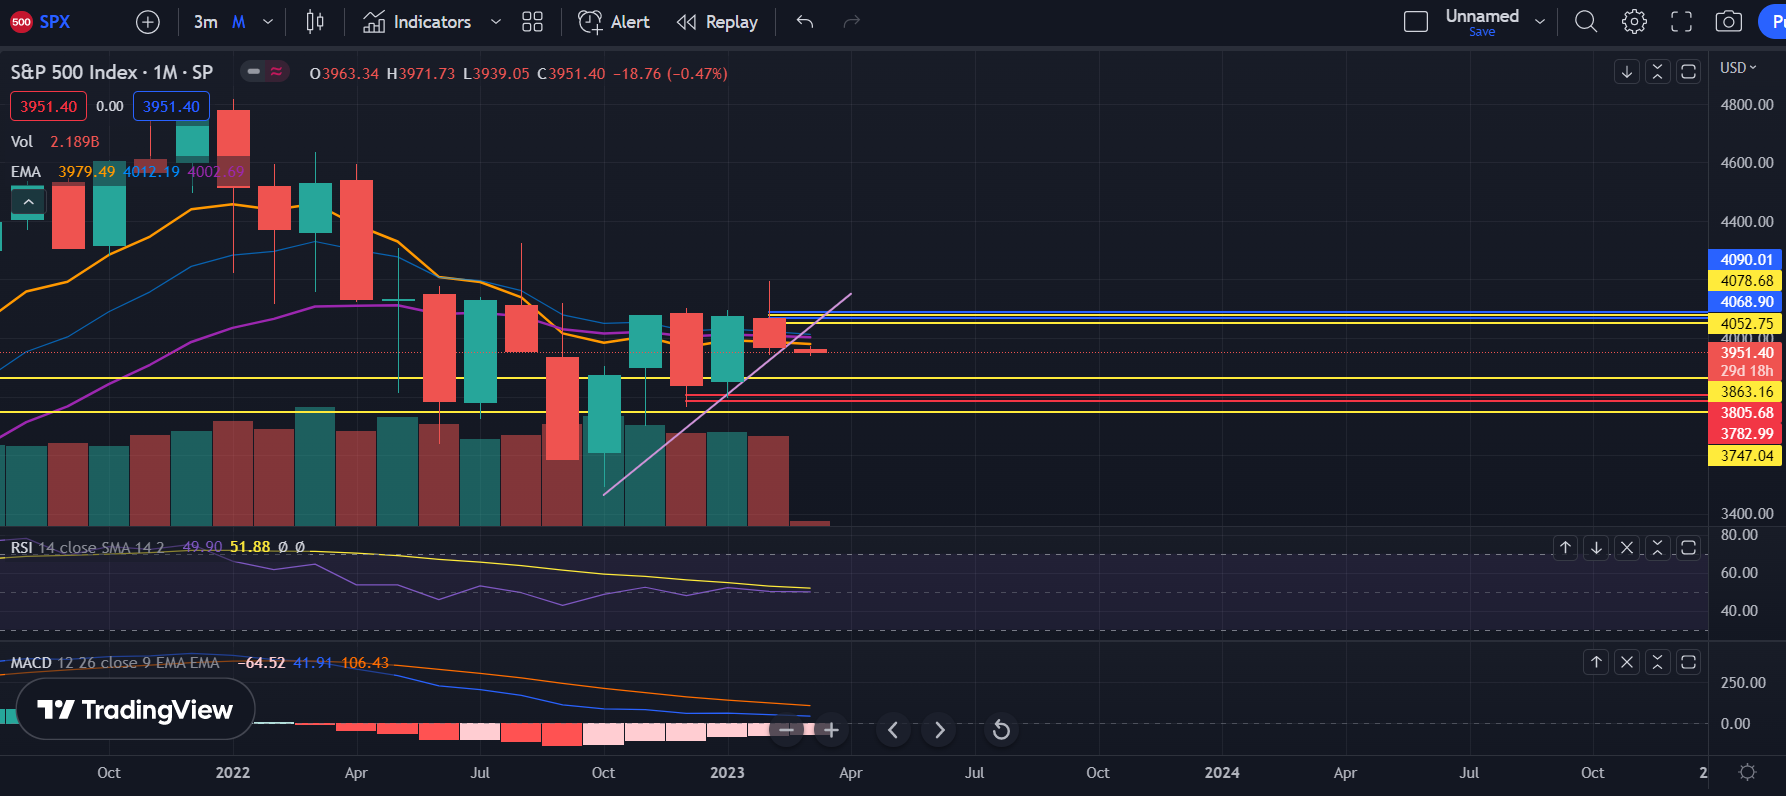
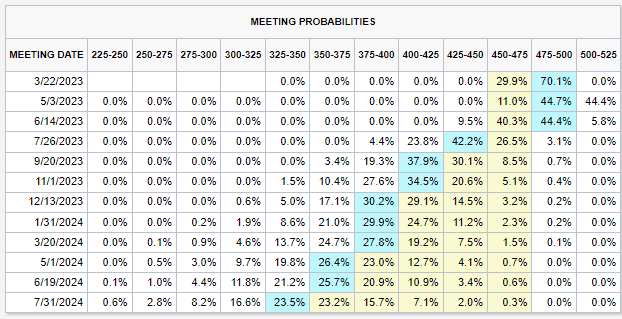
On the monthly, we had a big upwick with us ending red. On the monthly candles, we usually don’t need confirmation and stuff just happens immediately. The last time we had a major upwick with a red close, we had a huge red month. I expect a similar thing to happen here and us to have another red month.

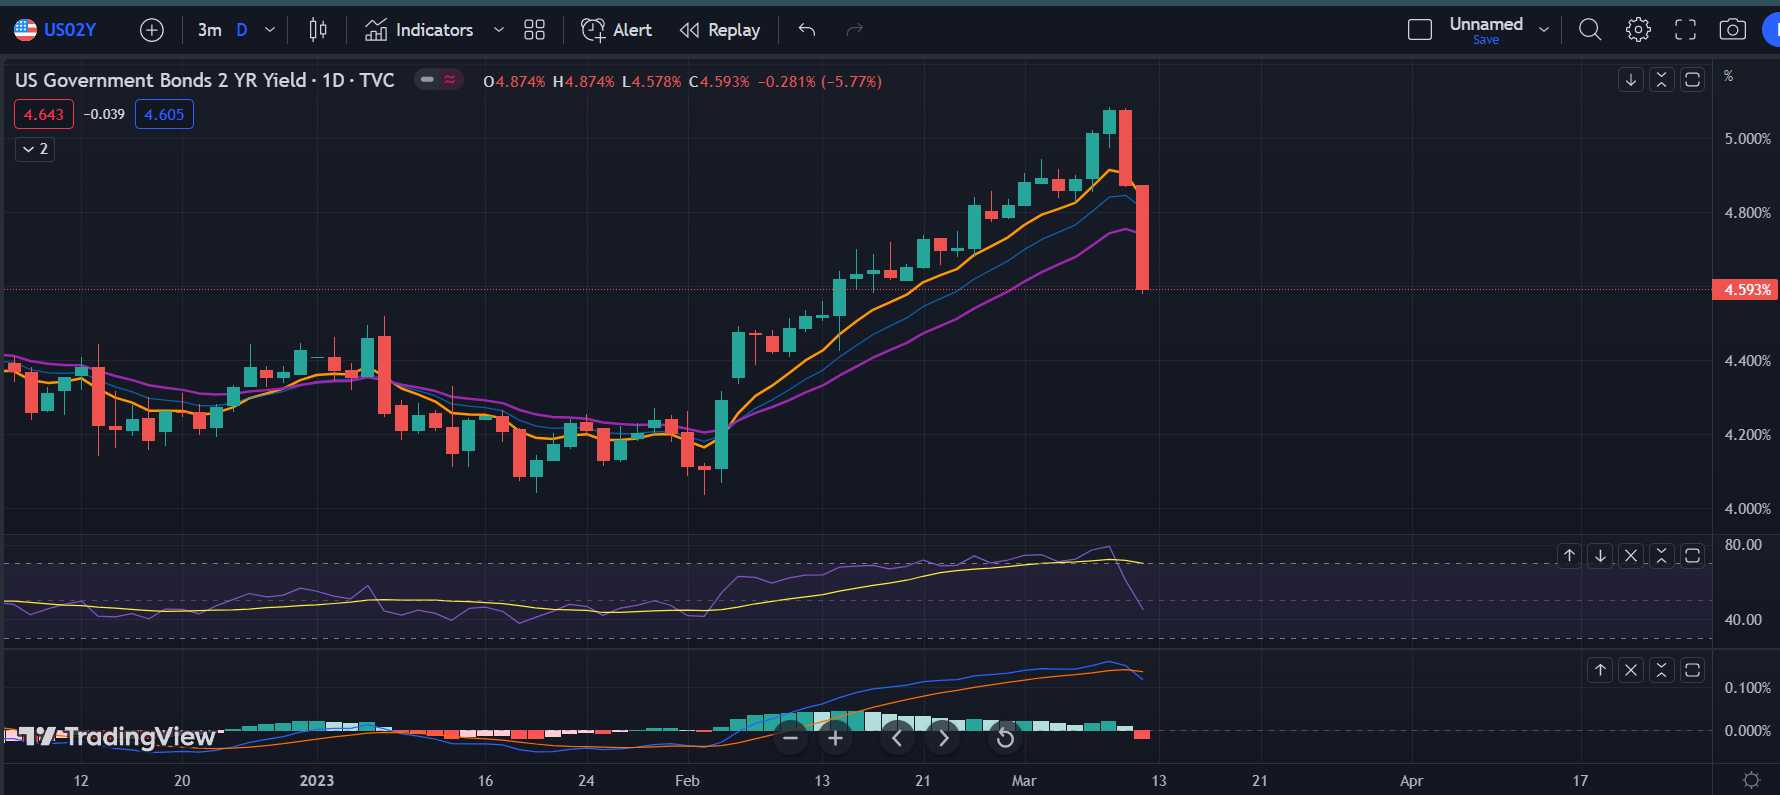
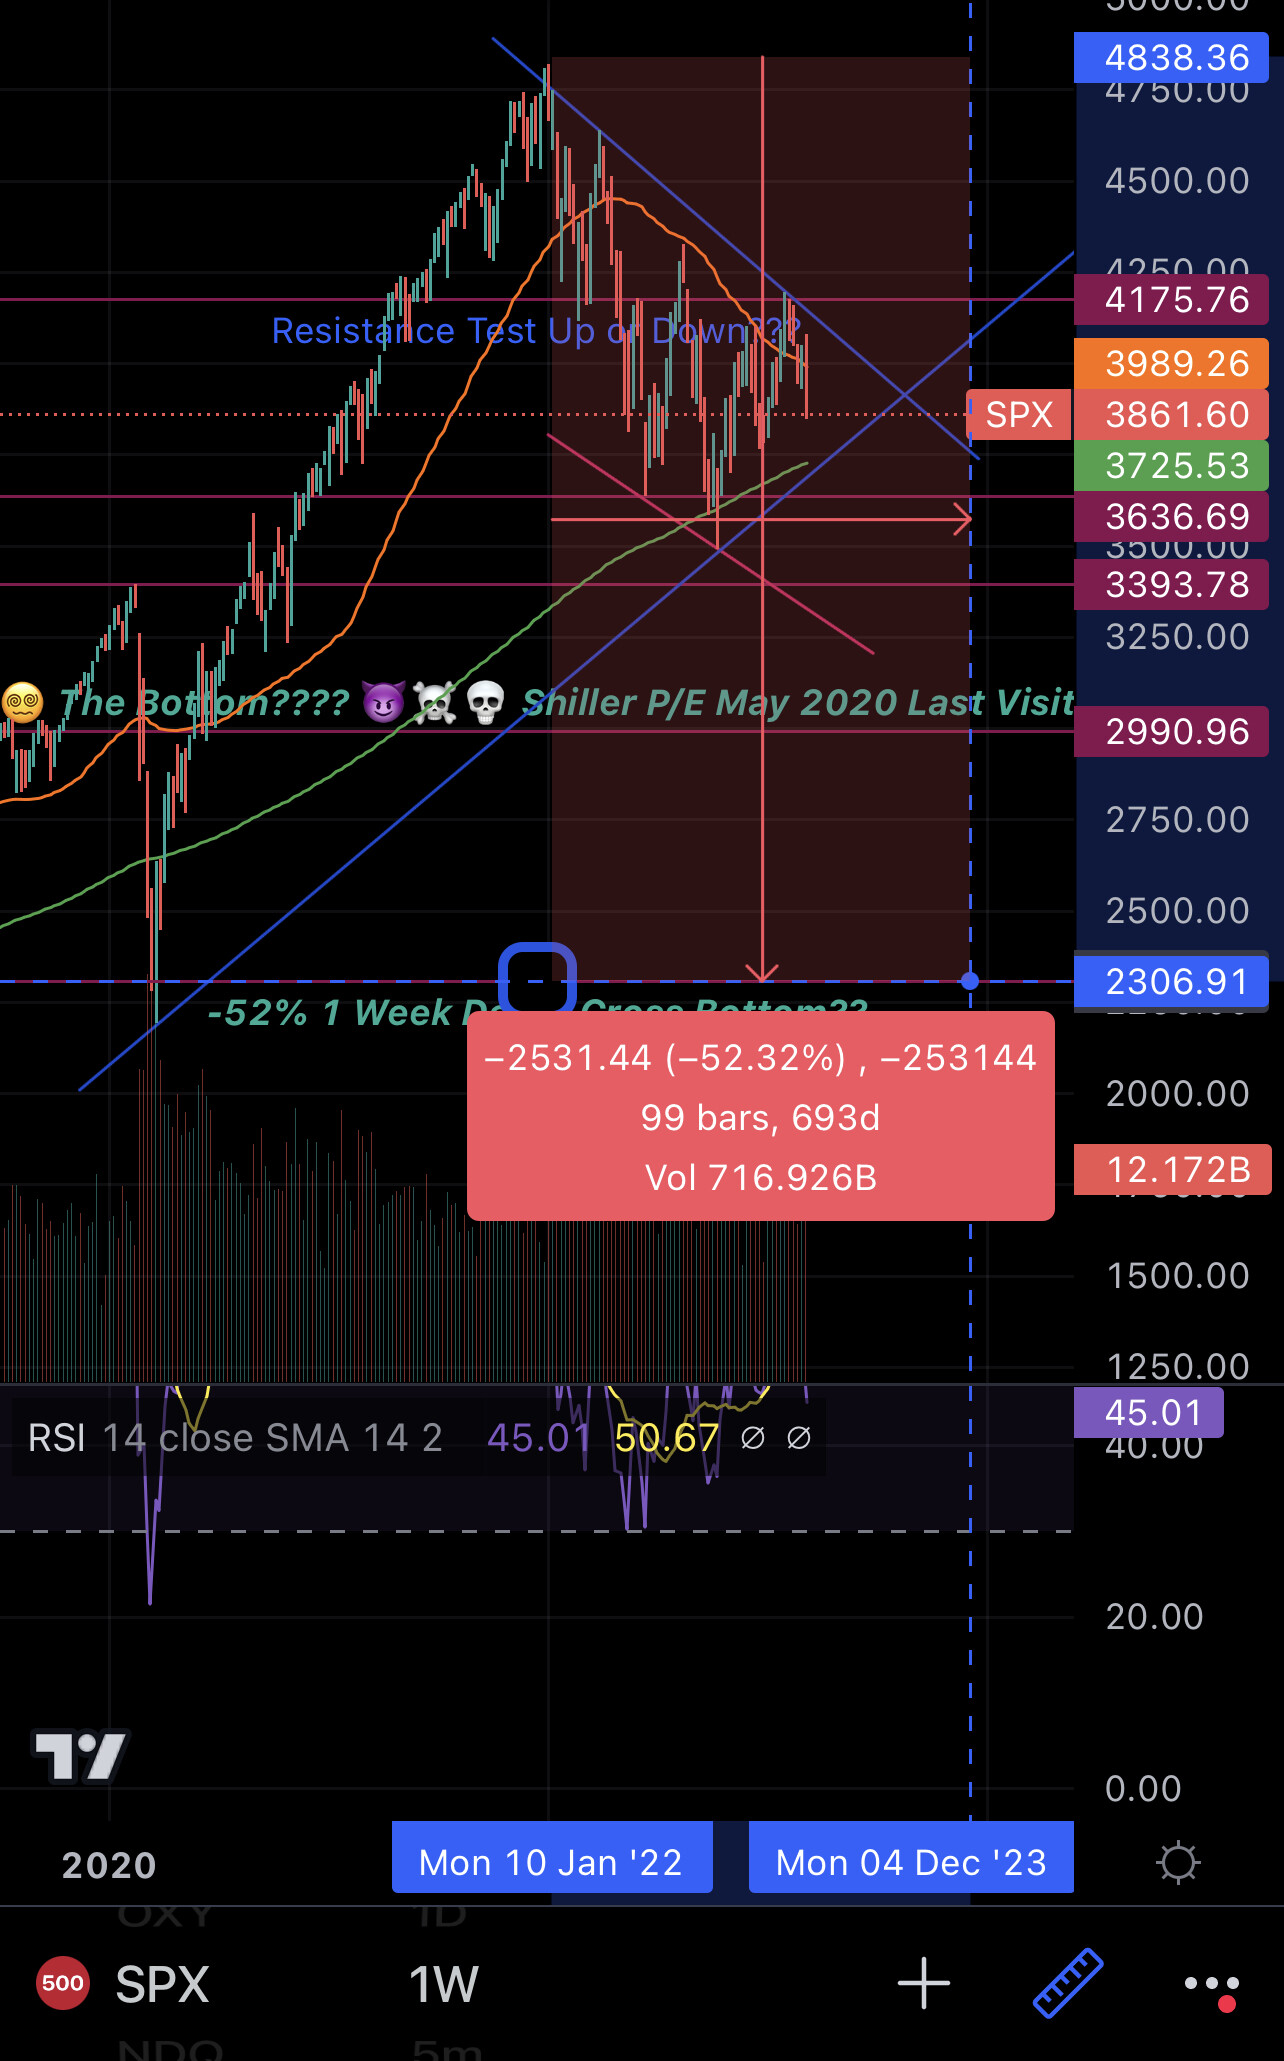
The yields seem like they’re heading upwards with strong momentum and doesn’t seem to be stopping soon. These red candles just seem like a random red candle in the strong uptrend. This will put lots of pressure on stocks and we’ll probably continue to head lower and no rallies will happen (at least big mulitple day rallies).

Another reason why I think that we’ll head lower on SPX without a rally is because the junk bonds are just dying now. They gapped down and seems like not slowing down to the downside. One thing to notice though, is that we are forming a higher low compared to us forming a lower low on SPX. Maybe this signals that we’re going to actually have a rally on SPX? Who knows.

Overall, I think the signs of a rally are basically gone and disappearing. I’m looking for a continued move to the downside because of no bullish momentum and increasing selling volume, combined with the very bearish monthly chart. Good luck all.

3 Likes

Tl;dr SPX 4000 will likely be a magnet into middle of next week. After quarterly opex (3/17), market unpins, allowing it to move lower on a 50bps hike and/or hotter CPI/PPI. Flush/crash is unlikely though given 50bps is mostly priced in and VIX is low-ish. 0DTEs may upend things if they take market into deep negative gamma territory.

SPX continues to be all kinds of undecided. Despite some heavy data coming in. (Image 1 below preserves the lines from the previous post from 10 days ago to make this point.) Markets still dancing around that wedge, and around the 50SMA level.

We are deep in the March opex weather system, which means all those call and put walls mean something again. (Image 2) The SPX 4000 level will likely continue to function as a magnet, even more so than Jan or Feb because of the massive quarterly OI amounts. So barring significant marco news, we can expect markets to move back to this level for the next week.

The fun starts in the second half of next week. CPI comes out on Tue (3/14) and PPI comes out on Wed (3/15). Should give additional clarity on whether we get 25bps or 50bps the next Wed (3/22) during FOMC (Image 3). Note that FOMC is happening right after quarterly opex, when the market unpins. I.e. there will not be any gamma levels or call/put walls providing support. The market should move freely.

This sets us up for a drop if JPow does 50bps and/or CPI/PPI come in hot. Also because a bit of realignment of the equity, bond and currency markets is long overdue. And by most all metrics, the equity market is the one that is out of sync.

It is unlikely to be a flush/crash though as the probability for 50bps is already 80% and market is pricing that in. VIX is still sub-20, so hedging requirements are contained. And we are not in negative gamma territory so MMs are not going to make things worse.

0DTEs continue to be the potential dark horse though - if there is enough of a negative delta move, it could cause markets to fall quite a bit below the level where gamma switches from positive to negative, causing a downward cascade. (We are just at the vol trigger where that happens.) Then we are in a different regime, and will have to update this assessment significantly.

8 Likes

Thanks, SIVB. Couldn’t give us a day on the pin. The selloff put us in deep negative gamma territory, with vol trigger at SPX 4000. If we do not make it back to the 4000 level today, we might get stuck in a pretty negative feedback loop. And if we go below 3900, it could get pretty rough. But the 4000 magnet is still strong, and only getting stronger as we inch into opex. My bet, for what it’s worth, is that we retrace back to 4000.

Something else that can be a tailwind is bond yields falling. Probably in response to banks tumbling, rates have taken a step back, and 50bps has ~50% chance now, versus almost 80% at one point two days ago. Perhaps reflecting the fact that JPow values systemic stability, and things are clearly breaking because of interest rates. Terminal rate has also fallen back to 550bps bs 575bps from 2 days ago.

This is all to say that bonds will be more supportive now than two days ago, though both equity and bond markets are identifying as headless chicken at this point.

image

All this makes FOMC more interesting. If there was a 80%+ probability one way, then markets will not move much. However if 25bps vs 50bps is 50/50, then one of those will go to 100% and markets will snap in one direction or other. And perhaps get us out of the channel we are stuck in.

9 Likes

TLDR: I am expecting a bit more downside before we go back up.

So on the hourly, we do have a bullish divergence on the RSI, but no divergence on the MACD. This makes me think that we’re not going to have a significant rally up and we’re going to see some more downside for the bullish divergences to form. Before people say we can’t go lower, remember that in 2022 when we had these strong selloffs, we had 2-3 days where RSI was in the oversold territory and we went down another $5-10 on SPY. I am expecting a bit more downside before we get a big rally up.

On the daily, we confirmed a new trend. We made a lower high and a lower low. We’re nearing some gap fill levels. So maybe we might be heading towards those gap fills before we rally. But the daily is confirming a bear trend with RSI below 50 and MACD under 0 with no bullish divergence. The volume was extremely high this close too, showing a confirmation of this downtrend. Also since the options pin might be removed, (idk NI knows more) there might be no magnet to pull us higher and we continue to selloff with the bank fears and retail getting scared.

On the weekly, we have an engulfing red candle, showing that most likely we’ll have another red week. The MACD is looking to roll back to below 0 and RSI below 50. Bearish signs and with the increasing volume, I am looking for another red week.

The VIX is surging now, showing that we’re probably going to see more volatile days. But VIX did spike up over 10% so Monday could still be a green day.

Yields got shit on prob because of bank stuff so we’ll see how this affects this markets.

Another thing I’m looking at is that the probability of 50bp rate hike went down. Maybe this gives markets a bit more room to run up? Who knows, but I think fear and panic is starting to come in markets and we’re going to see more downside.

Overall, I am expecting more downside before a significant rally, but even then I’m expecting a red week and I’m expecting all rallies to be sold off.

5 Likes

With how oversold we got, there is good chance of a strong temporary bear market rally up on any of the following:

  • news of a big bank buying out SVB, including any news/hints of similar solutions for other regional banks
  • cool CPI/PPI. Biden hinted this during his speech last week.

Jobs data on Friday was a mixed bag. Here’s my take, posted that morning:
image

So we look to inflation data this week for gauging rate hikes.

I feel like the market sentiment is almost like it’s anticipating a 2008 moment but as noted in the Think Tank thread, that outcome is not likely.

I’m in full cash and waiting for direction whether that be long or short.

5 Likes


??? -52% ??? TBD Days to Bottom


-58% 518 Days to Bottom


-50% 931 Days to Bottom


-49% 623 Days to Bottom


-86% 1050 Days to Bottom

So I wanted to come get you guys perspective on this. I’ve been trying to play with momentum for the past couple months since the market keeps forgetting to take its Bipolar medication. I have been wanting to play at a larger longer scale though, cause life. The images above have the 50 and 200 MA on the 1 w scale. At our current day it is trending in what looks to appear, to a future death cross. I know technicals aren’t 100% but because of all the factors like the Feds Hikes and their supposed delayed side effects I’m sucking the hopium for a completion of the death cross. After zooming out back into history there aren’t many death crosses on the 1 week scale throughout time. The images show the death crosses and their respective moves down. In recent times, the death crosses have come and brought bottoms of around the 50% mark. The 52% I pulled (guesstimate crystal ball) is just a average of all three most recent death cross and bottoms on the 1 week. While I’m Nostradamusing here, we are currently around 427 days into the current Bear Dip and by doing an average of the three most recent Death Crosses maybe we hit bottom (in the case of a death cross arising this year) around the 690 day mark? That would be around December of this year. All right what you guys think? If anything does this look like a potential Death Cross candidate or should I stop sucking on the hopium and sell my UVXY Calls?

To the Floor!!!

3 Likes

TLDR: Really depends on CPI tomorrow, but unless it comes in hot again, I think we’re probably going to rally soon.

On the hourly, we did have a bullish divergence on the RSI, but none on the MACD. Maybe we go lower tomorrow and then form the bullish divergence to rally or start rallying right now given the strong bullish pressure midday. We just tapped the gap fill area so if we do go down to form a bullish divergence, maybe we go fill the gap and then bounce from there.

On the daily, we had some big volume again, showing bullish pressure in my opinion. We recovered from a huge gap down overnight and closed barely red. We are still in a downtrend, but bulls are starting to show up, so I expect a rally coming soon. Another thing that makes me say that is because crypto was pumping and NASDAQ ended green. Showing some bullish pressure.

The VIX had a huge upwick day again. This makes me think that we’re not going to have a waterfall selling immediately. But VIX is surging which is not good to see for bulls.

One thing that I’m surprised about is how big the yields are dropping. This probably signals that markets think that the Fed won’t raise rates much higher or give the 50bp. This should be theoretically bullish, but given the bank situation, who knows.

The junk bonds are still going down even though the yields are tanking. Because junk bonds aren’t going up or holding the lows, it makes me think that we’re probably gonna go lower to form a bullish divergence before a rally.

Overall, I think there’s a good chance we go lower, maybe because CPI comes in hot or something. But if CPI comes in cool, we’re probably gonna pump or have a range day. Good luck to all.

5 Likes

TLDR: It looks like we’re in a bear flag and given that VIX went down 10% in a day, there’s an 85% chance that we have a downday in 2 trading days. Given this, I think that there’s a good chance that we break down from here and form a new low with a bullish divergence heading into the Fed meeting next Wednesday. Or I’m guessing way too far ahead into the future, who knows.

So on the hourly, we had a rangey day imo. RSI and MACD seems to be showing some bullish strength, but not enough for me to think that we’re going to keep rallying tits up. We’re in a bear flag right now from what I see and there’s a good chance that we rally up to the highs again and then break down from here. Given the PPI data tomorrow, we could pop with that and then selloff or something idk. But, it does look controlled bullish so far with some bearishness.

On the daily, the MACD and RSI are starting to turn up, but nothing too major here. It still just looks like we’re about to set up another lower high to dump. But we did have solid volume today showing bulls and buyers, esp end of day. The candlesticks are showing bull strength, but not enough strength intraday for me to say that we’re going to keep rallying higher.

So VIX went down 10% in a day. Means that there’s a 85% chance that we’re going to have a red day in 2 trading sessions. Given the bear flag and the intraday slowness and not much bullishness, I think this will play out. But given that the VIX did go down heavy, I am still expecting some more upside on SPY before we break down from the bear flag. This is given that the PPI data doesn’t completely shit the markets.

Overall, I am expecting a bit more push before we breakdown from the bear flag and head lower. But, anything can happen so I’ll just play whatever pops up on my charts. If we do rally higher, I am looking at 395-397 on SPY to top - this will prob be around 3960 - 3980 on SPX. Anyways, hopefully the next few trading days won’t be so slow and boring to play. Good luck all.

4 Likes

TLDR: Maybe a backtest of the bear flag and then more selling, idk. But there is a lot of dip buying EOD recently so maybe we just keep rallying up, idk. Markets are doing some weird shit.

So on the hourly, we filled the gap from a day ago and now on pace to fill the gap from today. I think there is a good chance that we do fill the gap from today given the buy volume coming in and how filling the gap will mean that we’re going to be backtesting the bear flag for a confirmation of the breakdown. We’ll see what happens though. The RSI and MACD aren’t in bullish territories so it makes sense in my small brain that this rally is just a backtest for a bigger move down.

On the daily, even though we did have an overall red day (confirmed the VIX dropping by 10% yesterday), we had a solid bullish close. Another rally up to form a hammer candle with increasing volume. I think that this is a good sign for bulls that there are buyers at the 384 level, although bears seem to be in charge, not letting bulls gain too much momentum. Interesting to see if we’ll just range trade until FOMC or if we’ll derisk going into it.

VIX got another big top wick today and ended the day with a positive 10%. Means that we’re going to have a green day within 2 trading sessions. VIX is all over the place so I won’t really say anything, but it does seem like it’s looking to explode upwards.

Yields are down heavy again. Markets are thinking that the fed won’t raise rates this meeting and it’s shown on the fed rates watch thing. There’s a 50/50 chance of a no hike and a 25bp hike. I think this points to some upwards bullish pressure in the short term.

The junk bonds had a solid green bar today, even though it was red for the day. Given that the junk bonds are finally looking to rally, I think there’s a good chance that the markets are finding their bottom and setting up a higher low or a rally up. But who knows since junk bonds are still heading lower.

Overall, I think there are lots of signs pointing to some rally or green days to end the week, but the overall big picture is that we’re in a downtrend. The bear flag pattern may breakout or bulls may finally break free and let us have a solid trend up day. Given the markets pricing in a pause, VIX showing a good chance we’ll get a green day soon and buyer volume stepping in, I’ll bet on green end to this week, but who knows, maybe news shits the markets again overnight. Good luck all.

7 Likes

I’ve refrained from market commentary even though we are almost at the eve of opex because all the bank-related gyrations have made the rather strong quarterly expiration rather irrelevant leading into opex.

Fwiw, it is likely still providing support around the 3850-4000 levels, even though we are in negative gamma territory (<3950), which means MMs exacerbate movement. After opex, this support goes away, but we will very likely remain in negative gamma territory. This suggests the whiplash will be even greater after opex, if market uncertainty continues.

The FOMC meeting next week is now even more important. Below, we can see bonds have done a Crazy Ivan and now expect a cut in … July! And a terminal rate of 500 bps vs 575 2 weeks ago.

image

This is from 6 days ago, for comparison:

Through this expression of rates, bond markets are basically saying financial stability will trump inflation concerns. I feel this is unlikely for a few reasons:

  • Rates are high enough to force impairments of long-dated holdings of treasury, MBS etc. already - slowly reducing rates over the next 6 months is not going to significantly change the reality now.
  • Inflation is showing signs of re-accelerating. If the Fed takes its pressure off, it’ll undo all the work done so far, and then some.
  • There are other ways to address the banking mini-crisis, including by guaranteeing all deposits to prevent runs, and just letting the FDIC do its thing.
  • Part of the challenge is asset-liability duration mismatch, but part of it is also deposit withdrawal. The bleed-out of deposits will continue as long as banks pay only 0.5% on deposits (and yet earn 4.5% from RR) while money market funds offer 5%. Unless interest rates are slashed, this reality will not change.

That last point is important because if he Fed guides toward continuing to increase rates, or even not cutting it anytime soon, it will mean the exodus of money from regional banks to nationals will continue. Unclear how long it will spook SPY, but it will likely continue to pressure KRE and IAT.

9 Likes

Just wanted to throw a quick update on the 50/200 and 5/15 MA on the 1 week. 50/200 still marching towards each other and a possible but rare death cross. The 5/15 are looking to maybe throw a death cross this week. The 5 is the Pink, 15 is Purple. 50 is Orange, 200 is Green. Let’s see what Papa JPOW brings us :pepepray:

2 Likes

Quick update the Death Cross hit today on the 1 Week, let’s see if it holds as there is a lot of news/events for this week.

The 5/15 curling bullish but up against the 200 and 15 MA to the upside. Papa JPOW will show us the way???

4 Likes

TLDR: We’ve most likely picked the direction to go to and I expect red days ahead. Powell said no rate cuts any time soon so markets don’t like that.

On the hourly chart, we just busted through every support that we had. I wouldn’t be surprised if we had some kind of rally to retest some support levels, but we could easily just keep bleeding tomorrow given that the markets were running off of rate cuts soon. MACD and RSI rolled over, we filled the gap and looking like we’re breaking the uptrend.

On the daily, we had increasing volume on the huge candle downwards. Maybe we go back to test the March lows soon and this was just a lower high before we set up a lower low. So far, it seems like we’re making lower highs and lower lows.

VIX has been wilding recently and I honestly don’t see it making a huge uptrend just yet. I think it’ll just dick around this range bc of the 0DTE options and until some other financial bank disaster drops, I think VIX will dick around. But it’s looking like it’ll stay elevated here.

Something interesting to see is that bonds weren’t too down. Junk bonds were actually up today, although we had a huge upwick. Bc the terminal rate wasn’t higher, maybe it let the bonds rally a bit more. Maybe a good sign that markets won’t shit to the death, but we’ll see.

Overall, I think that we have a clear sign the direction that we’re going to go for the next upcoming days. We’ll see how the markets react tomorrow tho.

5 Likes

TLDR: Dunno what we’ll do honestly. It sems like we’re mostly stuck in a range, unable to break 390 or the 397-400 area. We’ll see if we continue to range or breakout to the downside or upside.

On the hourly, it seems like we made a major lower high on March 22 and we’re making lower highs and lower lows to head down lower, but we’ll see if we actually do start to make a lower low now. The MACD is showing bearish momentum with us below the 0 level and the RSI barely above 50. Honestly just seems like a mixed bag of signals and we’re ranging.

On the daily, we had another bounce off of the 390/3910 level. The RSI and MACD still show bearish momentum and weakness so we’ll see if we continue to sell off soon.

On the weekly, we have two upwick candles, showing sellers are here not letting the markets push up higher. We did have an overall green week, but the volume did fall off, not supporting this move. Interesting to see and I’m honestly surprised we haven’t seen follow through candles after 2 weeks ago. But the MACD is looking like it’s losing all bullish momentum and the RSI is back to the 50 level and maybe looking for another rejection.

The VIX looks like a barcode. Idk what’s going on but ig our new volatility level is gonna be the in the low 20’s for a bit. 0DTE fun

I haven’t seen much other warning signs other than JNK going lower on Friday while stocks went up. Maybe shows that we’re going to head down lower soon rather than up?

I think that with everything combined, I would continue to expect huge swings daily and possibly range trade for a while until the markets decide what direction to move. I’m expecting more downside, but anyhting can happen so who the fuck knows at this point. Just be careful and play whatever the trend is for the day

9 Likes

Tl;dr Much divergence between markets and Fed. Given time window till next data points (CPI and FOMC), could see upward move for the next 2-3 weeks unless banks blow up more.

Still on the road, and macro still overtaking flows, so have not been commenting on markets much. Did want to note two significant divergences between what the Fed is saying, and what seems to be happening, though.

First, the Fed committee is projecting a 0.4% GDP growth for the year, but GDP Now is projecting Q1 GDP of 3.2%. One explanation for the gulf is one or both are wrong to some extent or other (allowing for annual vs Q1). The other is that there will be negative GDP growth in all or most of Q2, Q3 and Q4. If the Fed turns out to be wrong, and GDP continues at a steady clip, we can expect more rate hikes.

image

Second, as we’d discussed in TF, the Fed does not expect any rate cuts this year. Yet bonds are almost certain that we’ll start cutting in July and be sub 4% by year end.

To state the obvious, if reality turns out how markets are pricing it, it’ll be bullish; otherwise there’s a bit of pain ahead. The next Fed meeting is not till early May. The next CPI print mid-April will therefore be very important.

Fwiw, and bold as it might be to say this, but markets might be disappointed. The ongoing banking crisis shows that the Fed is resolved to keep fighting inflation through rate cuts, even as it opens up its balance sheet to save banks. (It’s not QE btw). Labor markets are still tight, and economy is still growing well. Hard to see how inflation gets tamed decisively without sustained tighterning.

Having said all that… timing is key. CPI is not for 2 more weeks, and FOMC is 5 weeks away. Markets have priced in many cuts, and QQQ is running. So we might enjoy a bit of an upside move over the next 2-3 weeks, unless banks blow up in a bad way. Planning to scale into long term puts if we cross 4100 again.

4 Likes

So the death cross on the 5/15 MA hit and the candle closed with a big wick on the 1 Week. The 9/21 MA looking like possibly trying to turn for a death cross as well and the 50/200 MA creeping a little closer to each other for a possible/rare Big Daddy (1 Week TF) 50/200 Death Cross. Let’s see what this week brings us :pepepray:

1 Like

TLDR: Cup and handle within a cup and handle so we should go bullish and fuck bears (I have never made money off of cup and handles)

So on the hourly, I see a cup and handle with a very small handle, but still a breakout thing. We did get a selloff EOD so we’ll see if this continues and the cup and handle continues to never play out for me. On the RSI, we’re above the 50 level, but looks like we might be going back into the bearish momentum. The MACD is in bullish territory, but it’s very weak, making me think that we don’t have enough bullish momentum to go up higher.

On the daily, I see another cup and handle and it seems like today was a breakout of the candle and we should be heading up from here. The RSI is right at the 50 level though and the MACD is still bearish with very little bullish momentum. This makes sense given that we had very low volume today and no major news to cause a big move. We don’t have many big news until Thursday (employment) and Friday (PCE) so it may be that markets move up because there’s no bad news and because they’re thinking that the Fed will cut rates and we’re pricing that in.

The biggest thing I’m seeing from other parts of the markets is that the bond markets are heading lower. Interesting to see and everytime that bonds have headed lower in 2022, markets followed. So if we continue to see the markets head lower, it’s a warning sign that it’s a bull trap.

Overall, I’m expecting mostly a range day until Thursday and maybe until Friday. No major news and because of that, I’m expecting pretty muted reactions in the markets and maybe slow move up given that there are cup and handles and markets are thinking about them Fed cutting rates. Or we could form a range on the daily idk. Markets can go up, down or to the right. Good luck all.

5 Likes

TLDR: I am bullish but who the fuck knows because this market is stupid low volume right now.

On the hourly chart, we finally have a more developed handle for the cup and handle with a potential breakout coming soon. Maybe this was the downday needed to fuel the bulls to bring us up higher. MACD and RSI are both not in the bearish momentum and very slightly in the bullish momentum so we’ll see if we can keep this up.

On the daily, another stupid low volume day with a doji. We did have a pretty big selloff leading into a big buyup EOD so we’ll see if the momentum continues into tomorrow and have a solid green candle.

VIX was down for the day even with the big red midday so I’m gonna guess that fear is slowly leaving the markets and we’re preparing for a pump.

JNK had a mini green day, but still down overall so we’ll see if bonds continue to tell us that markets should be heading down or not.

Overall, I think signs are pointing to upwards momentum, but we’ll see what happens. I expect low volume days until Friday and probably upwards movement until then.

5 Likes

I gotta go back to the grind mines tomorrow so just wanted to post a quick update on the 1 Week. 5/15 MA Death Cross hit last week (not pictured above). The 9/21 MA yellow/green is curling more towards each other and a potential Death Cross. Normally a Death Cross on the 9/21 results in a decent drop down as pictured above. April is normally a bullish month historically, like 70% more bullish than bearish historically. Will the Bears make this April a cave since they wake up in March??

2 Likes

TLDR: I expect a short squeeze fueled rally for the upcoming days because we broke above the 400 level and the 50 MA on the daily.

On the hourly, we gapped up and never looked back. MACD and RSI are both showing strong bullish momentum. Possibly the cup and handle finally playing out and we’re gonna keep moving up for a while.

On the daily, We have increasing volume and a break above the 50 MA and the pennant. The RSI is in the bullish momentum but the MACD is still bearish. Interesting to see how much more we have, but given that we have a close over 400 and the 50 MA, I’m gonna guess that shorts are gonna start to get squoze out here. Or we retest the 400 level and then rally up.

Another good sign I’m seeing is that the VIX is heading lower, confirming this move up.

Junk bonds also got an increasing green candle today. Although it’s still lower than the previous high, it’s a good sign that it’s heading up and this divergence between SPX and JNK may not last much longer.

Overall, I’m gonna guess a strong uptrend tomorrow unless something retarded happens. Good luck all.

7 Likes