SPX Tech Anal: New Year New Bull Szn (pls)

TLDR: I expect us to make new lows in January.

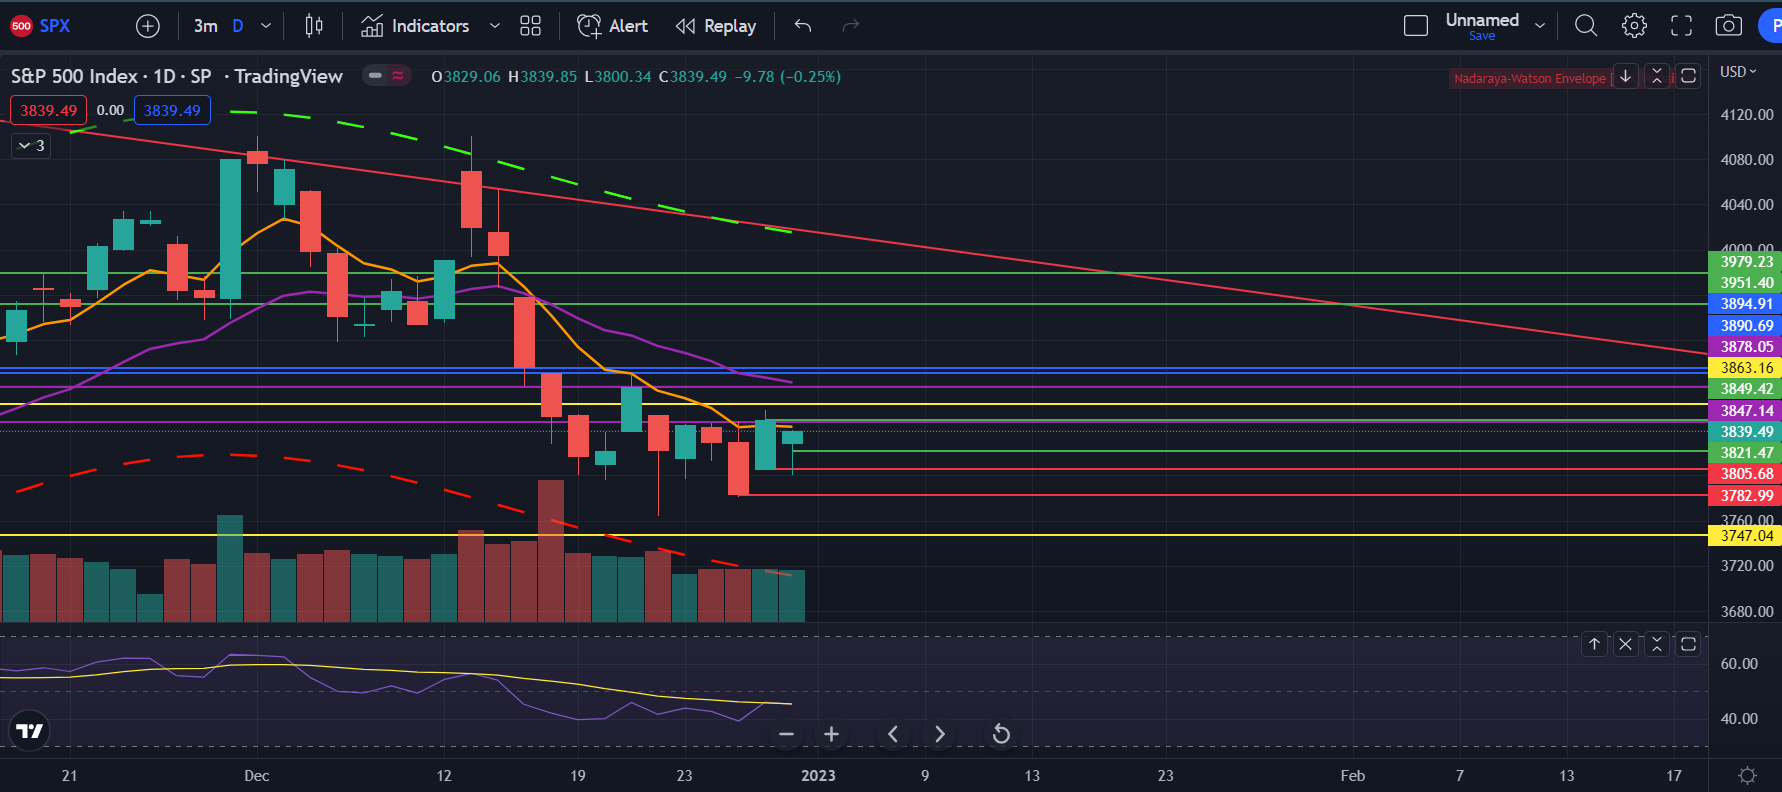
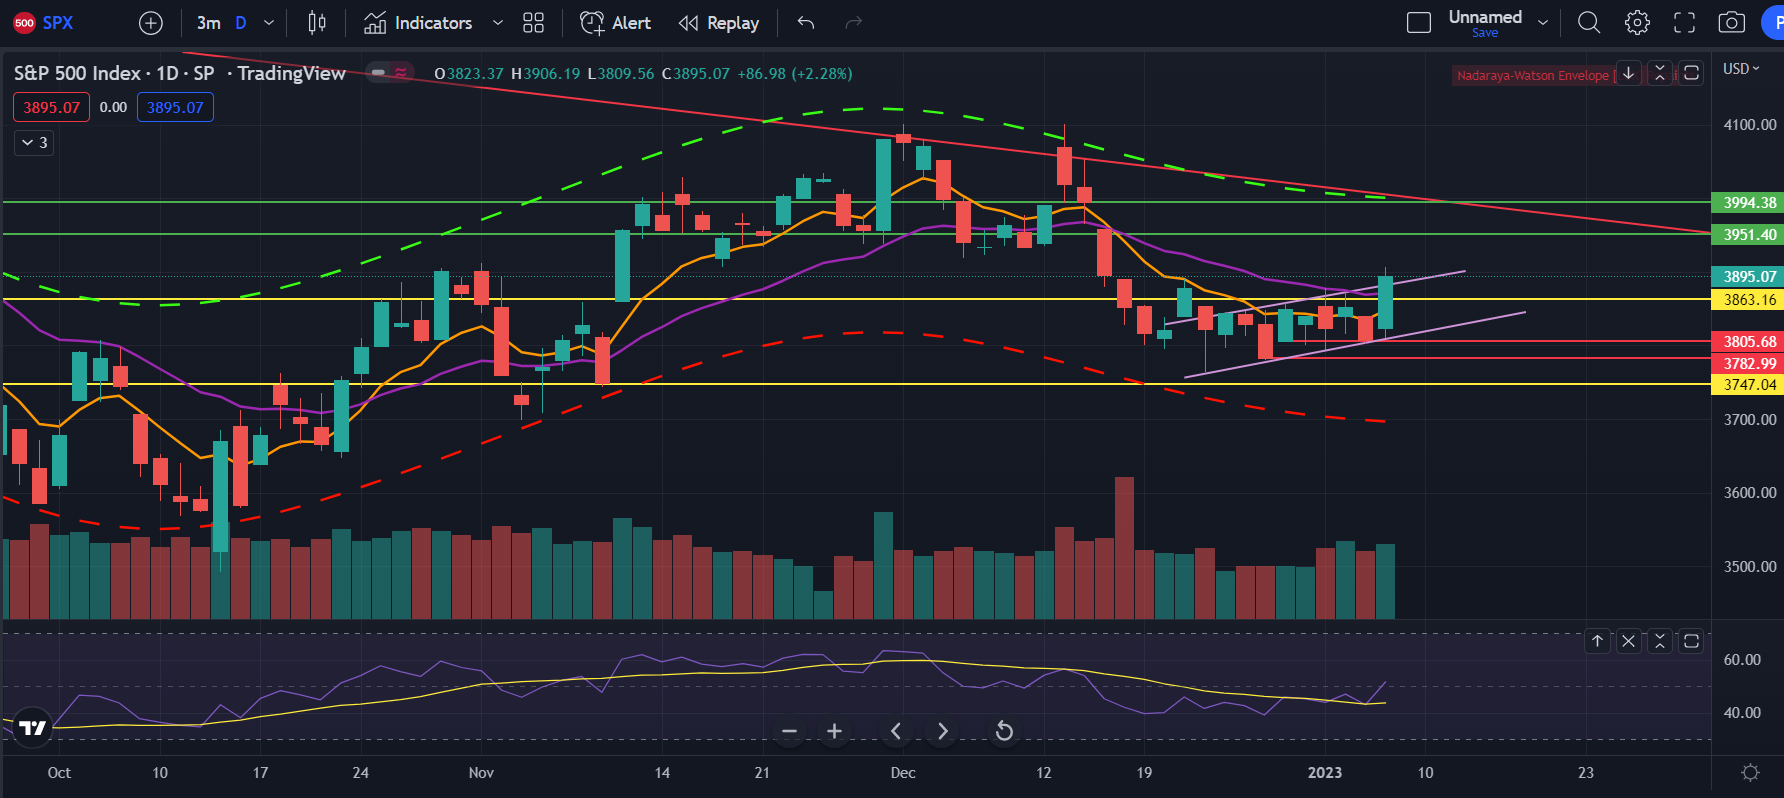
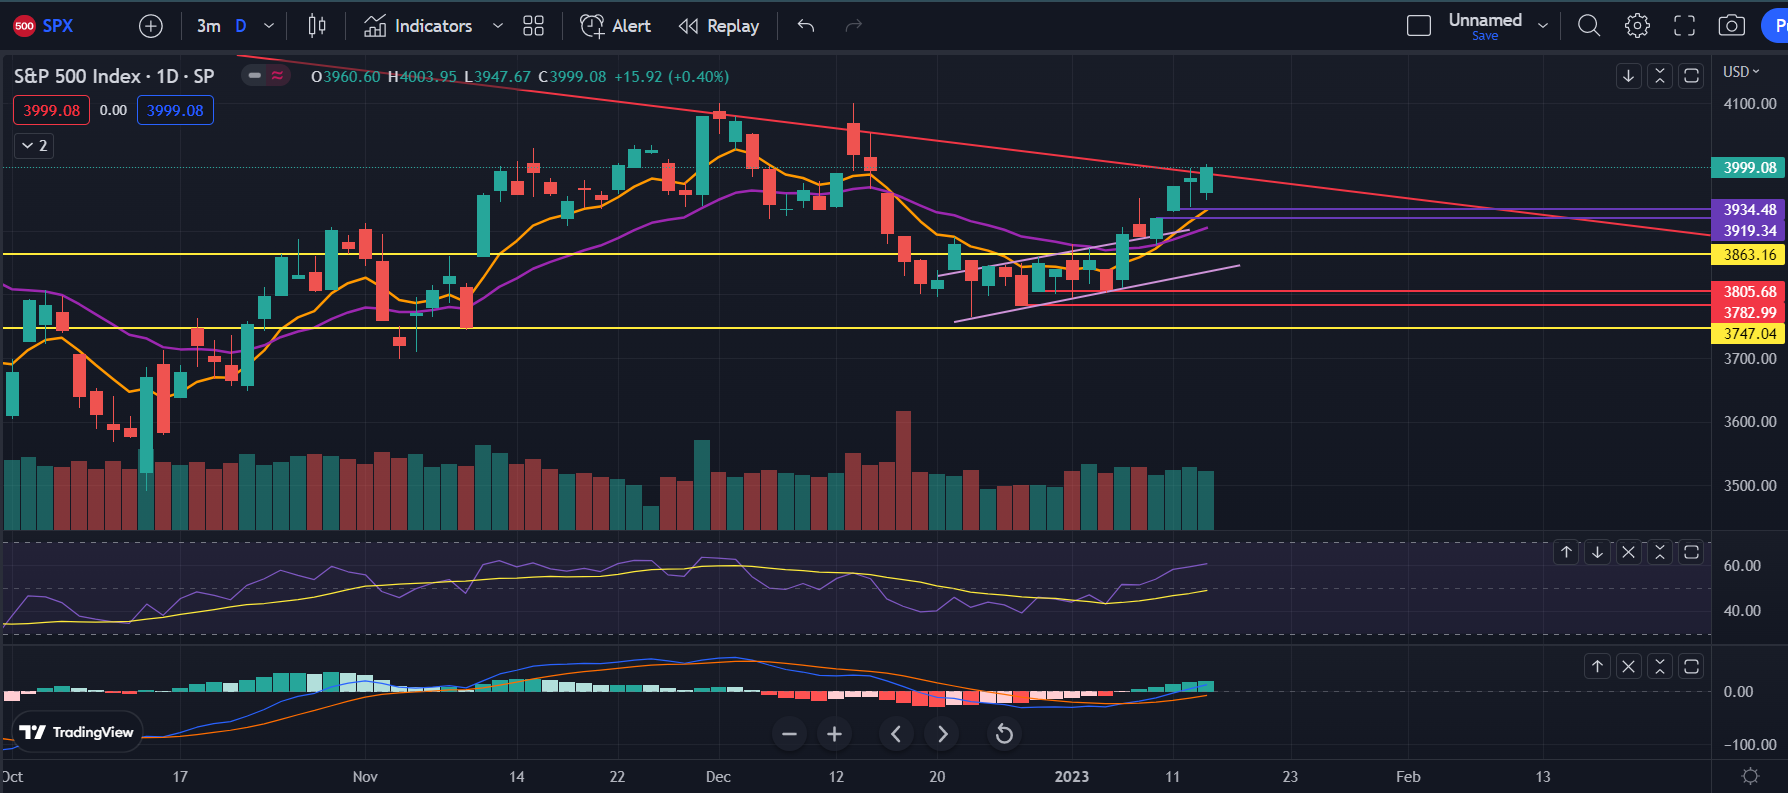
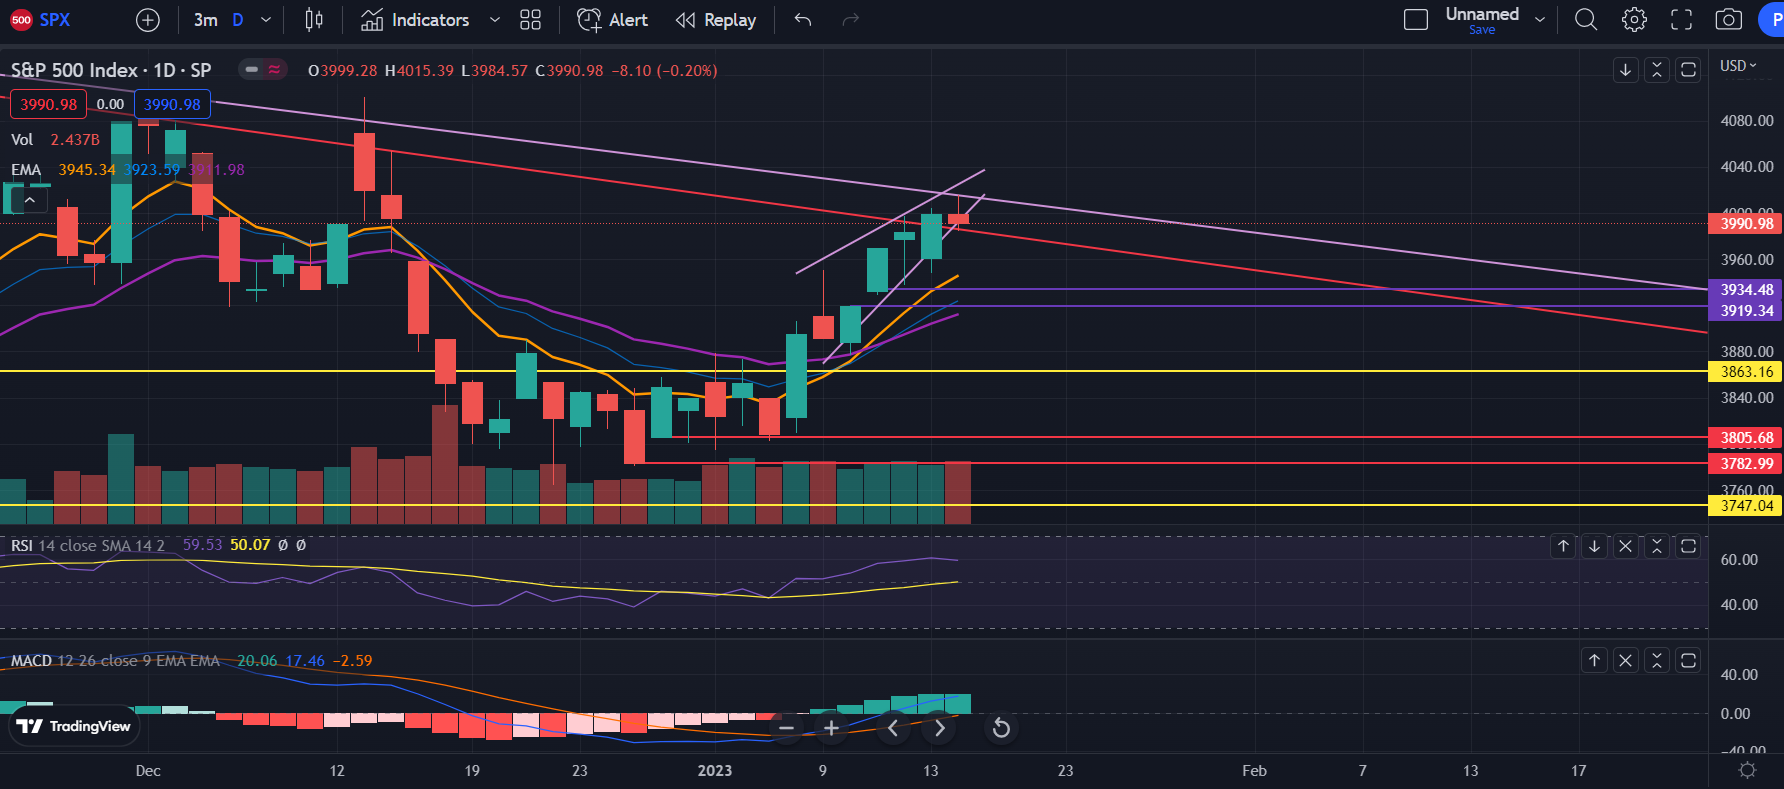
Looking at the daily chart, we are seeing some hard consolidation previously seen before huge moves. Since the holiday season is coming to an end and the options are expiring, we are most likely going to have a move after being unpinned from this level. I expect a rally honestly, looking at the Friday close’s rally and how many bottom wicks we are forming here. Tons of gaps to fill too. I expect us to rally into the FOMC minutes and then shat down, but we’ll see. I’m looking at us going to the blue or upper green gap fills for the lower high. I’m going to go pretty heavy into puts if we do rally.

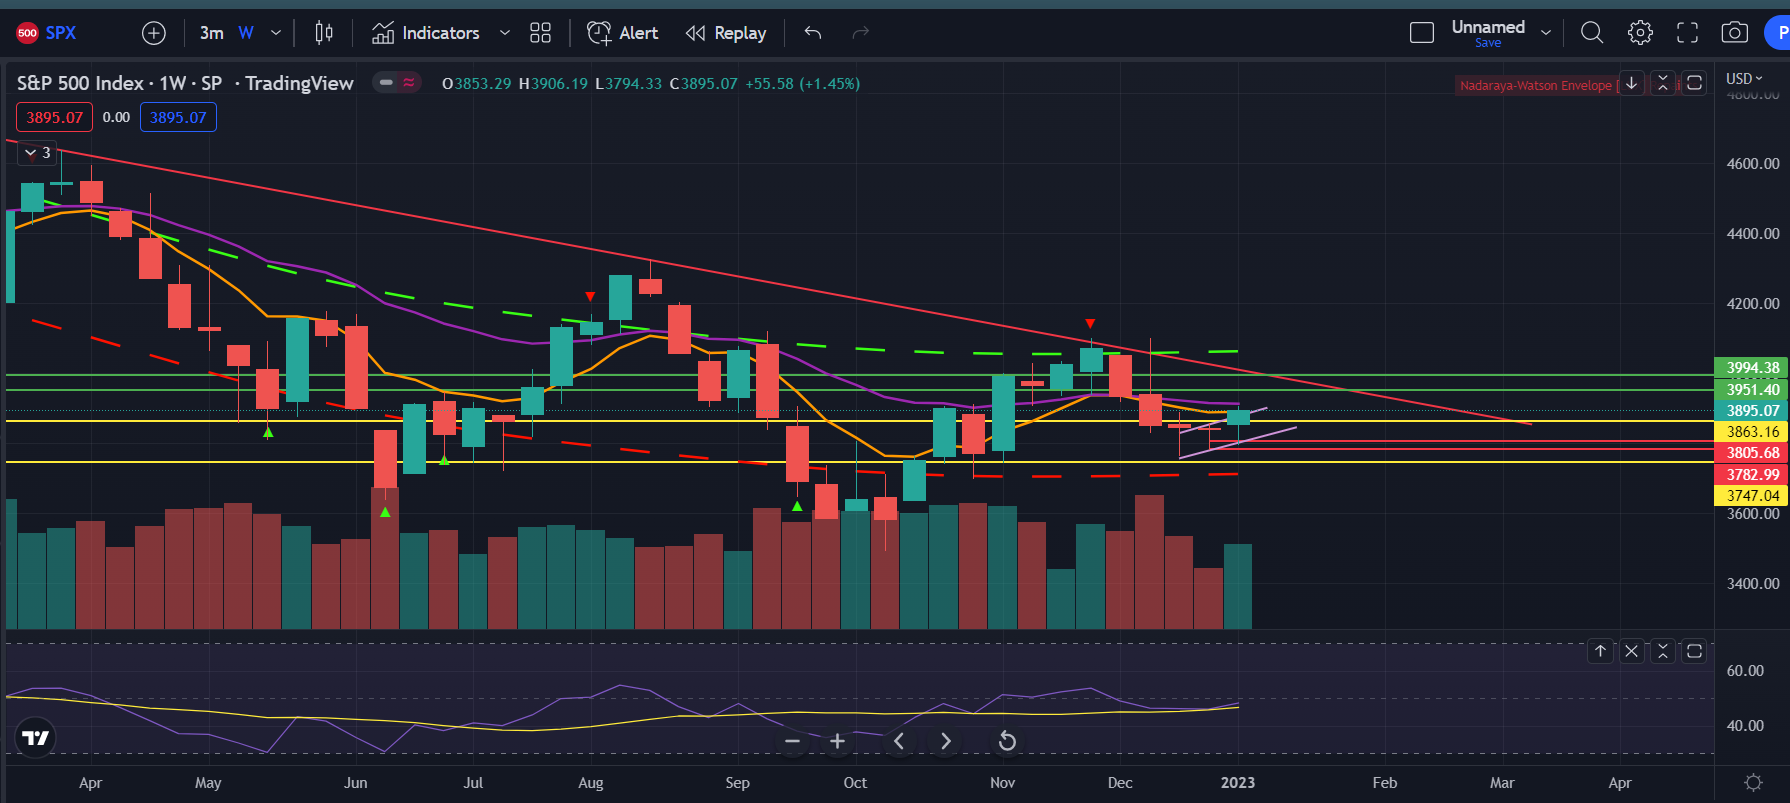
Looking at the weekly chart, I am further seeing signs of a rally. The selling volume has decreased (yes holiday season is a factor, but still something to mention). Also, we have gotten two big bottom wicks on the weekly. Shows that there are buyers here which I expect to continue to step in this week into the FOMC minutes. Maybe we reach up to the 21 EMA on the weekly and then get rejected like we ahve been doing a good amount this bear market. I do expect us to sell off on the FOMC minutes, either right when it comes out or the day after if the market short squeezes the puts and shorts on the minutes release. This is because the last FOMC meeting was hella bearish. I expect the minutes to be bearish with the mentions of continued rate hikes and holding the rates at an elevated level for a while. Whether the market rallies by only looking at the bullish points or tanks realizing that it’s bearish doesn’t really matter to me because I think we’ll make new lows anyways.

Looking at the monthly chart, we see a bearish engulfing. Basically every monthly candle that had a bearish engulfing led to new lows in the next month. I expect this pattern to continue to play out and have us make a new low this month or have a significant drop. Bearish engulfing just means that the monthly candle’s open and close is bigger than the previous candle’s body. Additionally, the monthly RSI seems to be rejecting off the 50 level which is not a good sign to see. Probably means that we have another leg to go down, but we’ll see if we form a bullish divergence or something.

The VIX is dicking around to the right so I won’t mention it, but once it explodes, I expect it to be a hella violent move upwards. I’m personally looking to ease into UVXY calls starting Tuesday close or Wednesday. The dollar is on a slow bleed downwards, but we’ll see if it starts to turn upwards and put pressure on the markets.

Another thing that makes me lean to the bear side for the month ahead are the yields. The 10 year yield has been soaring higher. This will keep putting pressure on the markets and help push the markets down further.

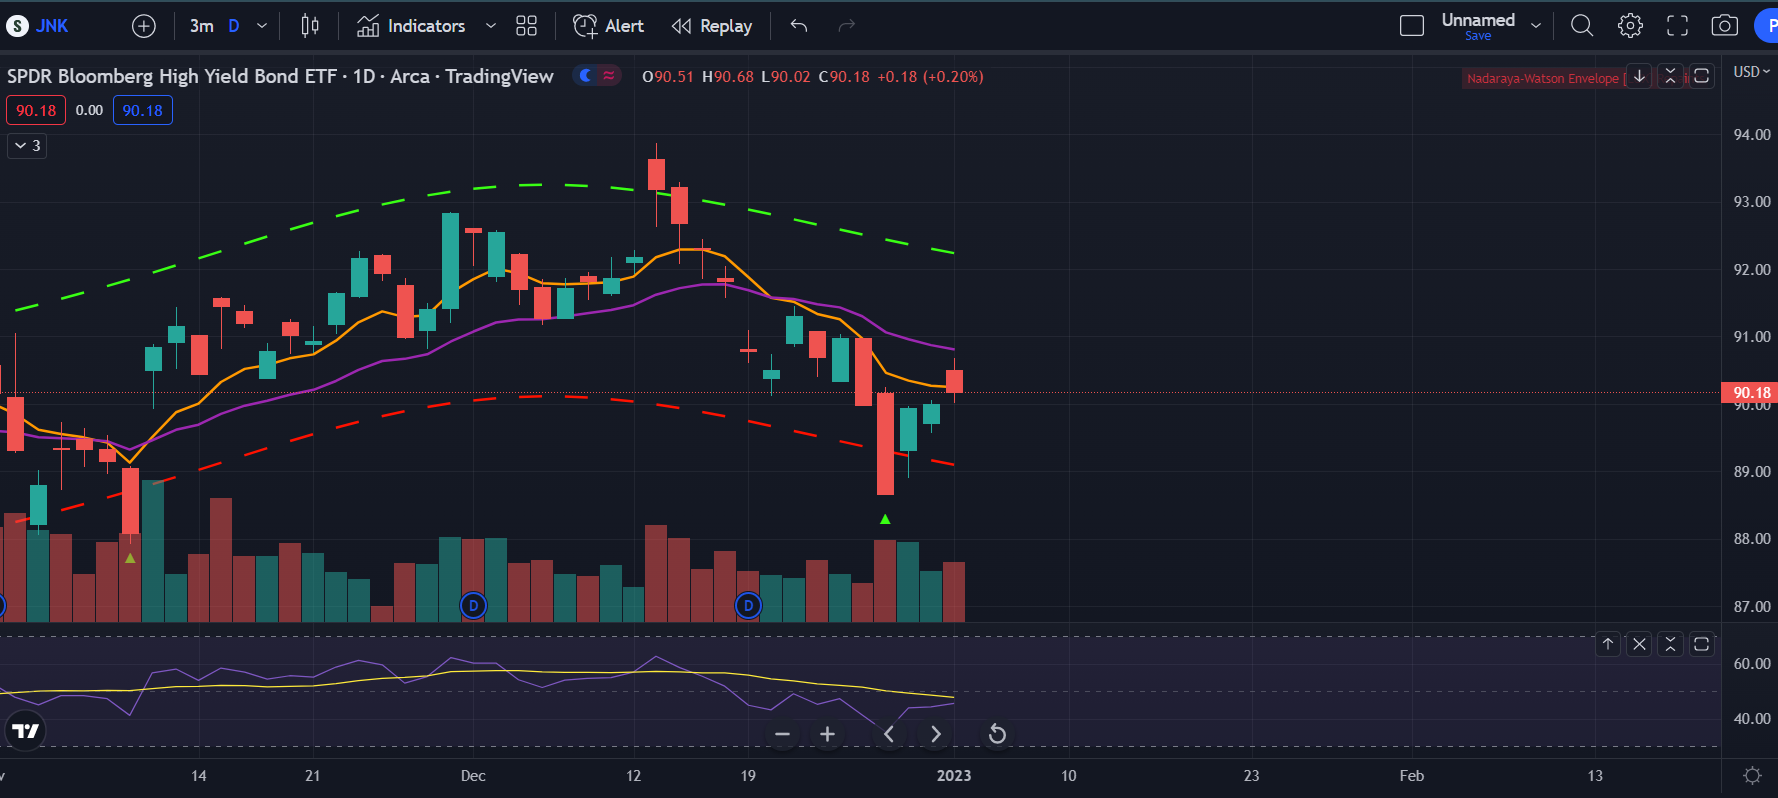
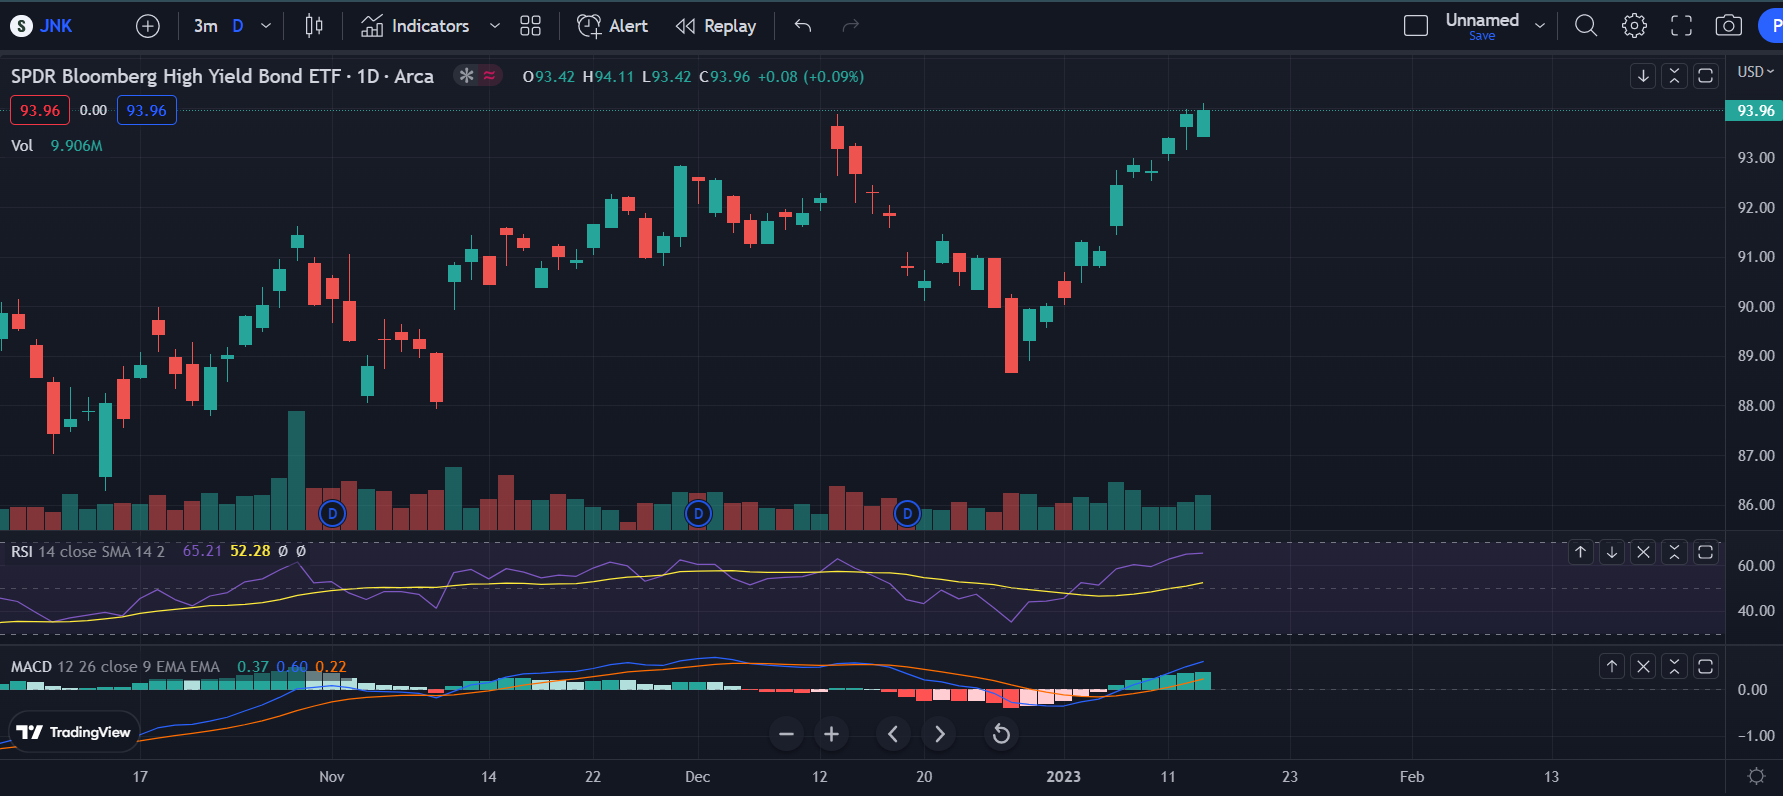
Adding on to the yields moving up, the bond market is getting hit hard right now. I focus on the junk bonds (JNK) or high yield bonds (HYG) since they show the underlying health of the markets since these are the risk on assets. The junk bonds moved down a ton, forming a lower low, which makes me believe that SPX will follow and have us continue to make lower lows too. But, the JNK on the last 2 days has formed some bullish signs with a gap up and then making a new high and closing at that level. I think this signifies that we’ll probably have a rally if these risk on assets are being bought, but we’ll see.

Overall, I expect a rally leading into the FOMC minutes and then have us get completely shat down for the next leg lower. We’ll see if we bottom there and rally upwards to a better 2023, but I think there is a great opportunity for money making upcoming on this leg lower. Whatever plays out, I’m expecting a leg lower and an entry for puts. Happy new year and I hope everyone makes money this year.

3 Likes

TLDR: I think we’ll tank on FOMC minutes tomorrow, but we’ll see what happens.

So based on the hourly chart, I don’t think that we’ll get a rally, which is annoying to see. Maybe we finally fill the gap to the yellow line and then set up a significant lower high before the next huge leg down. The hourly had a false breakout in this range and it just seems like we’re in a bear flag. Filled most of the gaps created within this range though, which is good. Maybe since we bounced off the trendline, we’ll reach the upper trendline before the minutes release and then shit down from there. Overall, not really seeing a good strong momentum up or even buyers stepping in enough to make this bullish.

On the daily chart, we got rejected hard at the 21 EMA. Not a good sign, esp with a big red candle and strong sell volume. Maybe we did see the top of the rally and now onto the next leg lower. We’ll see how the market reacts to the FOMC minutes. Maybe we still rally with the bearish minutes and then bull trap a fuck ton of people.

VIX is new year, same VIX. Nothing is happening other than to the right. We’ll see if the VIX starts to soar into the heavens.

One thing to note is that the junk bonds are not making a lower low or even testing lows. They’re still pretty up there. Interesting to see, and maybe this is giving a hint that we’ll actually rally with the minutes. Just a guess though.

Overall, seems like the markets are looking very weak and want to sell off soon. I still want to wait for a lower high to set up, but it’s looking like I might have to just enter swing puts around here with a small position size. We’ll see what happens with the minutes and whoever plays the minutes drop, I hope you all the luck.

8 Likes

TLDR: There are some signs that we may continue to rally, but we’re still in a range.

So on the hourly, some people are seeing a triangle, but I personally see a bear flag. We rejected very nicely from the bear flag today and currently bouncing off the 21 EMA and the 50 level on the RSI. This does make me think that we’re going to rally to the top of the flag again, but overall, I think that we’ll drop down soon.

On the daily, we had a good volume day, but it was still a relatively flat day. We rejected off the 21 EMA and we’re in the range. Not much else to say other than we’re rejecting off the 21 EMA multiple times and rejecting off the 50 level on the RSI. Doesn’t seem too bullish right now. Maybe we rally to the blue gap fill area, but I don’t know if we’ll go much higher.

The VIX moved down, which is good for markets I guess. Still just dicking around.

The biggest bullish sign I see are the junk bonds. It’s making new highs and typically, junk bonds show the “real direction” the markets want to move. Maybe this shows that markets will continue to rally up. Another good sign for markets is that the 10 year yields are moving lower, easing the pressure on the markets.

Overall, we’re still in a range and breaking above 386 on SPY or 3878 on SPX should lead to a good rally upwards. I’m personally not too bullish that this will happen because we are in a bear flag, but we’ll see what happens. Good luck all and don’t get blown out the first week of 2023

1 Like

We’re in a range still somehow. Look out for job news tomorrow for direction

1 Like

TLDR: Good chance that we retest the bear flag breakout and then head up higher to the gap fill above. Things are looking bullish now, and looking like we’ll rally into the CPI report.

So on the hourly, we broke out of the bear flag and with the hourly top wicks, it does seem like we’re going to pullback a little, which is fine. I just want to see us retest the bear flag uptrendline and then bounce off. Or retest the 3875 level or 386 on SPY and then bounce off.

On the daily, we broke above the 21 EMA and the bear flag, showing bullish strength and going out of this range. The volume increased on this breakout too, showing that this most likely isn’t a fakeout. The RSI is also above the 50 level, very narrowly, but still above, showing that there is a strong bullish momentum. Most likely we’re gonna go test the green gap fill area as that’s the next big area of volume and resistance.

On the weekly chart, we see 3 bottom wicks with strong buy volume on this week. Combined with the bottom wicks and breaking out of the bear flag and testing the 21 EMA. This should theoretically lead to another green week or at least another high next week.

The VIX went down strongly today and looking like it wants to head lower and let the markets run for a bit more. Additionally, the VIX is turning off from the 50 level on the RSI, maybe wanting to form a bullish divergence on it.

Another good bullish signs that I see are the yields getting shat on, esp with the job and ISM PMI numbers coming in lower than expected and showing that the rate hikes are taking effect. These yield drops are good for the markets going up.

The dollar is also falling off, putting less pressure on the markets. Good for bulls based on these.

Finally, the junk bonds are soaring high due to bonds going down and people probably taking more risk. It’s a good sign if the junk bonds are going up with SPY because it validates the SPY movement. Therefore, we should see some more movement upwards on SPX and JNK.

Overall, seems like we’re breaking out of the range and looking to set up a lower high before heading lower. I’m looking at the gap fill area above to take swing puts and prepare for the next leg down. Good luck all

1 Like

TLDR: I’m not as bearish as others are and think that this could just be a retest. I’ll change my mind if JPow somehow shits the markets or if the charts start to turn bearish tomorrow.

So on the hourly chart of SPX, it seems like we were overextended and had a pullback. We reached up to the green gap fill area and got rejected, which made sense as we ran too much and was in an ascending wedge. I did mention about how I was looking for a retest of the bear flag breakout. We’re still above the 21 EMA, didn’t break below the bear flag uptrend line, and the RSI is still above the 50 level. Things are just looking like we’re setting up a higher low before we get a gap fill above. Things can change if we don’t manage to bounce from here, but I’m seeing just a retest of the breakout.

The daily chart shows a bearish candle. A huge upwick inverted hammer. But again, we’re still above the 21 EMA, bear flag and the RSI didn’t really turn off from the 50 level. Volume didn’t pick up enough for this selling to make me lean fully bearish.

The VIX slightly confirmed this move by moving up, but still not enough to really make me think that we’re heading into the next leg lower. Also, I’m going to guess that VIX is going to rise from here because of the CPI report incoming.

The 10 year yields are moving down hard. This should put less pressure on the markets. If we are going to die hard, I would want to see the yields stay elevated or start to move up.

Also looking at the dollar, it moved down hard too. These are not showing confirmation signs that SPX is gonna die.

Now finally, the JNK moved up today. This is forming a divergence with the markets. Because the JNK moved up, I’m going to guess that this is just a retest on SPX and we should continue to move up onwards.

Overall, I am not seeing a full bearish conditions to make me think that we did form the lower high. I’m going to guess that we’re going to either form a double top or fill the gap fill and then have SPX die. Unless the charts tomorrow show everything turning bearish, I still will guess that we are in an uptrend. Good luck all.

5 Likes

TLDR: I’m gonna expect a rally into CPI and then shit hard afterwards. The CPI forecast is showing some strong decrease in inflation expectations MoM, which I think will cause us to miss and have us shit down.

So on the hourly, we can see that we tried to break below the bear flag trendline, but we weren’t able to and rallied off of it. What I’m looking for here now is to either fill the gap (which I don’t think will happen at this point) or for a double top. I expect the double top formation because I don’t really see us having a 2% green day, but anything can happen. The RSI is turning back up from the 50 level, bounced off the bear flag and the 21 EMA and the 8 EMA is back up. All signs are pointing towards a further rally upwards.

Additionally, I think that we are setting up a huge bull trap here. We bounced off of weak volume and combined with the CPI revision where we are expecting negative inflation MoM, I think that we’re seeing some market manipulation to trap as much calls as possible and then shit back down. The daily is showing some good strength, but the biggest thing that I’m looking at is the gap fill above, and if we do gap fill, we are right at the bear market trendline. There are too many resistances here combined with no real change in macro news to make me think that we’re going to actually break this trendline and go into some new bull market right now.

VIX is back near the levels where tops have formed and if the VIX and SPX is green tomorrow, I’m going to expect a CPI dump or CPI gap up and then dump. We’ve seen the market tops near these VIX levels multiple times so I’m going to expect the same and expect the markets to shit down soon.

Another warning sign I’m seeing is that the junk bonds and high yield bonds are not green today. If they have another red day tomorrow, this should be a major warning sign that markets are gonna shit themselves bad.

Overall, I’m expecting a green day to the double top or gap fill tomorrow and then we shit on the CPI news. I think the markets are setting up for a huge bull trap right now and the CPI is bit too optimistic. If I’m wrong, then I’m gay and retarded. Good luck all, I’ll most likely start to enter swing puts starting tomorrow.

5 Likes

I think we see a rug pull soon but we’ll see what the market does with CPI data tomorrow.

Looking at the daily chart on SPX, we did see a little uptick in volume for the buy volume, but still a low volume move up. We’re nearing the gap fill and the downtrend line that we’ve rejected off of this entire bear market. If CPI does come in good and the market opens up very green, I expect a similar thing to the last double top where we fail to stay above and break down. There’s a bearish divergence on the hourly chart on both the RSI and the MACD. There’s also the 200 MA at the gap fill and downtrend line. If that’s not enough resistances, we are also going to be inside the golden pocket near the trendline, which is the 0.786 and 0.618 Fibonacci levels. There are too many resistances just like the previous double top where I expect markets to make a meaningful rally upwards.

The VIX was up today, showing a divergence with SPX and possibly showing that a rug pull is incoming.

Overall, I think everything is setting up to be a rug pull incoming. Smart money is selling into this rally while dumb money is buying into it. This has been the same set up as the last multiple rug pulls into the trendline test. I think markets will soon be heading into an earnings dependent market rather than inflation based market as well. Unless CPI comes in super low and insanely bullish, I’m going to lean on either a gap up and then knife or a gap down and drill. Good luck everyone.

2 Likes

Nice TA Yong, I think tomorrow will be one of the pivotal events for this new year, as we haven’t had much to work with so far. In order to widen our look at the technicals here, I have a snip of my SPX chart.

Notice how the Parabolic SAR with the pink dots has flipped to the underside, indicating that the trend has moved bullish, which is natural given that we broke a lengthy range to the upside. Also, the MACD trendline has reversed, with the red moving back above the green which is another bullish indicator. While both these show a positive trend, I don’t think it will last and even with good data tomorrow (which is probably close to priced in) we may not make it over the bear market lower high trendline. Also notice the CCI at the bottom of my chart, which just today has broken over 100, showing an overbought situation beginning to develop. This indicator rarely goes outside the +/- 150 bound, so I will be looking for shorts if we do get a rally that blows the CCI into serious overbought territory, which I think will line up pretty closely to that bear market resistance. Good luck tomorrow.

4 Likes

TLDR: I think we have a little more upside, but I still think that we’re going to make a huge leg down.

So just starting off with reasons why I think that I expect a rug pull is because the smart money is pulling out heavily into this rally. If you want to see the new bull run or a continued rally, you want to see the smart money putting money into the market, not the opposite way around. The previous times this happened, the massive rug pulls happened.

Now looking at the smart and dumb money chart, the smart money is pulling money out of this market again and the dumb money is piling in. The last times smart money pulled out and the dumb money went in was the December double tops and the August peak. I think that something similar will happen where retail traders get bull trapped and then get blown out like the previous tops. Last week, we had huge surges in put open volume, giving a perfect set up for a short squeeze and blowing out retail. I think that something similar is happening right now where retail is getting their bull hopium hella up and rush into calls, before the rug pull comes in and blows out everyone.

Now looking at the weekly chart, we’re again near the 50 level on the RSI and turning back up on the 0 level on the MACD. Increased volume on the follow through hammer candle and basically right at the downtrend line. This week should show if we’ll actually continue to rally on or get shat on. If we have a solid close over the downtrend line on the weekly chart, we should expect to see lower lows and higher highs coming in.

On the daily chart, we finally had a daily close over the downtrend line. The volume did decrease, but it was still near the same amount volume as the previous days. But on SPY, the volume did fall off hard. The chart is showing some bullish signs. The MACD is trying to turn positive, RSI is looking strong and the 8/21 EMA is crossing over. We are in an ascending wedge right now which leads to breakdowns, but we’ll see what happens.

On the hourly chart, we are seeing some very bearish signs. There is a triple bearish divergence on the MACD with the 3 previous highs and also a triple bearish divergence on the RSI. I think this will play out to either a solid pullback soon or the start of the next leg lower. I expect the pullback to go to the purple gap fill.

Now on the VIX, we shat down hard. When we have a 10% down day on VIX, we have a 80% chance that SPX has a red day in the next 2 days. Based on this and the triple bullish divergence on the RSI and bullish divergence on the MACD, I expect the VIX to the turn up on Tuesday and markets to pullback Tuesday. Hopefully it’s good enough for me to exit my shitty UVXY calls.

The JNK is above the previous highs and looking strong. Based on this, we might have more room to run in the tank.

Overall, I am expecting a short term pullback, but I expect the rug pull to come EOW or next week. I think that there’s still too much bullish momentum right now to expect the rug pull immediately, but I do expect a pullback looking at the hourly chart. I want to see signs of a rug pull on the daily chart before I go hard into swing puts. I expect SPX to pullback and then either make a new high or a higher high with a bearish divergence on the daily chart. I still expect a rug pull to come and retest the lows. I’ll see how the weekly candle ends and see if we are out of the bear market, but until we have a strong close on the weekly, my view on the leg down won’t change. Good luck all.

5 Likes

This is a good analysis @Yong. I would like to add that there has been a recent inflows in certain sectors. The link below shows that only 3 sectors still had outflows for the most recent weeks. Those being Tech, Healthcare and Energy.

I think you are right. I think we are seeing moving of money into more recession resistance sectors. It’s interesting that healthcare and energy still saw some outflows but that could be because those flows moved to other sectors for these past few weeks.

I think earnings and economic events these next few weeks will be the telling factors. This might also be the bull rally before the rug pull. We will have to wait and see like you said. We should be following smart money in the long term.

2 Likes

It’s opex week, so gamma is at play again. SPX 4000 is the strong magnet - for now, will play the role of resistance. Vol trigger is 3970, so quite high. Below that level, volatility increases.

Overall, we are coming up on that pesky trendline markets seem to have respected thus far. The 200SMA is right around the same area too.

VIX is quite low, making options rather cheap. Will be looking at getting some longer-dated downside protection, maybe into Feb opex.

7 Likes

TLDR: Don’t know where we go, but I still expect downside in the longer term

So it seems like we were backtesting the downtrend line, but we’re also in the ascending wedge. From here, we either have another rip up to the upper ascending wedge or we break down from here. I’m honestly betting on upside because the MACD is looking strong, RSI is still above 50 levels and looking like it wants to turn upwards to form another divergence.

The daily chart shows a slight increase in volume, maybe some trend change? But the volume has been low either way and it’s not really a big enough increase to cause alarm. Again, everything still looks strong the on the daily, not much signs of breakdown happening right now imo. I expect another turn up towards the ascending wedge.

VIX rose up and then died. Makes me think that bullish momentum is still strong and people aren’t piling into puts yet. I’m betting on VIX making a new low which should lead to SPX having a good rally up.

Junk bonds are slowing down, we’ll see what happens. But it’s a good sign that junk bonds aren’t selling off hard if you’re a bull.

Overall, might be just some chop/ range days given this huge move up for the next couple days. We’ll see if this consolidation leads to a break up or down, but I’m betting on a breakdown, especially seeing that DOW is getting hit harder than the other indices when it’s the one leading the rally

1 Like

TLDR: Well I guess here was the rug pull, I’m expecting a gap fill of the purple line and then I expect some kind of rally to the upside.

So on the hourly, we can see that we hit the purple trendline again and then topped here. I thought that we would get a rally big enough to hit the upper ascending wedge, but we broke down from here. The trend does look like it’s starting to change as we did make new lower lows, but we’ll see if we can confirm with a lower high. We’re not yet too overextended to the downside so I’m going to guess unless we gap down hard overnight, we should hvae enough fuel in the tank for the move lower to the gap fill purple line. RSI is crossing over to be bearish, MACD is rolling below 0 and the 8/21 EMA has crossed over. All bearish signs.

Now on the daily, we can see a shooting star bearish pattern. Volume has increased, especially on SPY. This shows me confirmation that we are starting a downtrend. IT does seem like MACD is getting rejected off of the 0 line and things are turning back over to be bearish. Part of the reason why I’m expecting some upside here is because the RSI hasn’t crossed below 50 and because we are nearing some strong support levels here. Overall though, seems like we are breaking down and starting the next move down.

On the VIX, we have a bullish engulfing candle and seems like the bullish divergence is starting to play out. If VIX starts to continue to turn up, it should confirm the downtrend.

I stopped really focusing on the yields and the dollar because they seem to have lost strong correlation with the markets so far.

Now another reason why I expect a rally soon is because of the options. This Friday, we have a ton of puts at 390 and a ton of calls at 400. Because of this, I don’t think that we’ll break 400 or go below 390. I think that we’ll either reach 390 after the gap fill and then bounce or bounce after the gap fill. I expect the markets to move up at least to 393-395 after breaking down. Good luck all.

5 Likes

Quick TA before everyone gets too bearish and jumps into hella puts.

Looking at the hourly chart on SPY, the RSI is starting to form a bullish divergence. Not something you wanna see if you want more downside. Also extended to the downside, even on SPX. I don’t expect much more downside from here especially because there’s no huge bearish news to bring the markets down like the last couple times.

Also look where we are. We’re at the area of huge support/ resistance. It’s gonna be tough to break through that if we’re already starting to get overextended.

Combined with the put wall at 390, I highly doubt that we’ll go much lower before a bounce. Maybe that happens tomorrow with today just chopping around here, but the risk/reward for puts at this area after going down $12 in 2 days is not there. Be patient.

5 Likes

i feel this. i closed my march spy puts today

3 Likes

TLDR: Pretty similar to yesterday’s. I expect us to end above 390 and head towards 395 based on options and then start a pretty heavy sell off next week.

So on the hourly, we got rejected off the 8 EMA and looking like we’re turning off from the oversold territory. The MACD is strongly in the negative area and it does seem like we’re trying to fill the gap above. We did get a pretty strong buy intraday and then a strong sell off into close. I don’t think that we’ll go lower to form a bullish divergence, but if we do, it should be a good swing play betting that we’ll rally and close above 390. Overall though, trend is turning bearish.

On the daily, we have a strong sell volume again today, but we did have a bottom wick, showing some buyers. I’m looking for a gap fill above before we head lower, but we’ll see if that happens. RSI is still near the 50 level, giving some hope that we won’t freefall from there and the MACD is still barely hanging onto the positive territory. Signs showing that we could have another day of chop or a slightly green day. As we go lower, I would watch out for the trendline in purple and see if we stall there.

Now another reason why I expect some kind of rally is because the VIX had a big top wick today. Maybe it’ll roll over a bit again and allow the markets to rally a bit during OPEX. I would buy UVXY calls, but that shit is ass at moving up and an olympic gold medal at moving down so I’ll pass.

Now JNK is confirming this movement, giving me another reason to think that we’re going to continue a downtrend, starting tomorrow or next week.

Overall, I am expecting a relatively flat or green day tomorrow where we end above 390 based on our oversold conditions, strong support area in the 390 range and mainly because of the amount of options expiring at 390. I think that the put wall at 390 will hold and the markets will push upwards. But the put volume starting next week isn’t that high, so I think the markets will continue to move down afterwards, so I’m betting that tomorrow will give us the rally for a good put entry. Good luck all.

3 Likes

I agree, I’m looking at a retest of 391 or 393 to retake my 03/17 385p for swinging, and likely something for Monday expiration for a daytrade/scalp.

1 h

30 min

2 Likes

TLDR: I expect downside, but we are at a critical time where this could be the moment where we do break the downtrend. If it does, then inverse Yong is undefeated.

So on the weekly, we are still below the 0 line on the MACD, which shows me that the momentum isn’t still all the way there. RSI is stalling at the 50 line. We did bounce off the 8/21 EMA , but still no weekly close above the downtrend line on the weekly chart. One thing that does show that we might be nearing the top is that this is the first time on the weekly chart that we formed a hammer candle at the downtrend line. Other tops at the downtrend line was a topping wick or a solid red candle. This makes me believe that after this leg down, we will bottom. Especially cause we have been testing the downtrend line a ton recently. Volume was lower though on this hammer candle, so we’ll see if buyers can step up next week.

On the daily, we are right back at the downtrend line. The purple is the trendline formed by the previous 3 peaks. Interesting to see where we stopped there. MACD is above the 0 line, RSI is turning back up and the 8/21 EMAs are still turning up. Overall looking bullish on the charts, but I think that this is a fakeout because of the OPEX. There was too much put volume at 390 and 395 so I believe that SPY rallied up above those levels to blow out those puts. I was expecting a rally above 390 and top near 393, which is the area I went in on puts, but I didn’t expect a rally this strong. We’ll see if I’m wrong and SPX continues to rally, but based on OPEX, I think this is just a fakeout.

On the hourly, the MACD is still below the 0 line, which is weird considering the strong move. RSI is looking strong though and the 8/21 EMAs are crossing back up. Overall, SPX charts are showing bullish signs, but the other signals are not.

The VIX isn’t falling lower even with this rally. I would want to see the VIX be in a consistent downtrend and stay below 19. But it’s looking like it’s forming a higher bottom. Also on the weekly, we formed a doji candle inside the previous weekly candle. The previous 3 times that happened, it marked the 3 huge tops at January, March and August tops.

The junk bonds were still up, but didn’t rally as hard as SPX. If this was a real bull breakout, I would want to see the small caps and junk bonds to move up as strong or stronger. This would show that buyers are actually stepping back in and risk on is starting to happen.

The biggest sign I’m looking at is the DOW. The DOW led this entire rally up, but on Friday, it barely rallied. If I want to see a continuation of the rally, I would expect the index that led to it stay strong, but it’s looking very weak. The DOW is also at the area where it has rejected this entire bear market. The RSI is still below 50, MACD has turned over and it’s looking like it’s losing steam.

Overall, the entire market is at a critical point right now. This could be the breakout that the bulls are looking for and next week could prove to be the start of the leg higher. Personally, I think that there are too many resistances here with too little good news to expect more upside, especially with the Fed saying that they’ll continue to stay hawkish. Whatever happens, the move is going to be explosive. So stay safe and good luck.

3 Likes

Indeed, though I wonder if we’ll see it play out next week. We’re right below that pesky trendline that SPX has not managed to break through, yet we are also above the 200SMA. (Image 1) This makes it possible to argue for all three possibilities for next week - up, down, or chop - until FOMC on Feb 1.

There is the usual set of decently important data points coming out this week (Image 2), but feeling unsure they matter anymore. Feels kind of like the time when Fed jawboning stopped mattering.

I say that because of two reasons - VIX has fallen asleep completely (Image 3), and bond market is so sure it’s going to be 25bps (Image 4) that some intrepid souls might be betting on 0bps now, too.

Option data was not very helpful either as the massive opex did away with magnets and such, and we’re right around vol trigger.

3 Likes