SPX Tech Anal: Will "Sell in May and go away" come true again, or should bears give it a rest?

@Yong , took the liberty of starting the SPX thread. The title is not nearly as colorful as your other ones :sweat_smile:

A few quick thoughts on the markets:

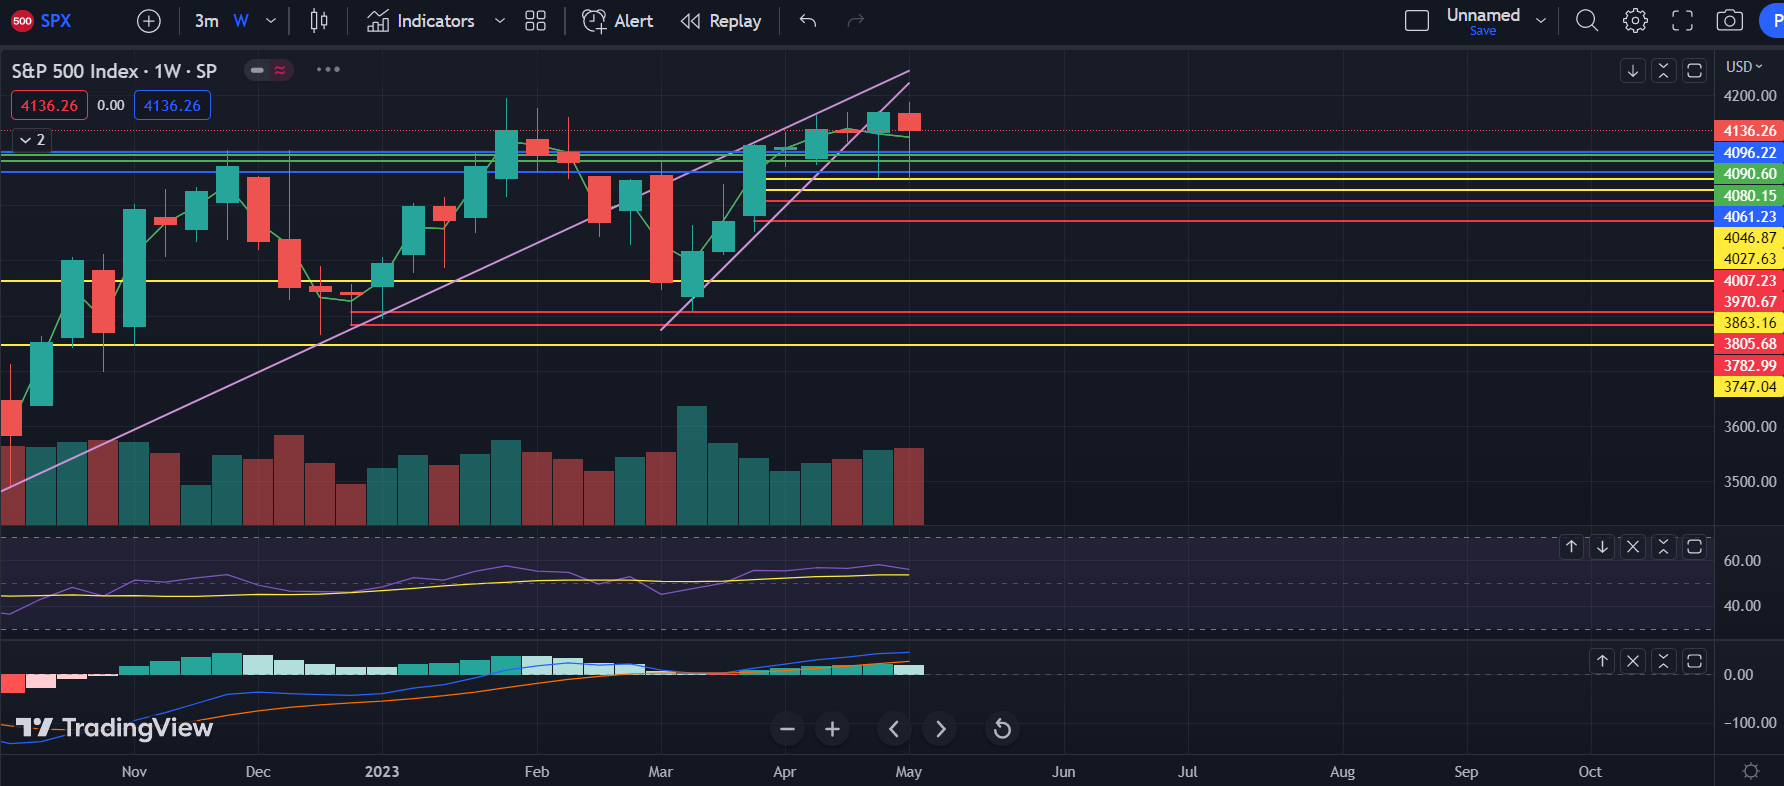
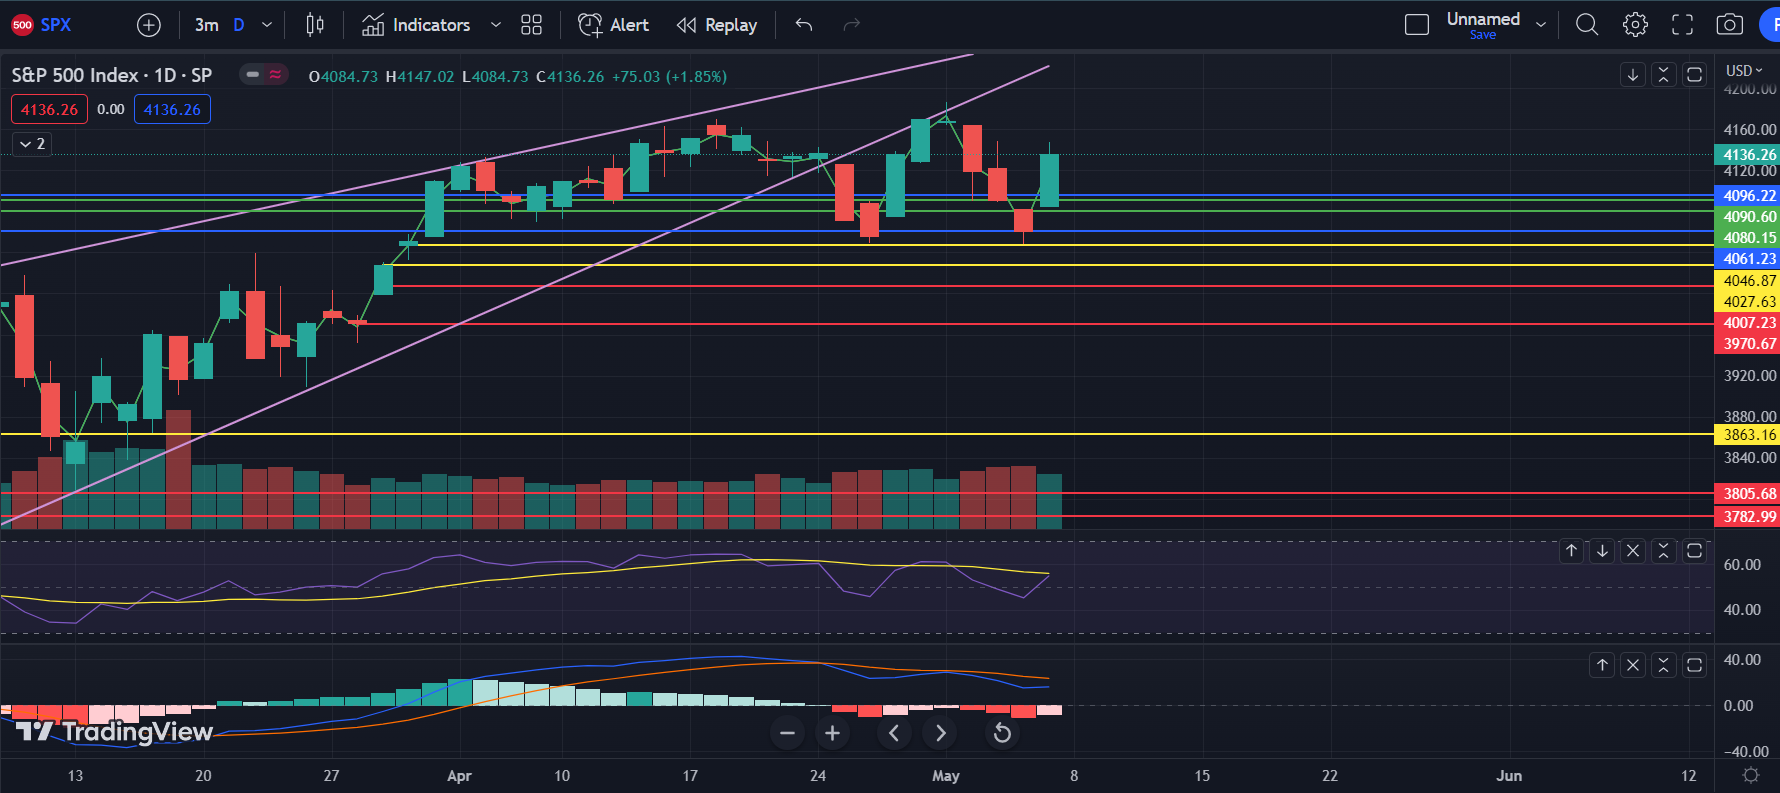
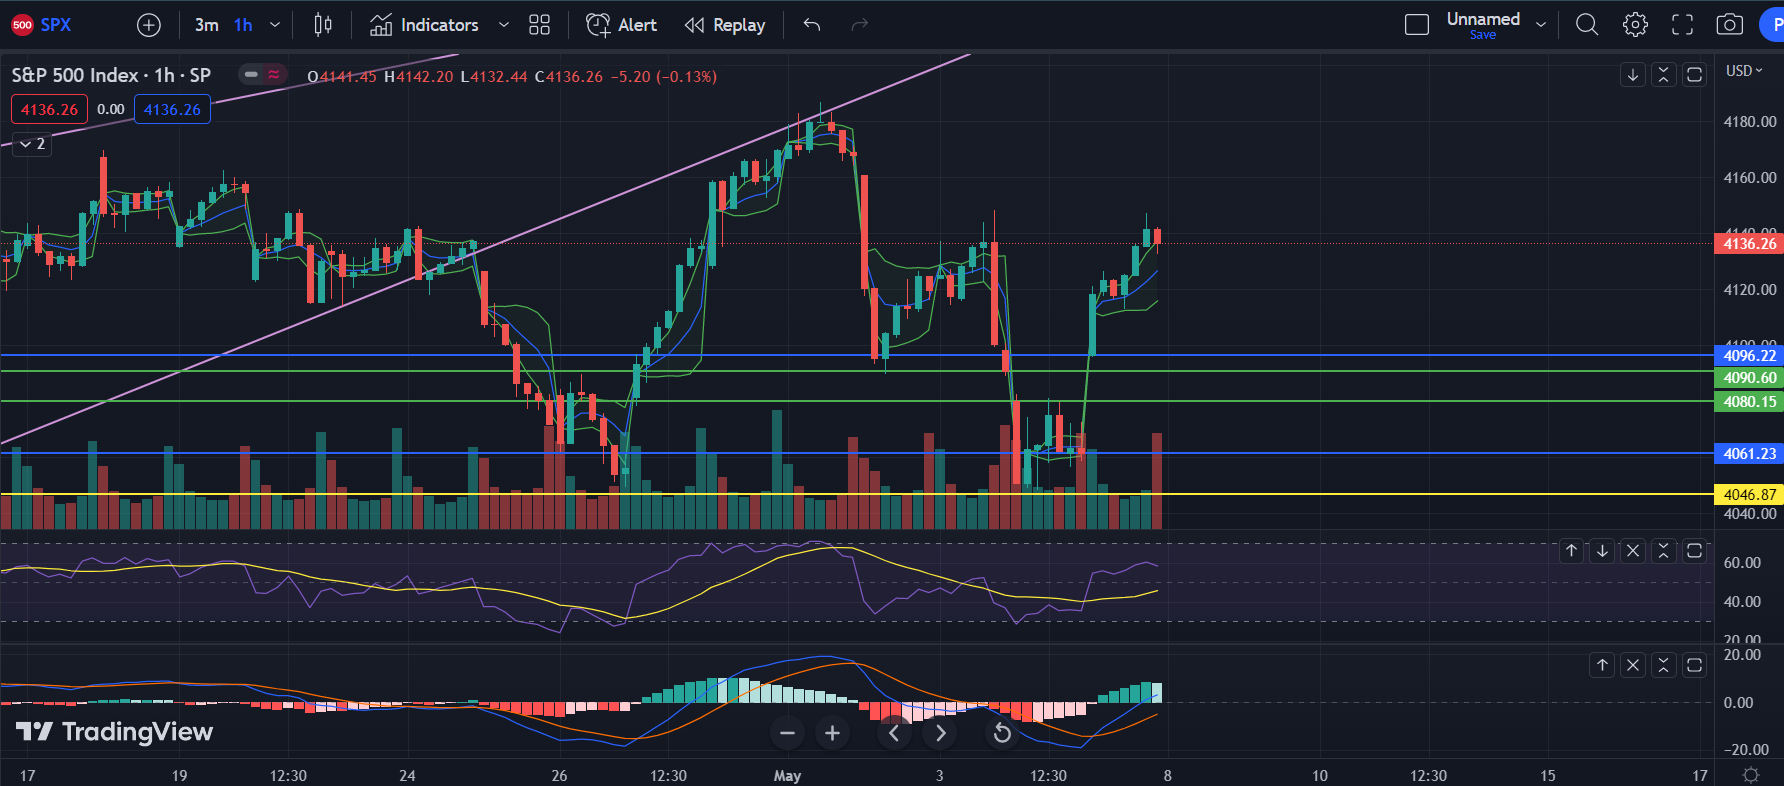
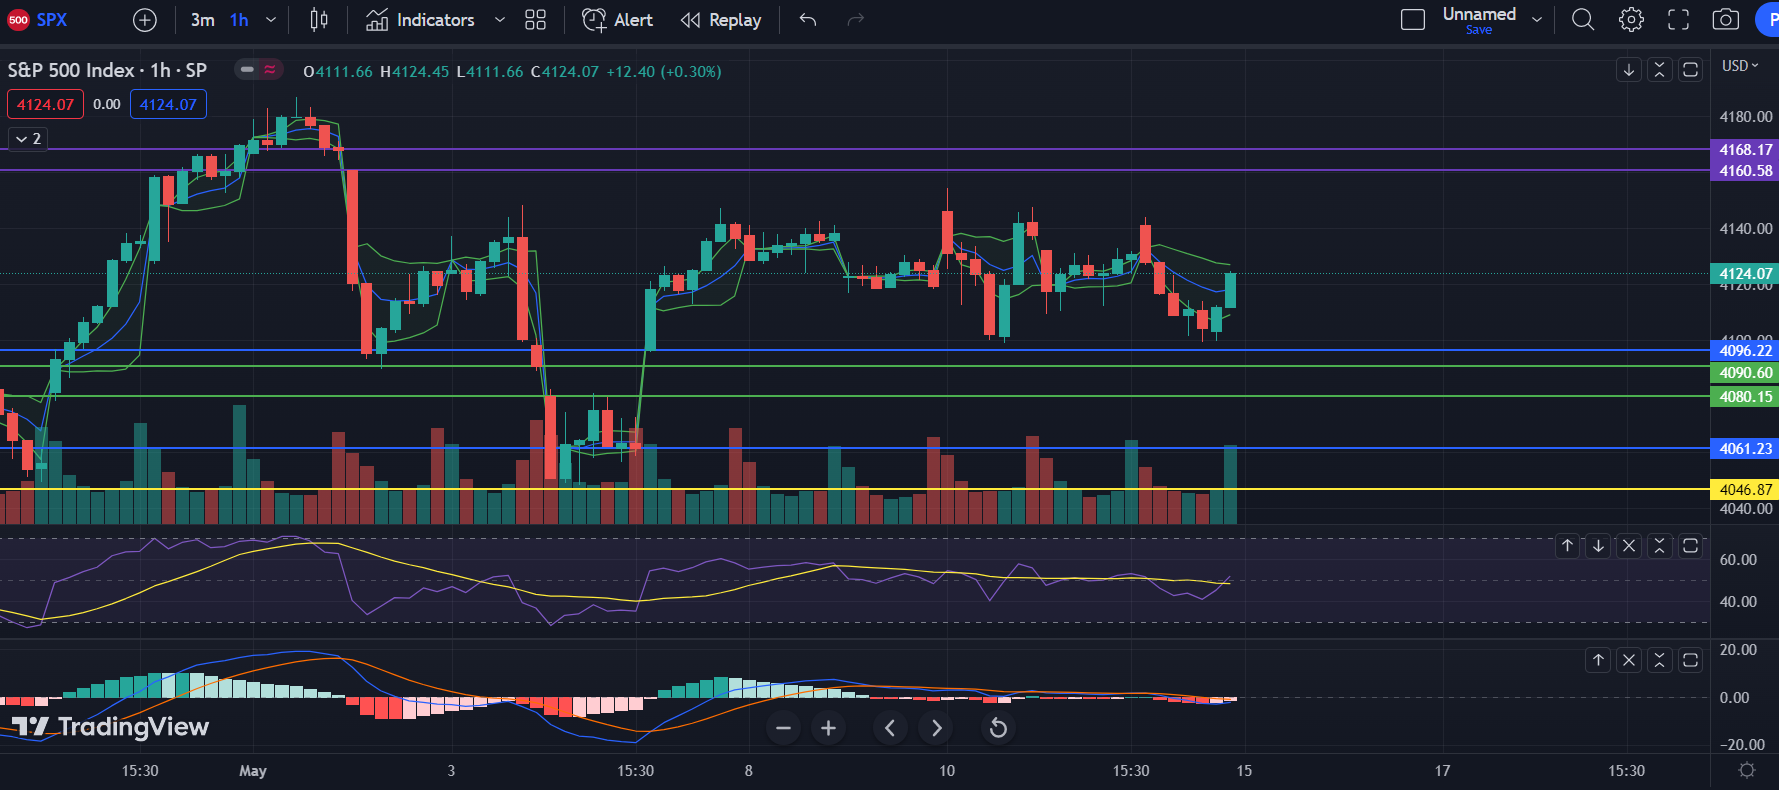
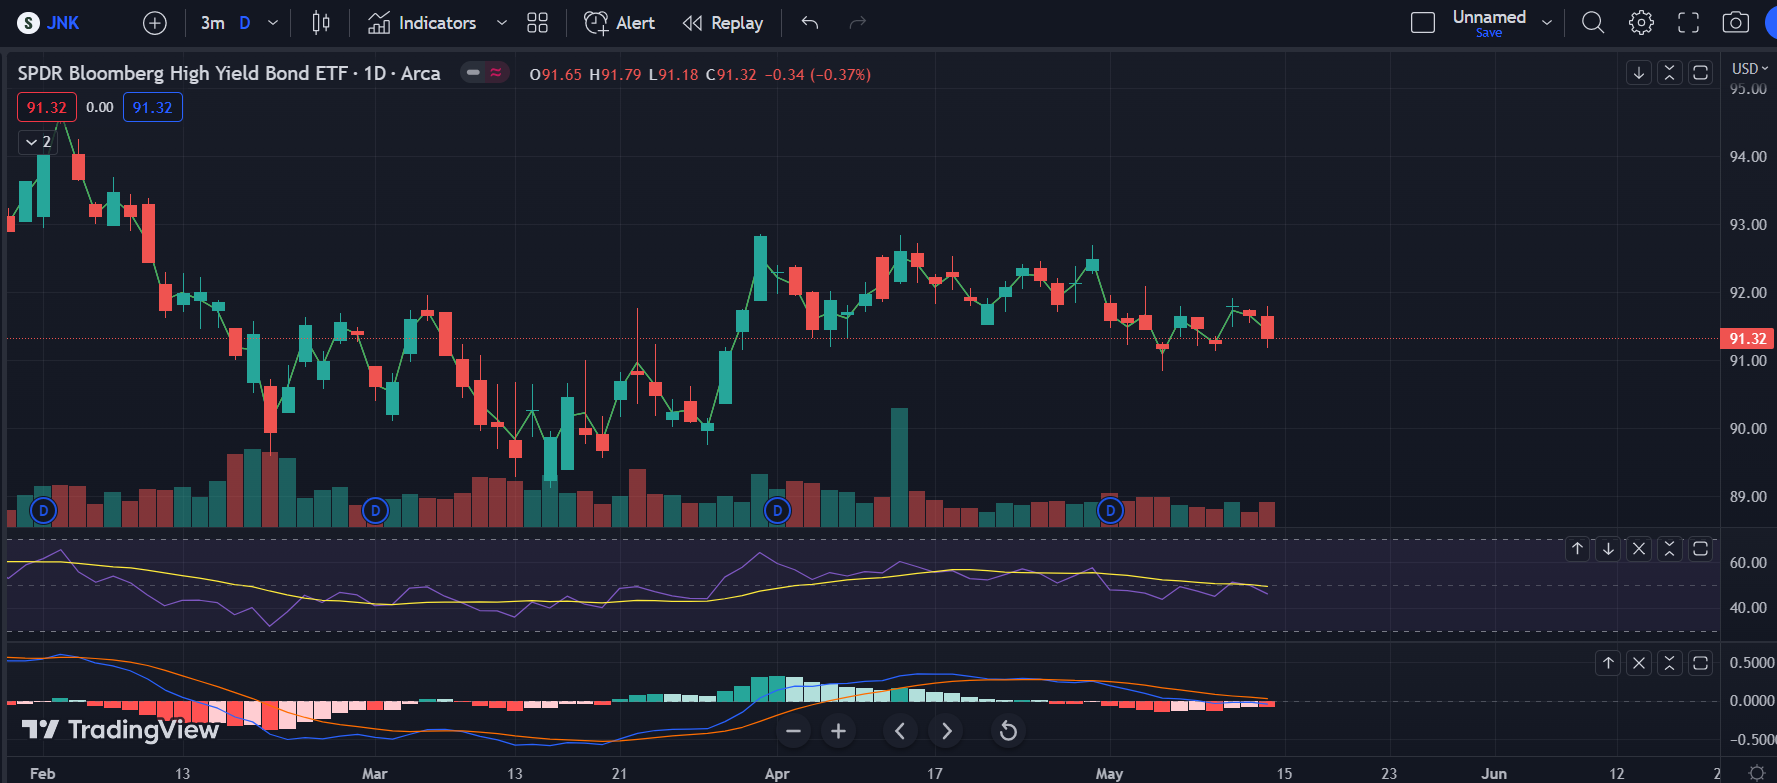
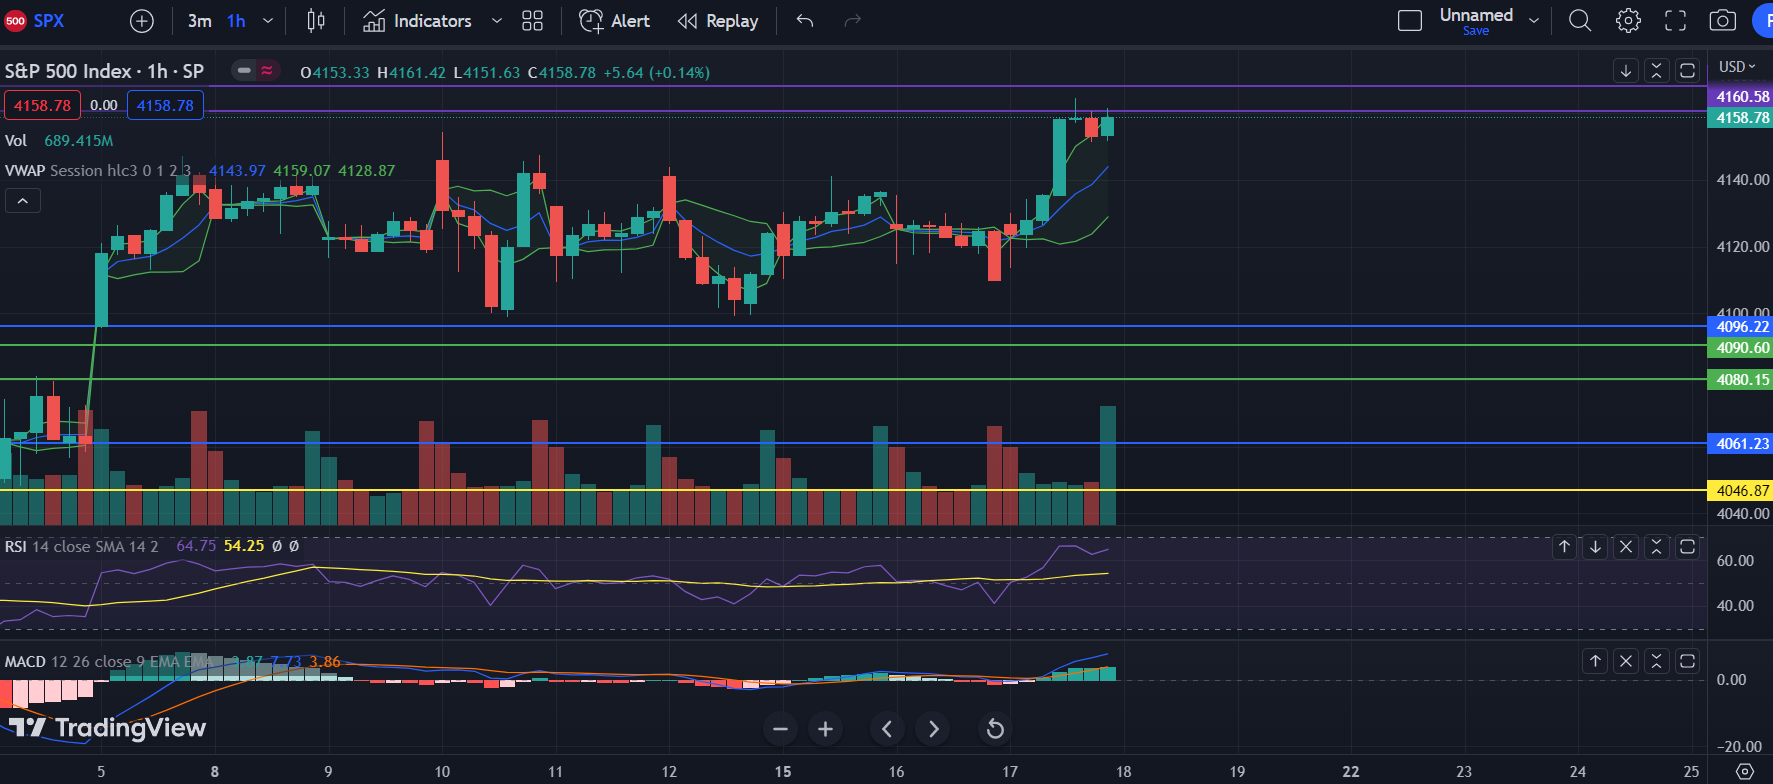
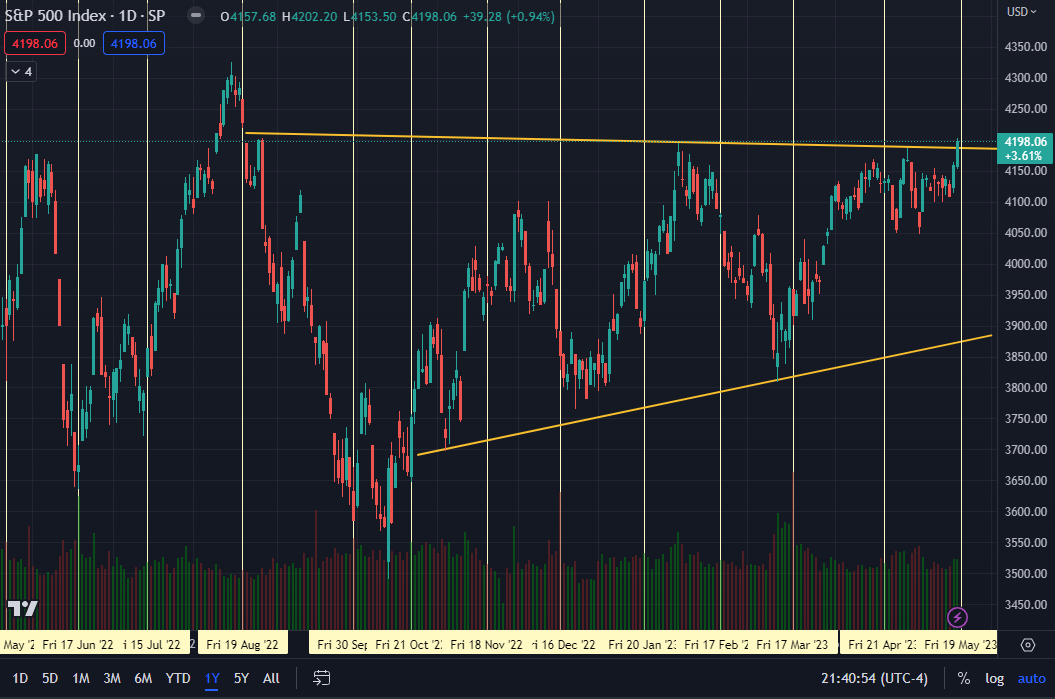
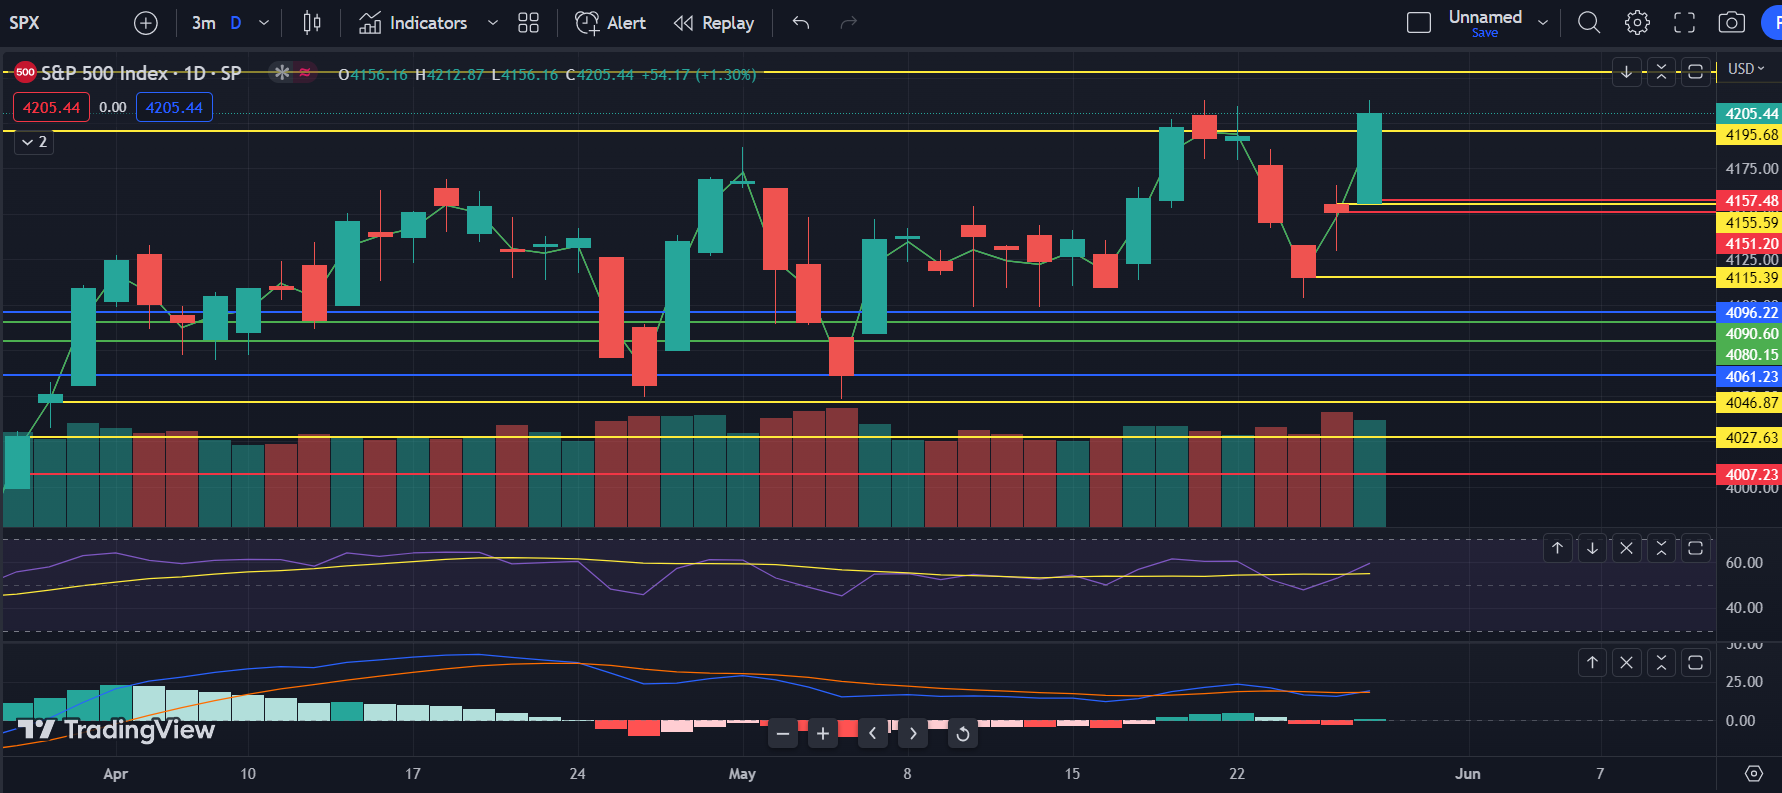
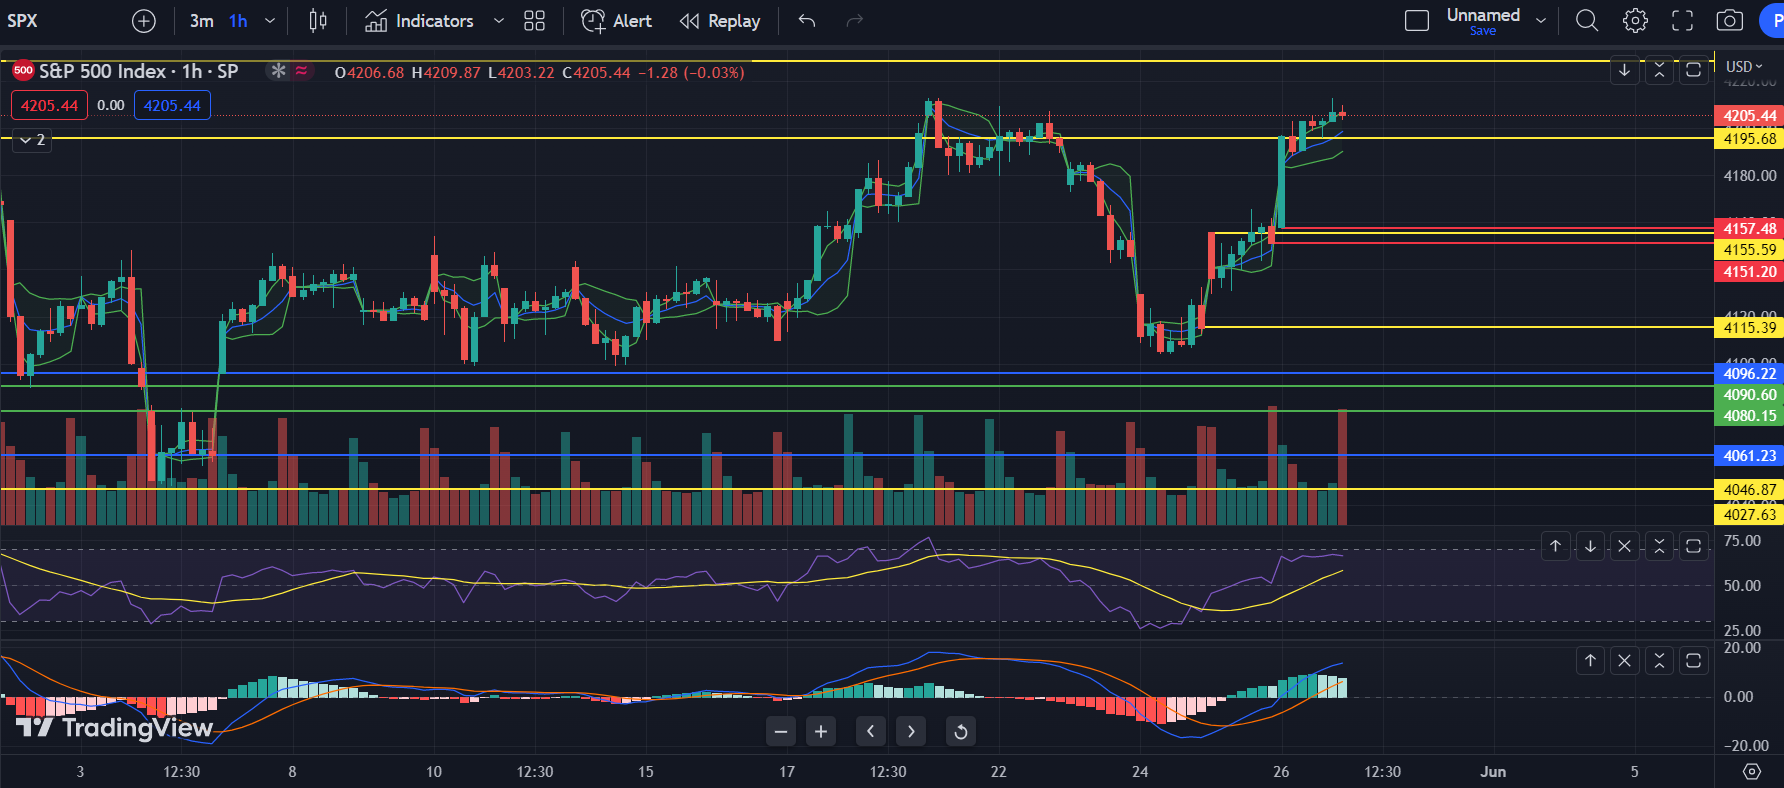
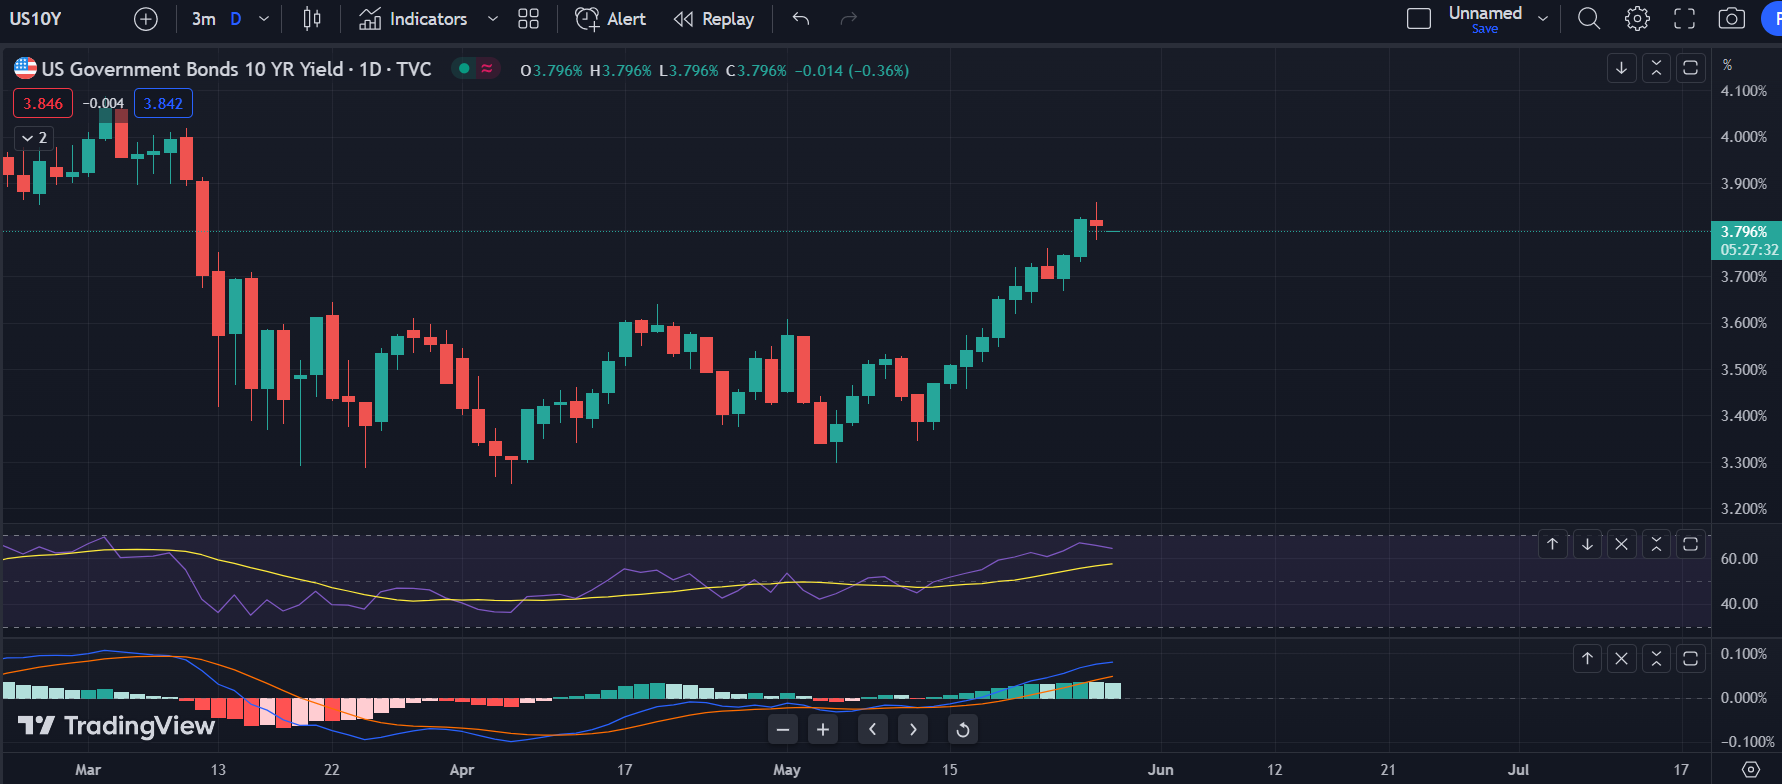
  • Not that gamma levels matter this early in the opex cycle, but to the extent that they are indicative, we can see the call heavy structure around 4200 (First image). The Combo chat (second image) suggests a gentle pull upward for the time being. Vol trigger (where gamma goes from negative to positive) is 4145, so we’re not deep in positive gamma territory though.
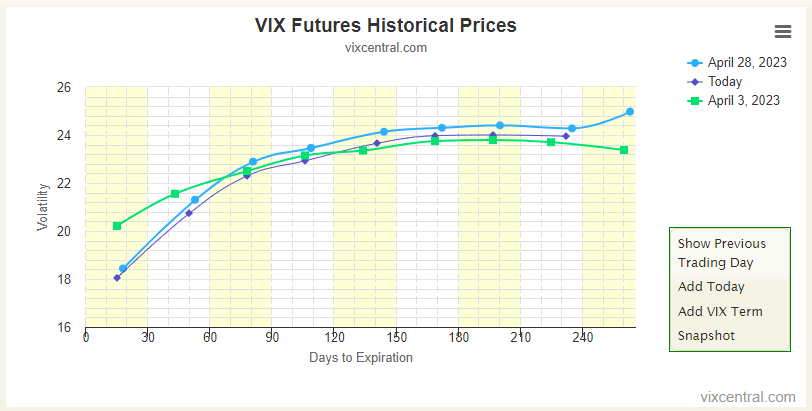
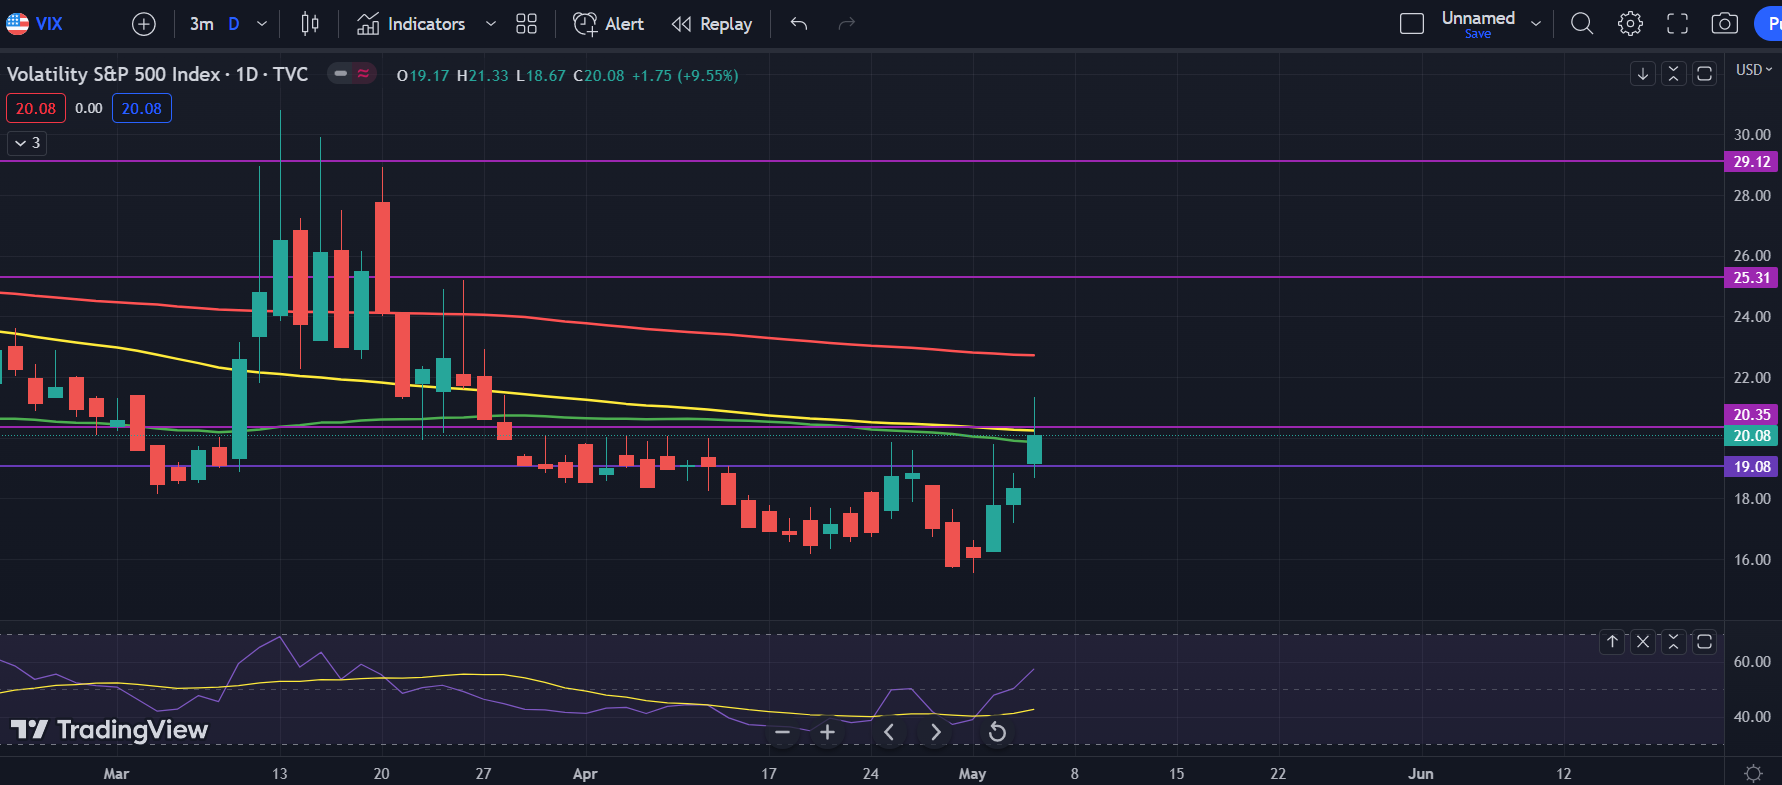
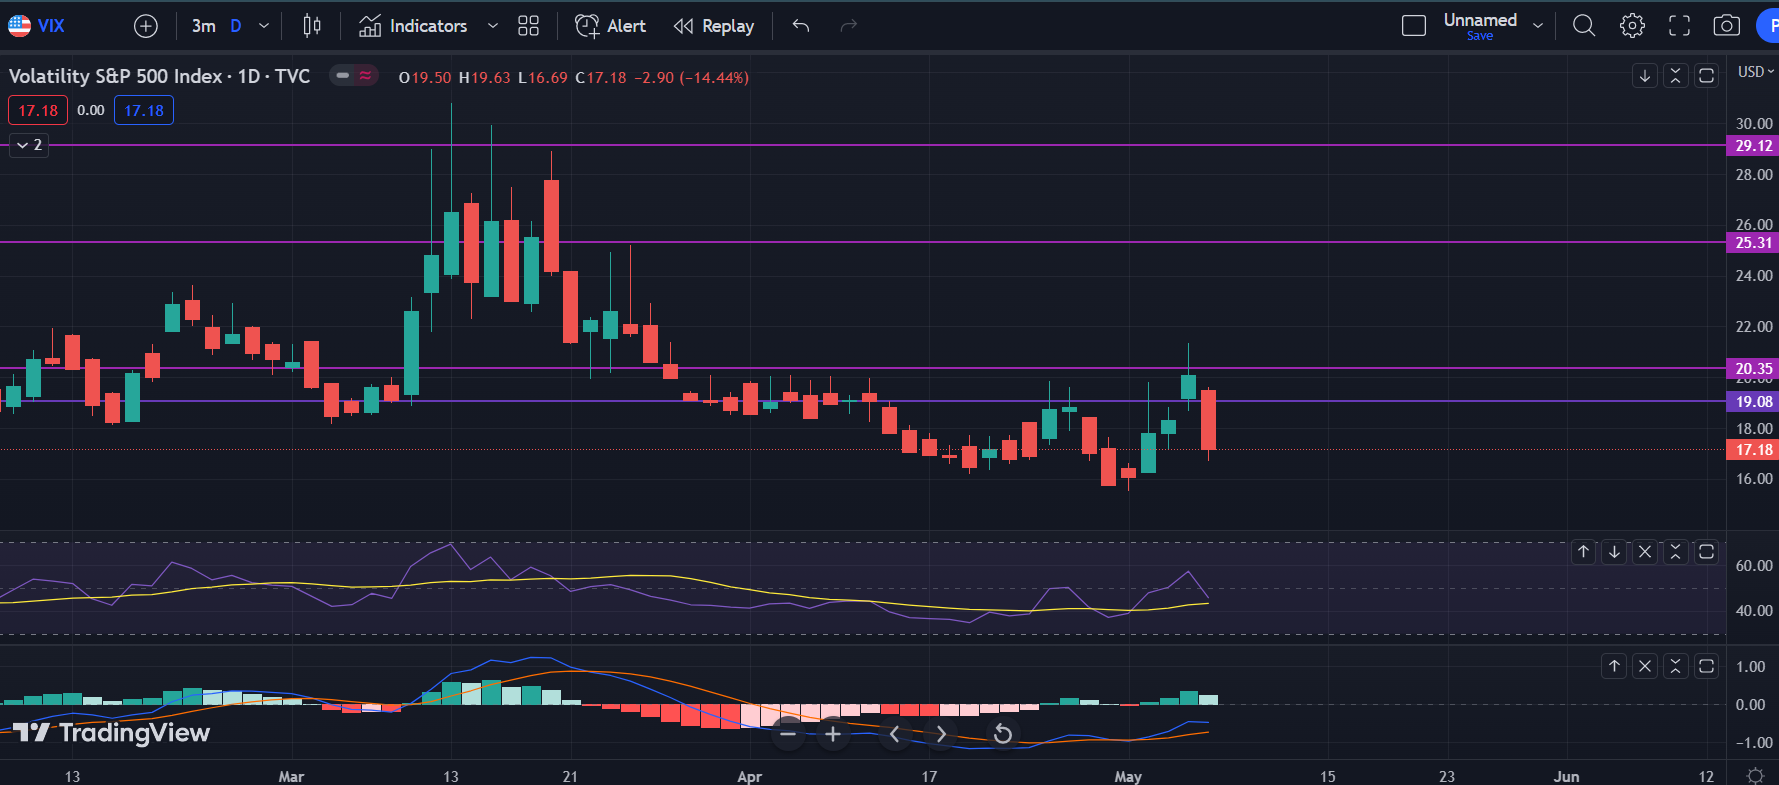
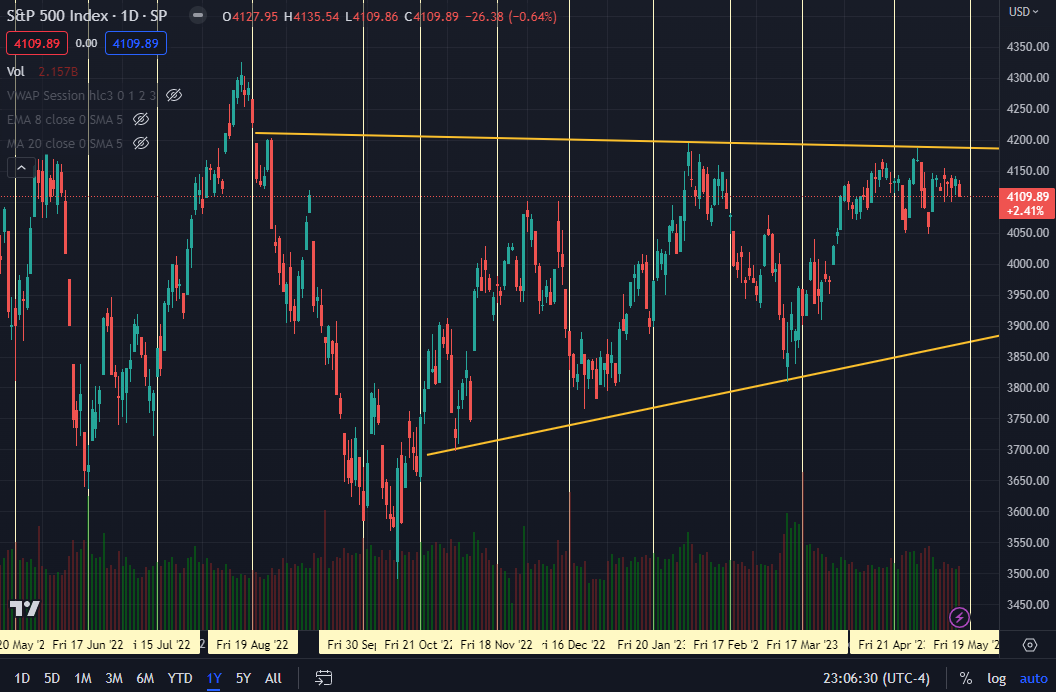
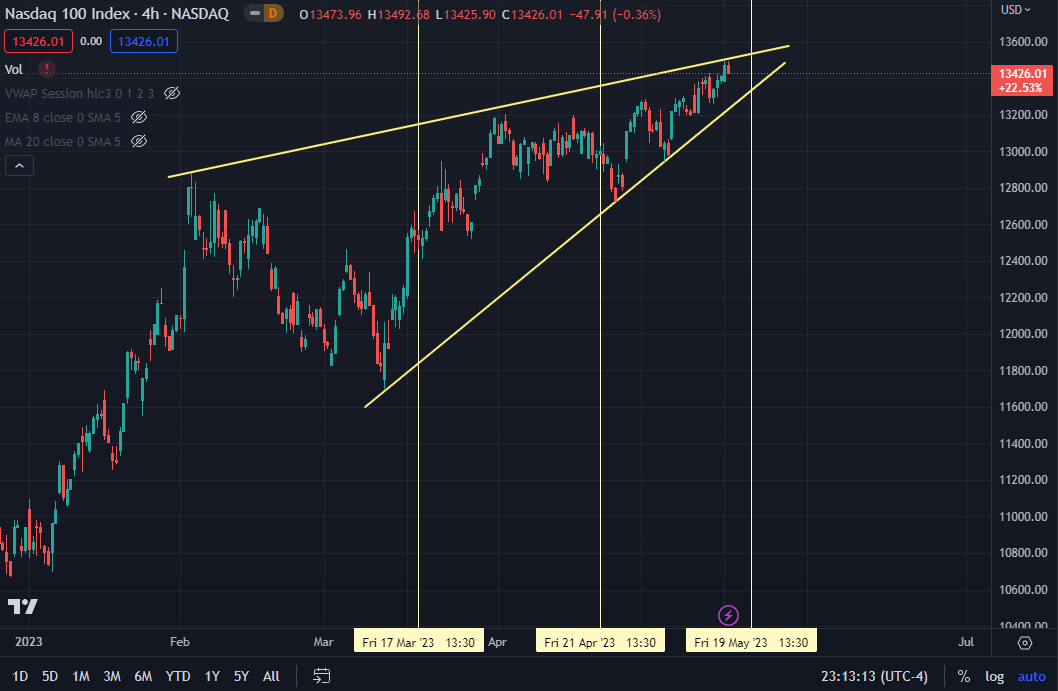
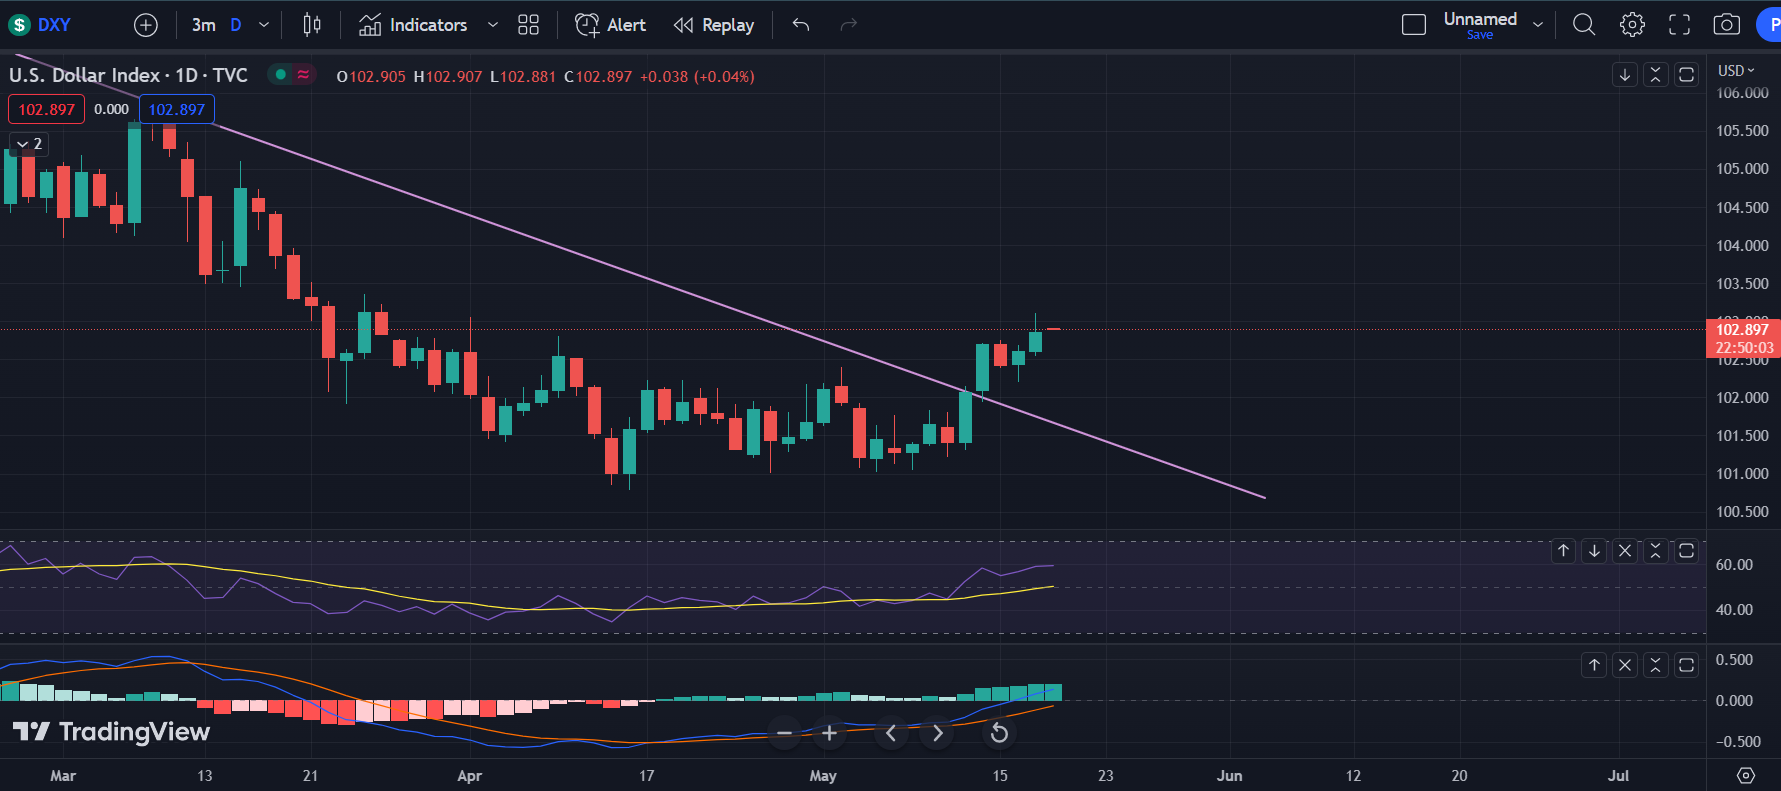
  • There is no fear in the markets. VIX in contango (third image), but also lowest in a year! (fourth image). May seem surprising considering we have FOMC and 2 data heavy weeks coming up.

Markets opened pretty quiet as Europe was closed today and FRC was resolved before markets opened. Feels like it’ll be another well-behaved week, and we might eventually end up north of 4200 soon. Maybe even flirt with 4300 before opex (5/19). It would take a major move from JPow or some major macro shock to throw markets lower before then.

However, this period has Feb 2020 vibes. Recession is coming - all indicators are pointing to slowdown. Once earnings are done, there is no actual good news to prop markets up anymore. Note that are good in that they are beating expectations, but those expectations were already adjusted downward, and earnings growth is generally negative. So I’d be looking at going risk off again around opex, as all the positive gamma expires. If vol trigger is high enough and we dip below it for some reason, it could start a self-fulfilling cascade downward.

Should be clear sailing for the next two-ish weeks though. Good luck to us!

8 Likes

Thanks @The_Ni I like the title name. I’ll get back to trading sometime later but here’s a quick TA.

TLDR: Seems bearish but I called CHGG earnings wrong again so maybe inverse Yong this too.

On the hourly, there is a bearish divergence on the RSI even though we’re making new highs. Also, it seems like we’re backtesting the breakdown of the rising wedge. Doesn’t seem bullish here.

Super low volume today and an upwick today. Bearish looking and it seems like we just backtested the rising wedge and gonna head lower. Bearish divergence on the MACD and RSI on the daily too. I’m personally looking at a solid drop to fill some of the gaps below.

Overall, I am expecting a pretty big selloff, but we’ll see if it’s just a higher low to keep heading up. Good luck all.

7 Likes

Using the correct thread this time because I’m not regarded
TLDR: We could theoretically start to rally tomorrow, but we’ll see if markets employment numbers tomorrow morning fuck it all up.

On the hourly, we are right at the gap fill. If we do break down due to bad data tomorrow, I expect an immediate gap fill. But given the good Apple earnings, I don’t think we’ll get a shitter again. We have a bullish divergence on the RSI pointing back to the last time we were this low, but no divergence on the MACD. This makes me think that any bounce will be met with more selling. But we are slowing down on the downtrend and starting to consolidate which should mean a bounce soon.

On the daily, we have similar volume as the last couple days and a slight bottom wick. Not showing much, other than let’s hope for a bounce. Seems like the trend is down for now on the daily.

VIX also finally broke above the 50 MA (green line). The last couple times this happened, it lead to huge sell offs so we’ll see if the Apple earnings can save SPY from more death spirals ahead.

The Junk bonds did make a new low, but it had a huge hammer candle. Makes me think that we might be finding some strength here and bouncing.

Overall, it seems like markets might be ending the week green with good Apple earnings, but we’ll see if jobs data tomorrow supports this. If not, well we go straight to the ground. Good luck all.

2 Likes

TLDR: I think we have more of this rally left given that VIX got crushed again, AAPL beat earnings, jobs numbers weren’t horrendous and we have an island reversal on the daily. But I am a little more bearish longer term and don’t think this selloff has ended.

On the weekly, we have 2 back to back candles of a bearish candle formation. Apparently, on an uptrend, having a bottom wick is bearish because it shows that sellers are entering the markets and starting to gain control. So we’ll see if this turns out to be bearish and we go red next week. I personally think that it’s a bullish sign that the bulls took control of each selloff, but we’ll see. The weekly RSI and MACD aren’t showing strong momentum that I would like to see if we’re in a new bull rally, but it’s still positive so that’s good to see for the bulls. The weekly seems bullish to me, but we’ll see if the hammer candles are a foreshadowing to bearish events.

On the daily, it looks like a double bottom forming and an island reversal. We had a gap down and a gap up, leaving a candle with gaps behind and after it. This is typically a bullish sign and I expect this rally to continue on and potentially test the previous high. One thing that worries me is that the MACD still hasn’t turned back up, it’s still crossed down and sloping down. Everytime the MACD has crossed over on the daily this year and last, it led to a huge selloff even with countertrend rallies, so we’ll see if this MACD crossover leads to a big selloff again.

On the hourly, we have some gaps to fill. If we break the blue horizontal line, I would expect a pretty quick selloff to the blue line again. One thing that worries me here is that even though we rallied hard, the RSI isn’t looking that strong to show bullish momentum and the MACD is barely above the 0 line. These don’t show strong signs of a bull rally, but more of a countertrend rally. But given the bullish momentum and good news, I would expect this rally to continue to on for a day or two before it fizzles out.

The VIX got crushed again, which makes me think that we have a bit more of this rally left. But a bearish sign that I see is that it was crushed by 10% or more. This means that we are most likely going to have a down day within 2 trading days.

Another bearish sign that I’m seeing is that the junk bonds are not showing the same strength as the other markets. If this makes a lower high or a much lower high than the markets, I have lots of doubt that we’re going to keep going up.

Overall, I think we have a green Monday, probably mostly a flat day, but we’ll see a continued selloff afterwards. Or I’m wrong and inverse Yong prevails and I continue to lose parlays, idk. Good luck all

3 Likes

TLDR: This is just brutal sideways action with nothing to really note until now. I am expecting downside starting next week to fill some of the gaps below, but we’ll see if we keep going sideways again.

So starting off with the hourly chart, 4100 held up really well multiple times. I guess that makes sense given that that is the gap fill area and if we break, we’re most likely gonna see a waterfall of selling to fill the huge gaps left below. Throughout this sideways action, RSI has remained near the 50 level or below, showing a lot of weakness even on the EOD retard recoveries. The MACD is also looking weak and showing weakening bull strength on each retard recovery rally.

On the daily, one thing that I notice is that the MACD is still crossed over bearishly and hasn’t turned back above, which has led to each big selloff all through last year and the selloff this year. I’m not seeing the same bull strength on the daily like the last couple weeks. RSI is also struggling to get past its MA and the volume is drying up. It is a good sign that we are seeing bottom wicks on the daily candles as it shows bulls not dying, but it’s nota good sign that we’re getting crushed everyday, soon I expect bears to take control and overpower the bulls. It also looks like we’re forming a potential head and shoulders formation the daily, so we’ll see if this plays out and we gap fill all the way to the red line.

Another big red sign that I’m seeing is the divergence between SPX and the equal weight SPX. The orange line is SPX. While SPX has been making higher highs or equal highs, the equal weight is continuously making lower highs. This shows that there are very few stocks actually making this move higher and the momentum and strength of this rally is weak. Makes me very suspicious of further upside when the momentum is looking weak.

Another sign of weak momentum is looking at the percentage of stocks above its 50 day moving average. It’s not at elevated levels like other previous tops or rallies. Shows that this rally and move sideways could be preparing for a selloff.

While VIX is dicking around, something that did breakout was the dollar. The dollar broke out of its downtrend line that its been riding for a long ass time now. I’ll be looking to see if this dollar breakout is frontrunning market weakness or if this breakout is nothing more than me drawing crayons and trying to make reason out of nothing.

Junk bonds are also heading lower and not showing the same strength that I was seeing the previous weeks. I’m seeing weakness and usually this shows the real direction of SPX. I’ll be looking to see make lower lows and see if the market follows.

Overall, we are still in an uptrend so even if we get a shit down, I’ll be looking for the markets to set up higher lows and higher highs into a trend. But right now, I am seeing too much weakness in momentum and warning signs to hope for a breakout above and rally up higher. The debt ceiling talks has also caused multiple market volatility, so it’s not looking sexy in my eyes. I’m in ARKK puts and going to re-enter MARA puts if Bitcoin has a countertrend rally. Good luck all and I hope this sideways chop hasn’t been hard as shit to trade.

It’s that time of the month again.

Mopex is coming up on Friday, which gives SPX a chance to shake loose from the narrow channel (Image 1) it’s been stuck in for weeks. The movement could start as soon as tomorrow, with vixpiration. Normally, I don’t track NDX (Nasdaq) but it is also slithering into the tip of its rising wedge, suggesting it might want to play too.

What makes this more interesting is SPX expiration is call heavy (Image 3) and NDX expiration is particularly call heavy (Image 4). When these calls expire on Friday, MMs should de-hedge by removing their long positions, thereby producing sell pressure.

Finally, vol trigger was 4110 at the start of the day, and we puked to 4109.89 at close. If we open below the vol trigger tomorrow, that is additional downward pressure.

All in, there’s a good chance we start a downward move in the next day to three, and continue for a bit on the other side of mopex Friday. If that sustained sell-off does happen, the trendlines suggest a move toward 3900 by June opex. The 6/30 JPM mammoth hedge strike is also 3885, which can act as a magnet.

Such a move is unlikely to sustain itself without a narrative though. Once the market starts moving, the debt ceiling negotiations could be made to provide the narrative. (H/t Cem Karsan) To be clear, I don’t think the machinations of the debt ceiling will literally cause the move - more that to make sense of the move, talking heads will assign blame to it.

2 Likes

TLDR: I’m still bearish because dollar is heading higher, S&P equal weight isn’t making higher highs, junk bonds are weak and there seems to be a h&s forming on the daily on SPX.

On the hourly, we rallied hard to the gap fill area. We almost got the gap fill, but failed. So there’s a chance we get another rally up to fill the gap. Not much else to see other than big green dildos and we’ll see if we get a bearish divergence on the RSI form. The MACD is bouncing off the 0 line so that’s also bullish. The hourly does seem bullish so we’ll see if this is a fakeout or it’s showing the new trend earlier than the daily.

On the daily, I see a h&s forming with the 4050 level as the neckline. If we don’t head higher, then we could start to breakdown, or we could start to start a new trend upwards. Another good sign for the bulls is that the volume was very increased today. Maybe due to Vix expiration or good news. But a big warning sign that I’m seeing is that the MACD still hasn’t crossed upwards. This is a big warning because if the MACD isn’t able to cross up, historically it hasn’t led to good times ahead. Every time MACD has crossed over on the daily the last year, it led to a big selloff and if the MACD failed to cross back up, every rally was just a shorting opportunity.

VIX is dicking around again even with the expiration stuff. Disappointing to see, but good for bulls.

The dollar was still continuing its climb up even with the markets going up. So we’ll see if this is a warning sign that the markets are just bull trapping.

Junk bonds are showing another warning because it has a big upwick and not making higher highs or even a higher high than the previous candle. Everytime junk bonds diverged from SPX, it has led to SPX following the junk bond’s direction after a bit.

Another warning sign that I’m seeing is that the equal weight S&P is making lower highs. It’s showing weakness and that this rally upwards is not showing the bullish momentum that you would want to see.

Another warning sign that I’m seeing is that the percentage of stocks above their 50 day moving average is making lower highs and not showing the bullish momentum that you would want to see.

Overall, I am seeing lots of warning signs that has played out last year. Maybe this correlation is now over this year and I’m just doing stock astrology now, but until we breakout above and show that we are in a new bull trend, I’m gonna still be bearish and bet that this rally is a bull trap. I expect a big pullback to fill most of the gaps below, but we’ll see if I’m right. Good luck all.

3 Likes

^^ Well, this certainly did not happen. SPX pushed past the trendline, and NDX donkey-punched its way out of the wedge.

This only puts even more calls ITM, and thus even more to expire on the other side of Friday. So, all else being equal, still expecting a downward move from that de-hedging.

All else is never equal, of course. Namely, any of JPow’s speech tomorrow at 11am EST, debt ceiling talks, and the tech-driven rally can materially overcome these positional flows…

4 Likes

TLDR: Still some warning signs that I’m seeing in terms of bearishness, but until this short squeeze rally is over who knows how far SPY will push up.

Because not much has changed in the indexes in the daily and weekly other than moving straight up, I’m gonna focus on the hourly. We’re right at gap fill from the last huge rally. I think that there’s a good chance that we rally up to gap fill and form a bearish divergence to pullback, but I’m just a fat greasy retard so who knows.

Now a couple things that I see is that the 10 year yields are rising big. This is not good for the markets as yields moving up is bearish. Also everytime yields moved higher while the markets moved higher, it led to a huge rug pull crash the last year. So we’ll see what happens.

Another thing I’m looking at are the bonds. The TLT bond ETF is selling off hard, probably due to the yields rising fast. The junk bonds are also looking a lot weaker compared to the markets. And so far in this bear market, these bonds have given the true direction so I’m gonna guess that we’re gonna have a big selloff and rug pull soon.

Looking at the percentage of stocks above their 50 day moving average, even the 20 day moving average, they’re not making higher highs. There is a bearish divergence going on here showing that the momentum is not as strong as it seems. I’m not liking this.

Overall, I am seeing bearish signs that has led to huge selloffs this entire bear market so I’m not too optimistic in the months ahead, but we’ll see if we break this pattern this time. I am just a retard who loses parlays afterall. Good luck all, and it may be a very choppy Monday after a wild Friday so it might be better to stay out tomorrow.

4 Likes

TLDR: I am still skeptical of this rally, but until it actually turns around and starts to break down, I’m gonna keep playing the call side because the markets can be retarded far longer than retards can stay smart.

So there’s a bunch of fucking gaps which is interesting to see. Also pissing me off how it’s cluttering my chart, but yeah. We got another bottom wick on the weekly and a hammer/ doji candle. Some people can call it bearish, but I consider it bullish that we were able to overcome a large selloff. We’ll see if bears can take control next week or we’ll just keep going up bc of the debt ceiling. The MACD is firmly above the 50 level which typically means we’re out of the long term bear trend looking at the previous recessions. The RSI is failing to fall below the 50 line too which is good to see.

On the daily, I am worried looking at the bearish divergence at the 4200 level. It might be setting up a double top. I think that we’re going to fill the gap above and then start the downtrend correction, but we’ll see what happens. Right now, the markets are too damn bullish.

On the hourly, we can see a better bearish divergence. The RSI and the MACD are showing big bearish divergences from the previous high. There is a good chance that it plays out, but we’ll see if it does.

Now here are the main reasons why I’m skeptical of this rally. TA on SPY just shows that we should prepare to buy the dip if it comes, but things like the 10 year yields are rising hard. This should put pressure on stocks, especially the tech sector which is driving this rally. So we’ll see if the 10 year starts to roll over or the tech sector.

The dollar is also rising, putting pressure on the markets, but the markets are still heading higher. This is similar to the bear market rallies that we have seen before too where markets are front running good news while the dollar and yields are pumping, leading to a big downturn.

The junk bonds are not making higher highs and are showing weakness. This is diverging heavy with the markets and it doesn’t give me confidence in this rally.

Also looking at the equal weight S&P500, we’re nowhere close to the previous high unlike the real S&P500. This is concerning to see because you would want to see the momentum of all the stocks pick up, not just a few carrying.

Finally, we can see the same problem with momentum here with the stocks above the 50 day moving average making lower highs while SPX is making higher highs. There is no breath and strength in this rally.

Overall, I am bearish and betting on a downturn in the markets, but who knows when that’ll be. Until it happens, it’s just buy the fucking dip.

1 Like

Time for a positional update, since we are a little over 2 weeks out from Jun opex, and option positions will start mattering again!

As anticipated, the post-opex dehedging made for a few red days, but between no bearish macro trigger and the ongoing the AI hype, the drop did not sustain, and markets have been up since.

Right now, the market has a bullish setup going into 6/16 June opex:

  • Call wall is at 4300 so no immediate resistance overhead for about 100 points
  • We are in positive gamma territory - vol trigger is 4185
  • There’s a ton of call gamma overhead which should act as positive magnet as we get closer to opex
  • The mammoth 6/30 JPM collar short call strike is at 4320, which can also act as a magnet if the market gets closer to it (there’s a much smaller collar strike expiring close to 4200 tomorrow, but it’s not expected to have much of an effect)

Of course, macro can always mess with this, but until it does, I expect positioning to play a bullish role at least into opex for the reasons outlined above.

6 Likes