SPY Tech Anal: August Bear Market Rally or Actual Bottom?

I’m back. I also don’t know rn if June was the bottom, but we’ll see. I do think there will be another big move down to enter, so I’ll be watching that.

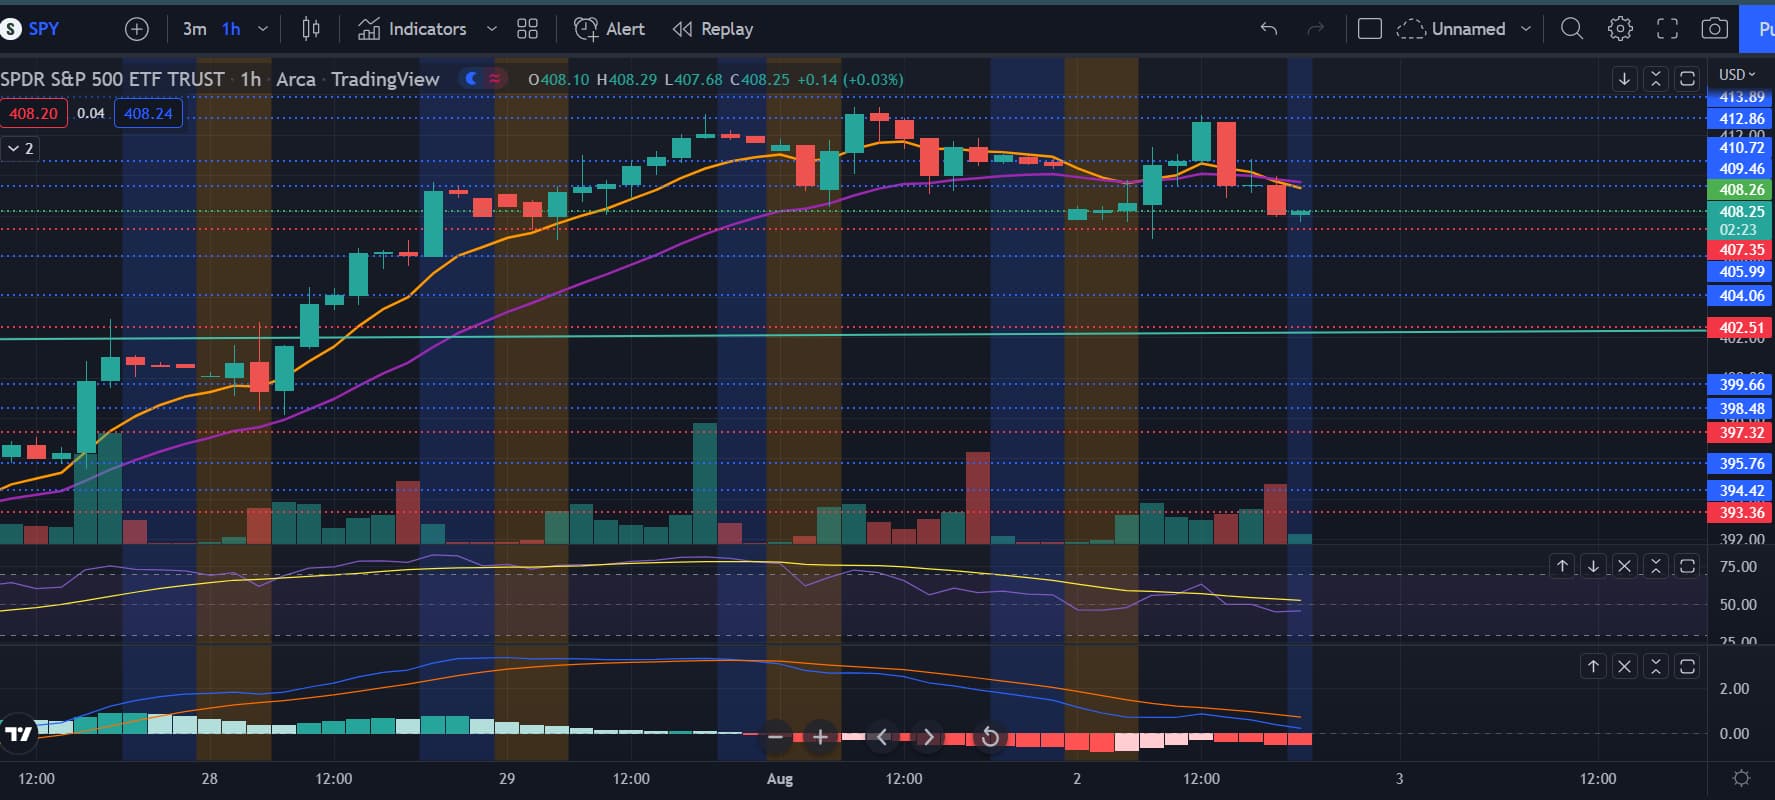
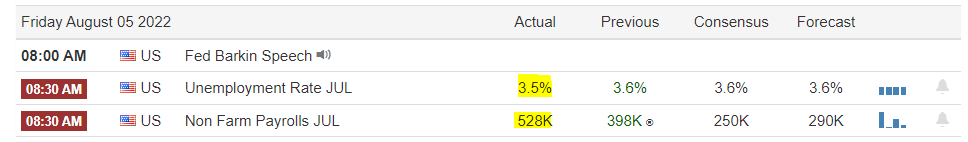
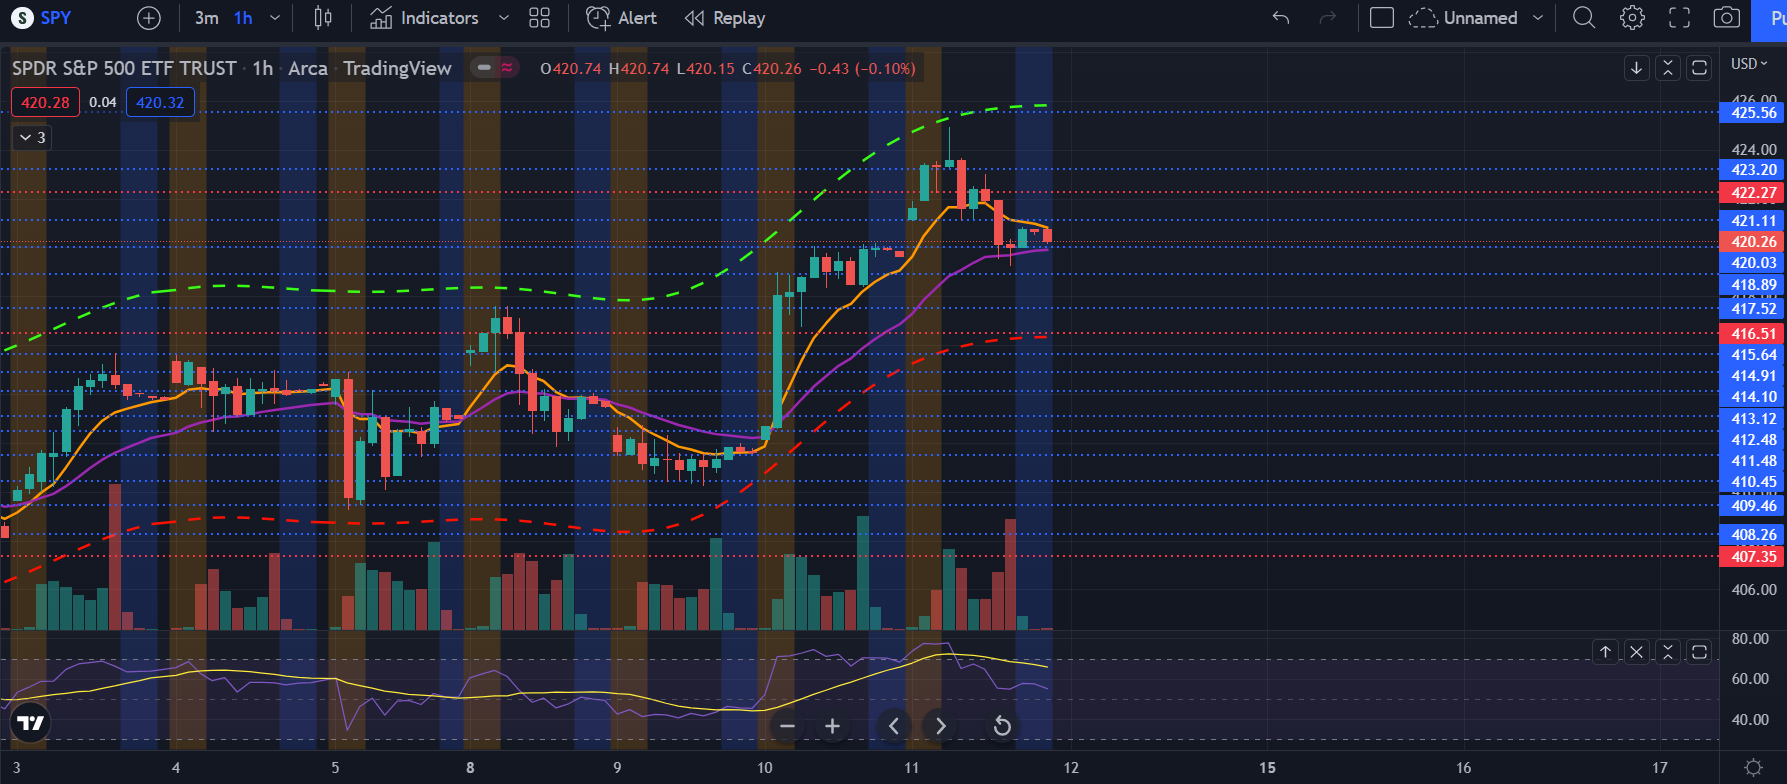
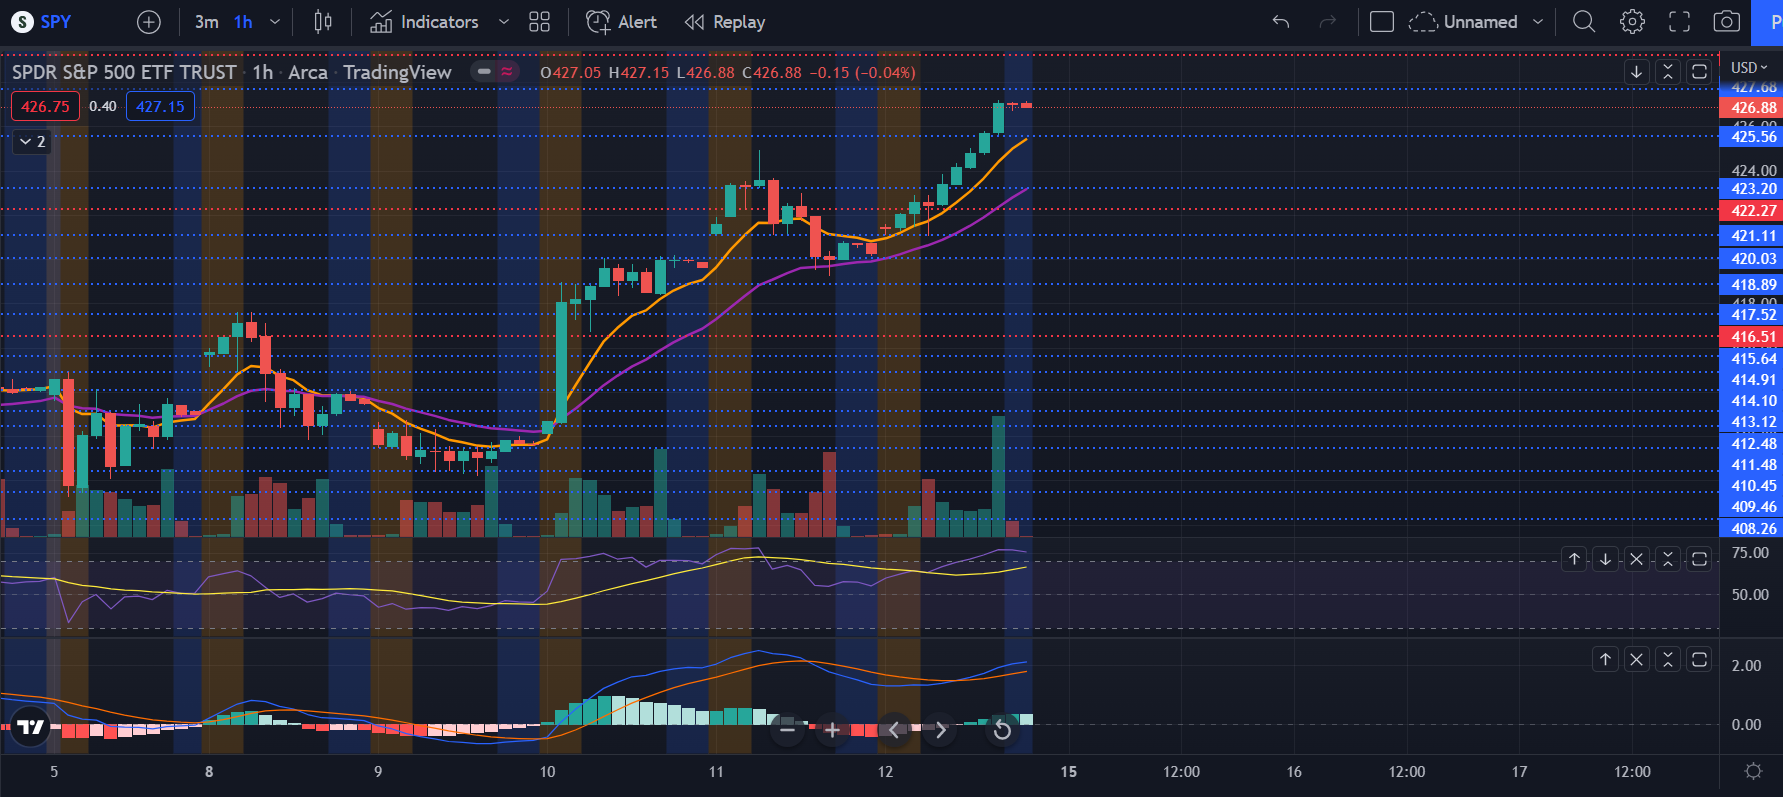
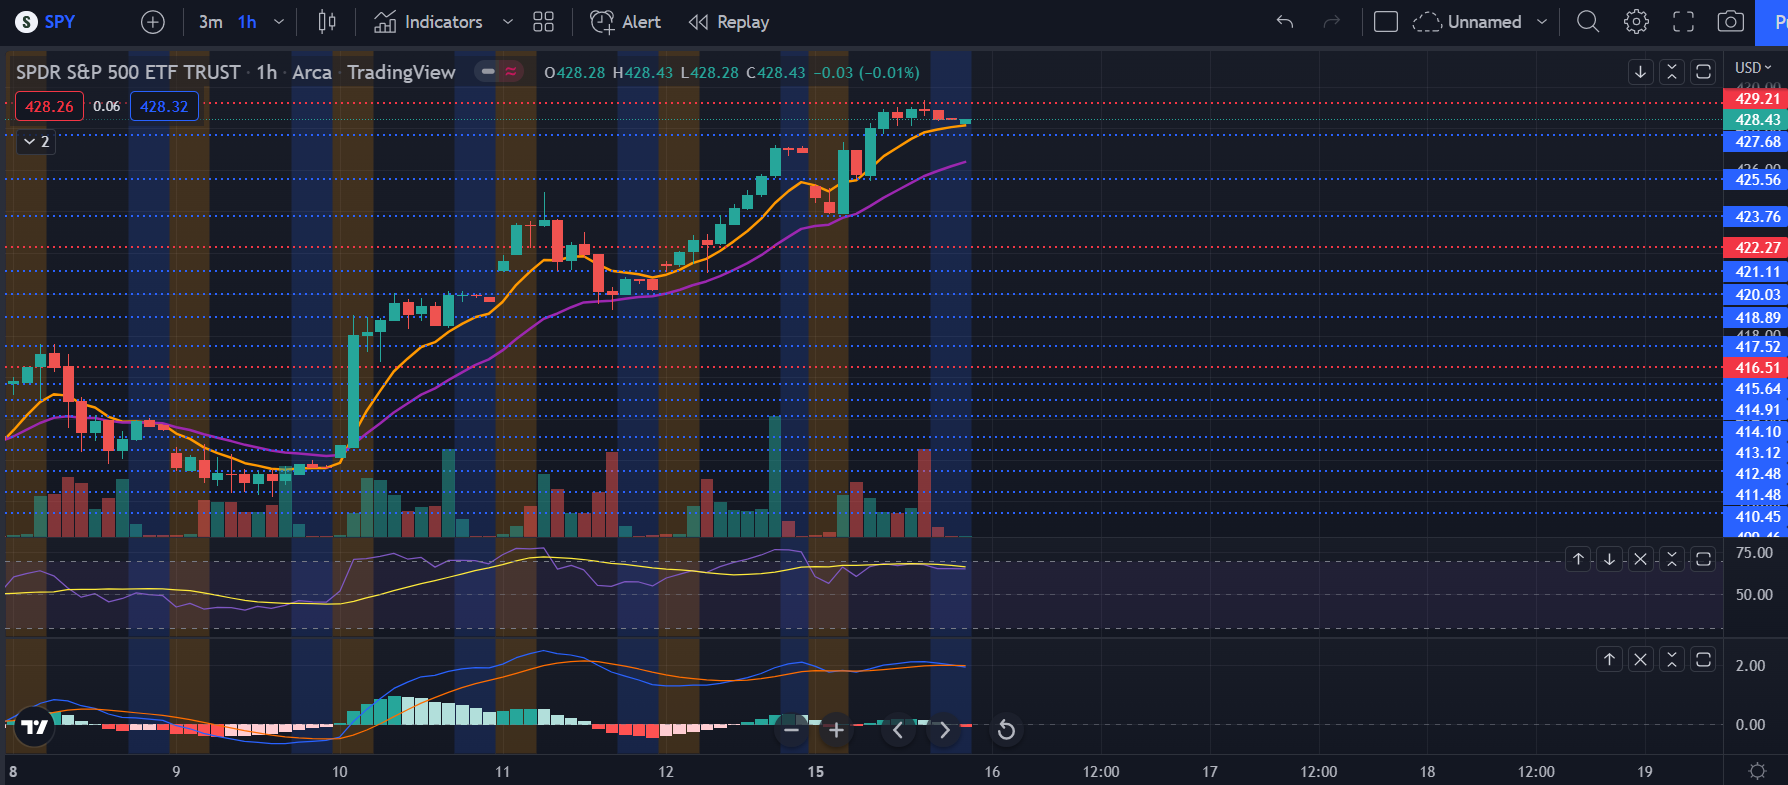
SPY on the hourly is looking bearish and looking like it wants to roll over. It broke the 21 EMA, tried to get above and failed. The MACD is continuing to show red bars, although it’s above the 0 line, which could mean that this is just a pullback until we go to 416 level. RSI is now below 50 and the MA, which is bearish. Also there’s a double top looking at the 413 level, which is also bearish.

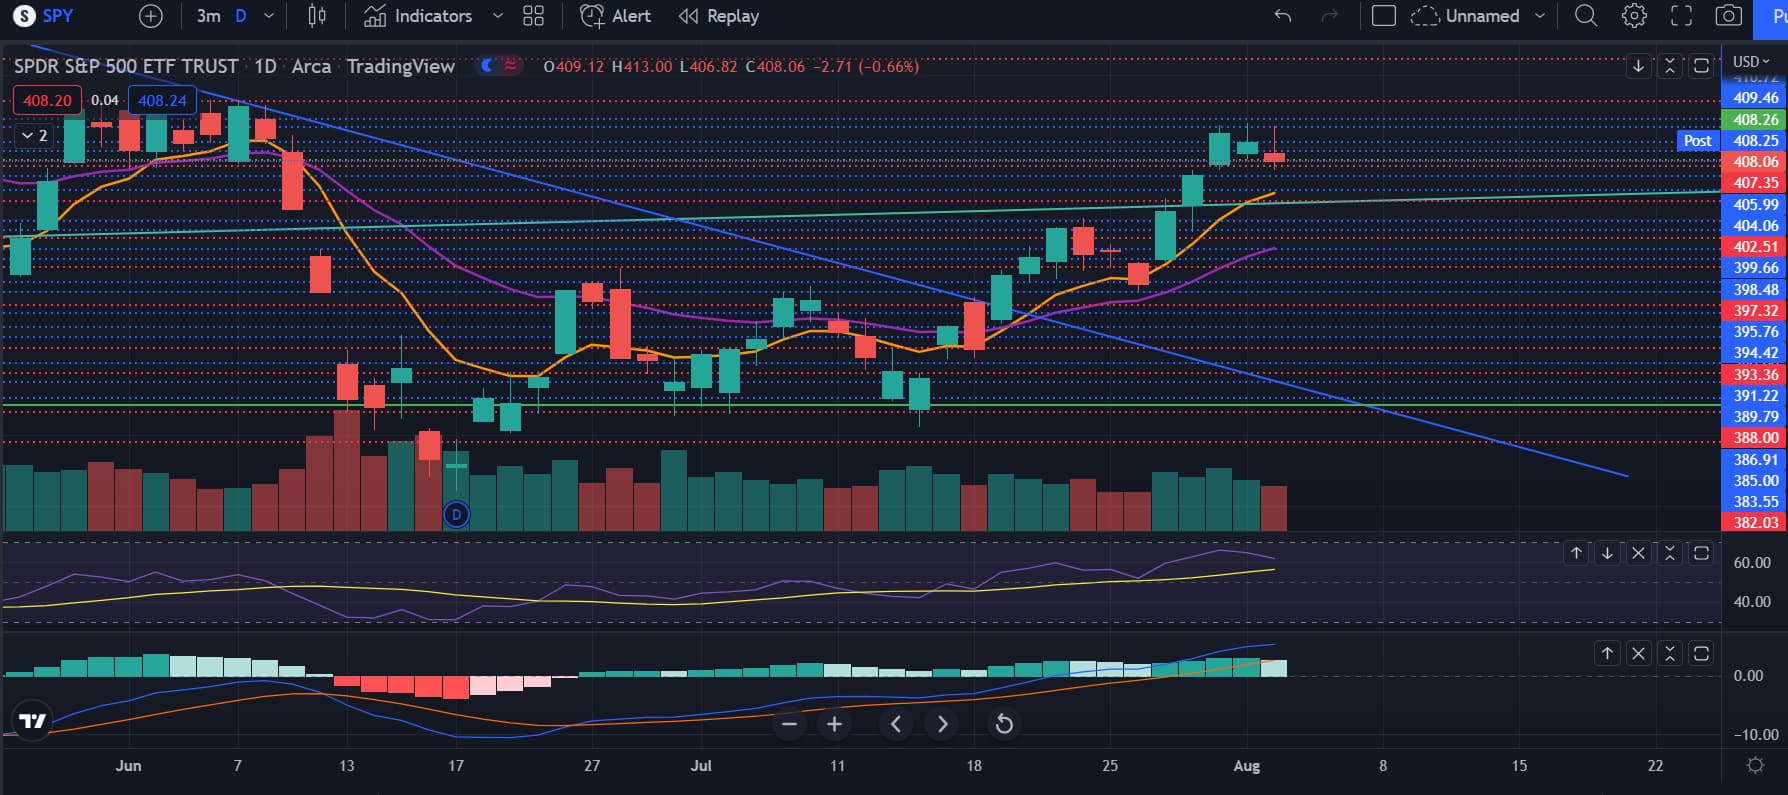
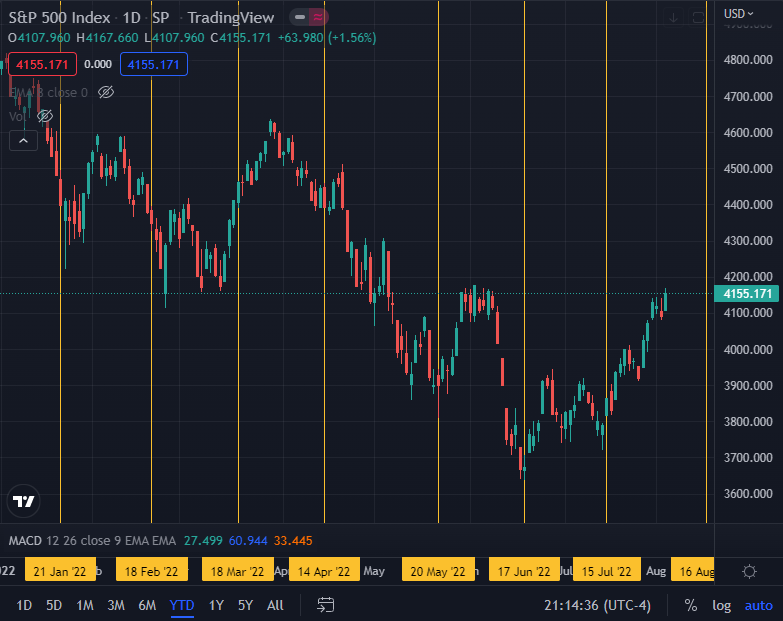
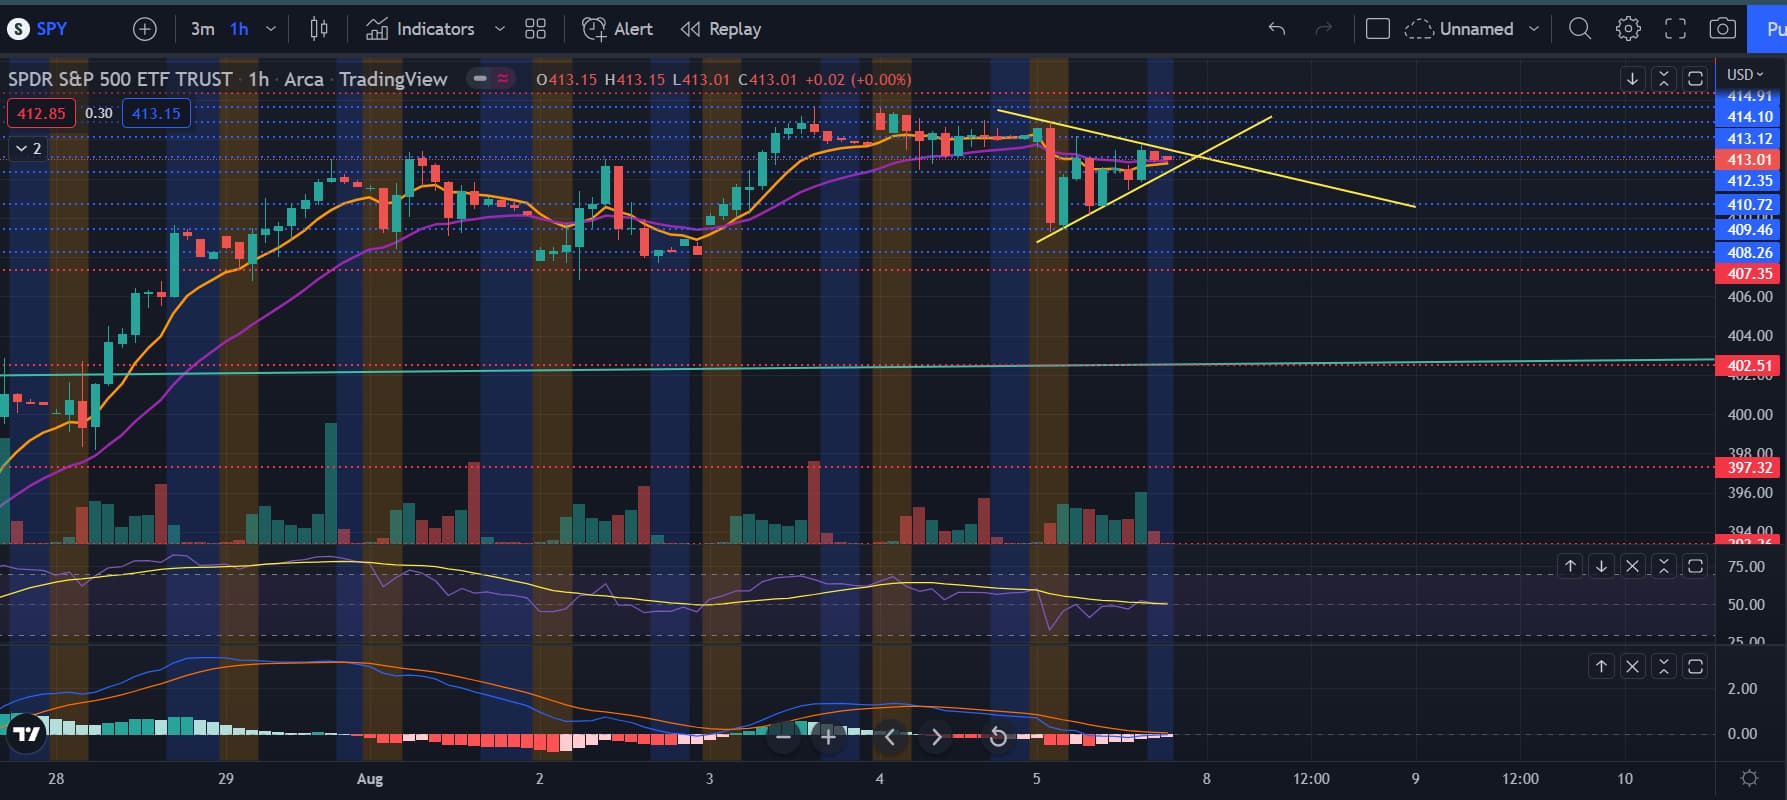
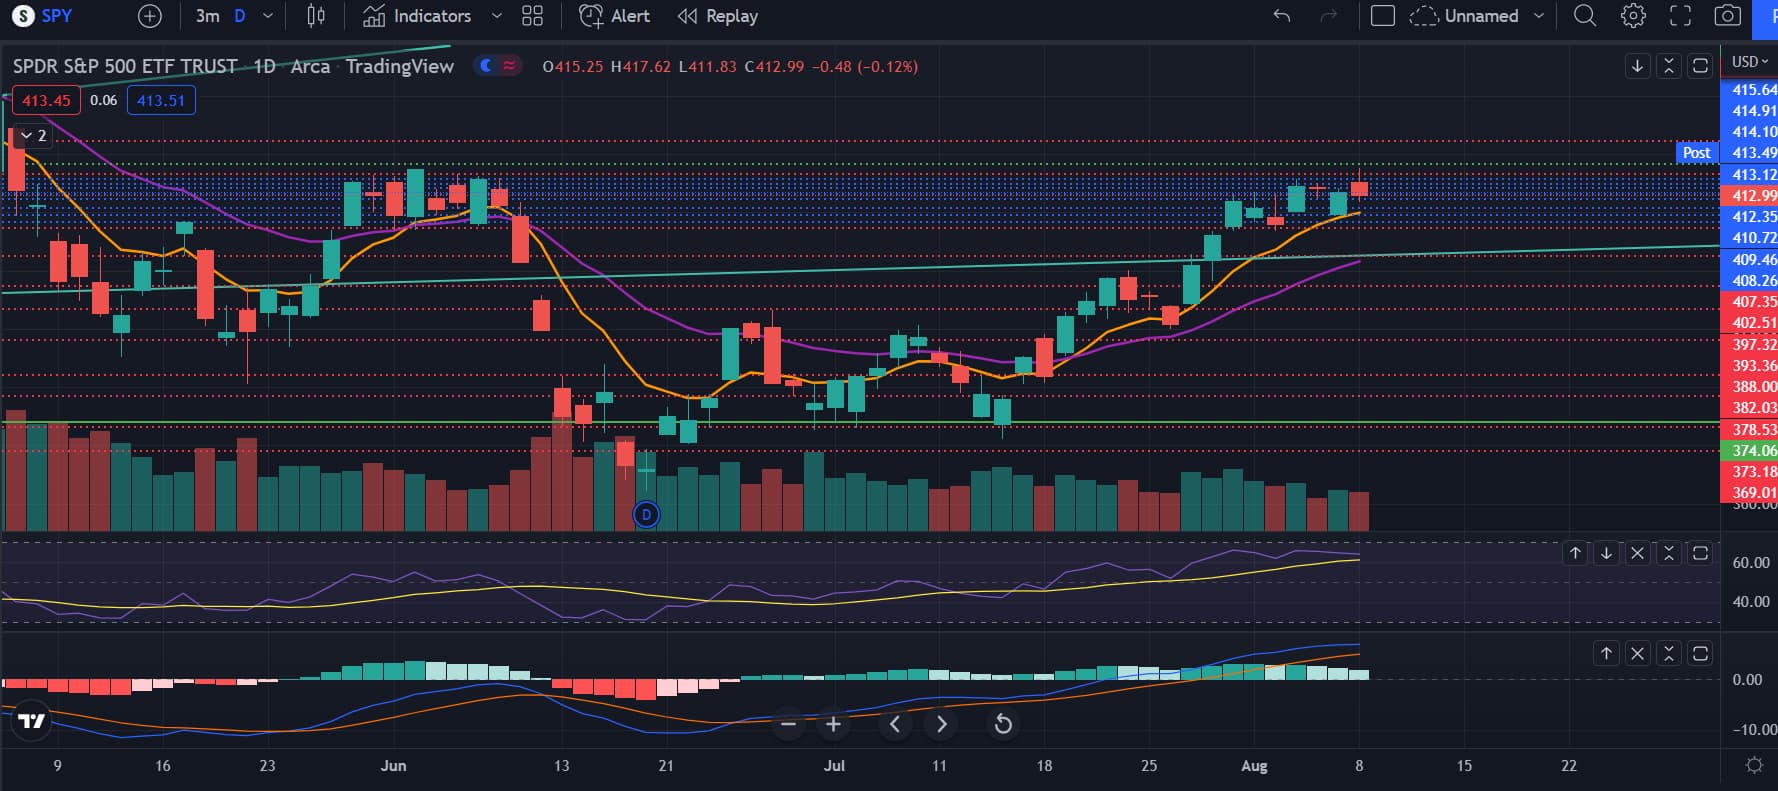
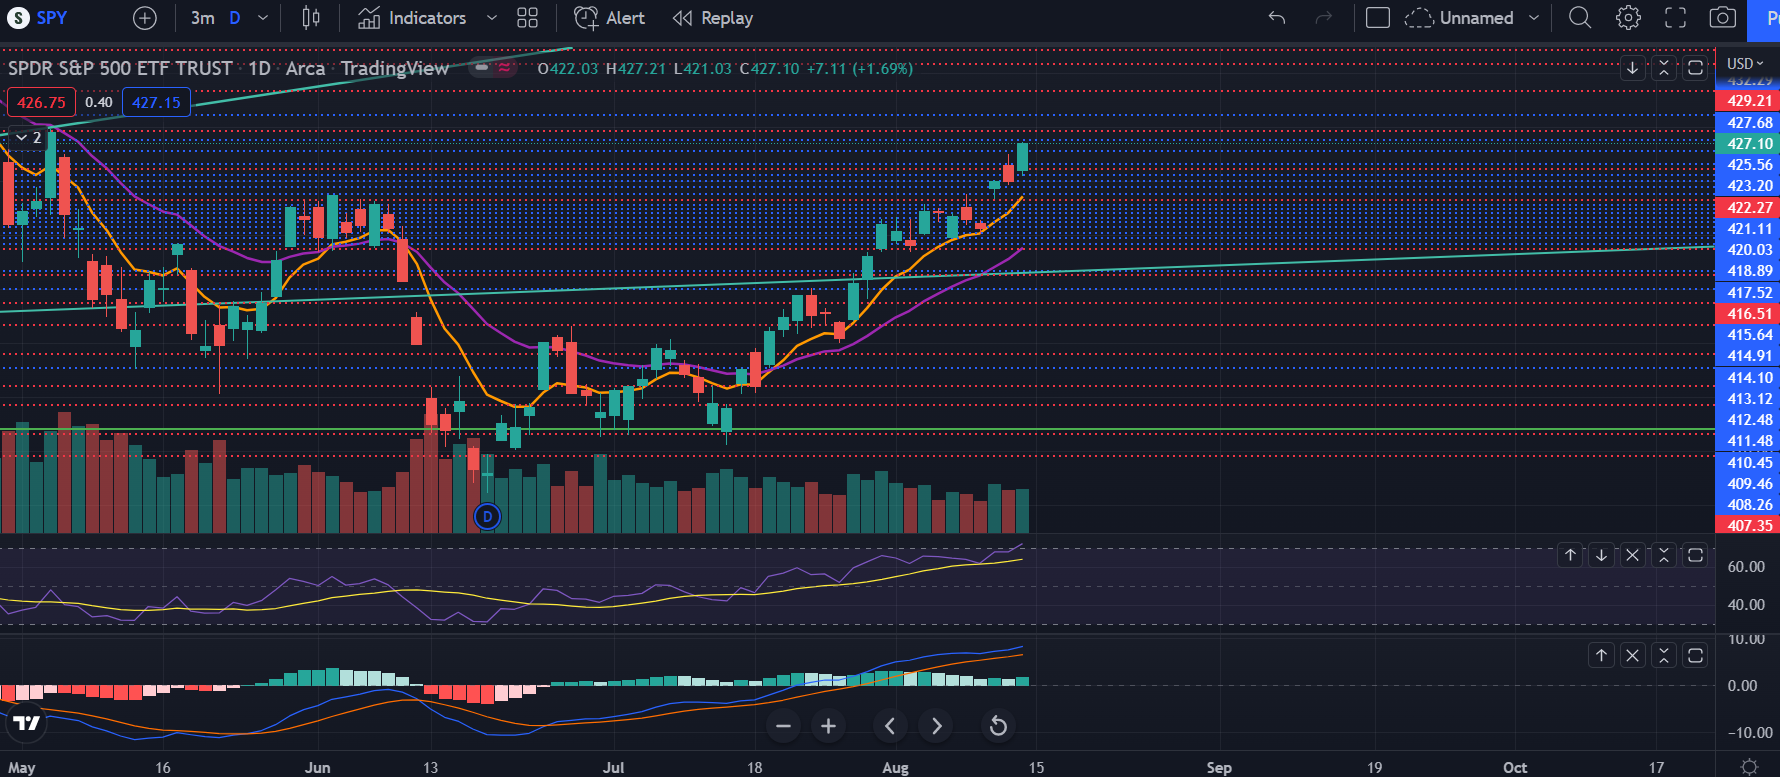
On the daily, we are still above the 8 EMA and trending up. This could just be a minor pullback until we hit the major level of 416, which was the top of the last big rally and the March bottom. It also looks like a bull flag, so it could be just waiting for a move upwards. The RSI also has bounced off the MA during this rally, so it could be that we pullback a little more start to move back up.

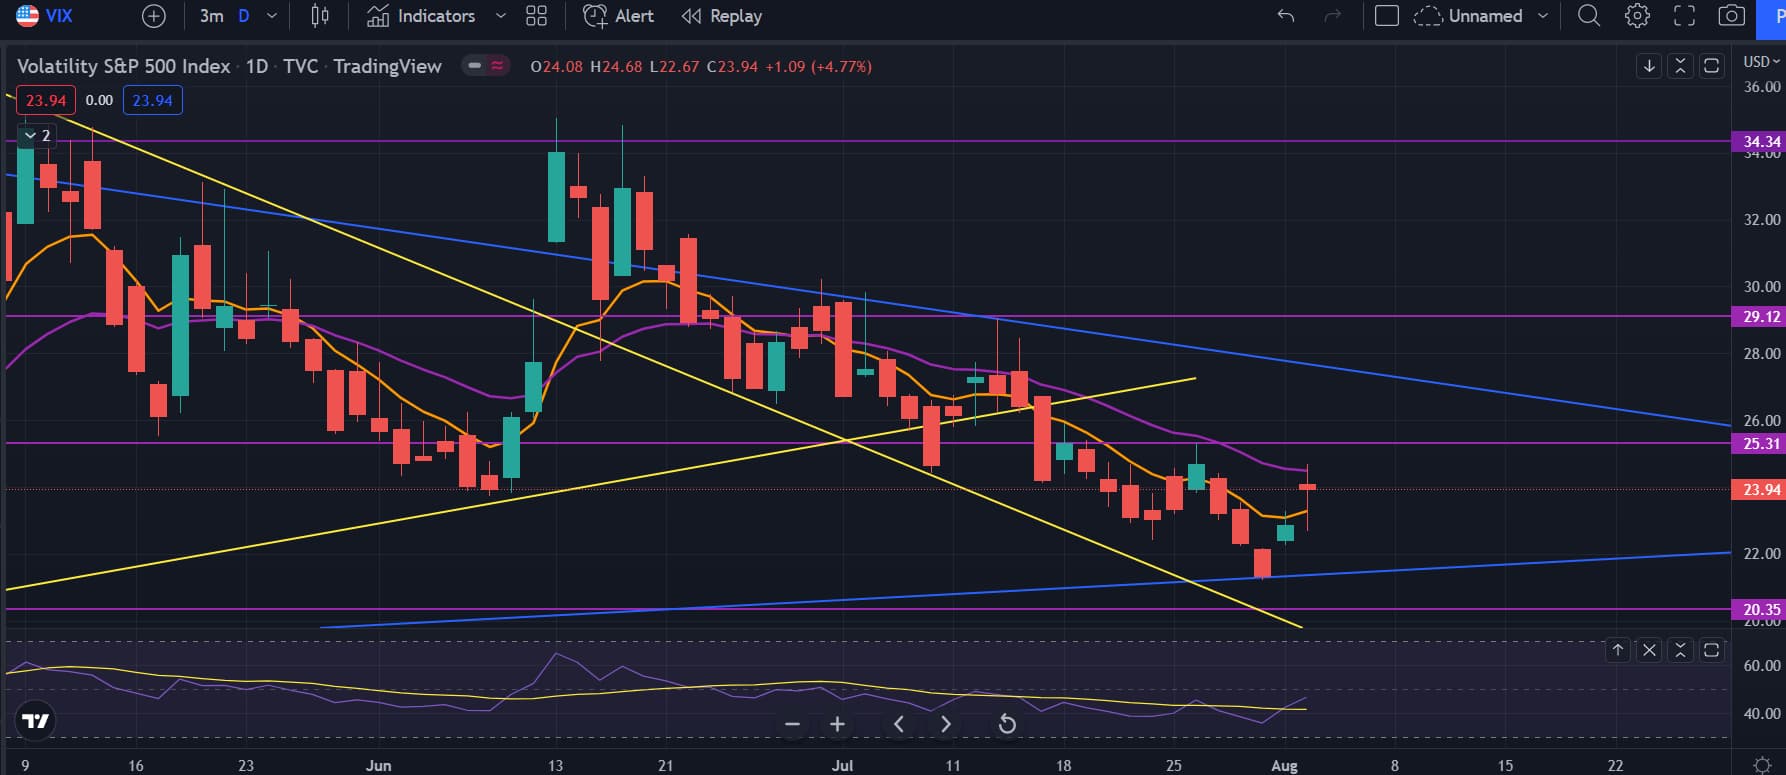
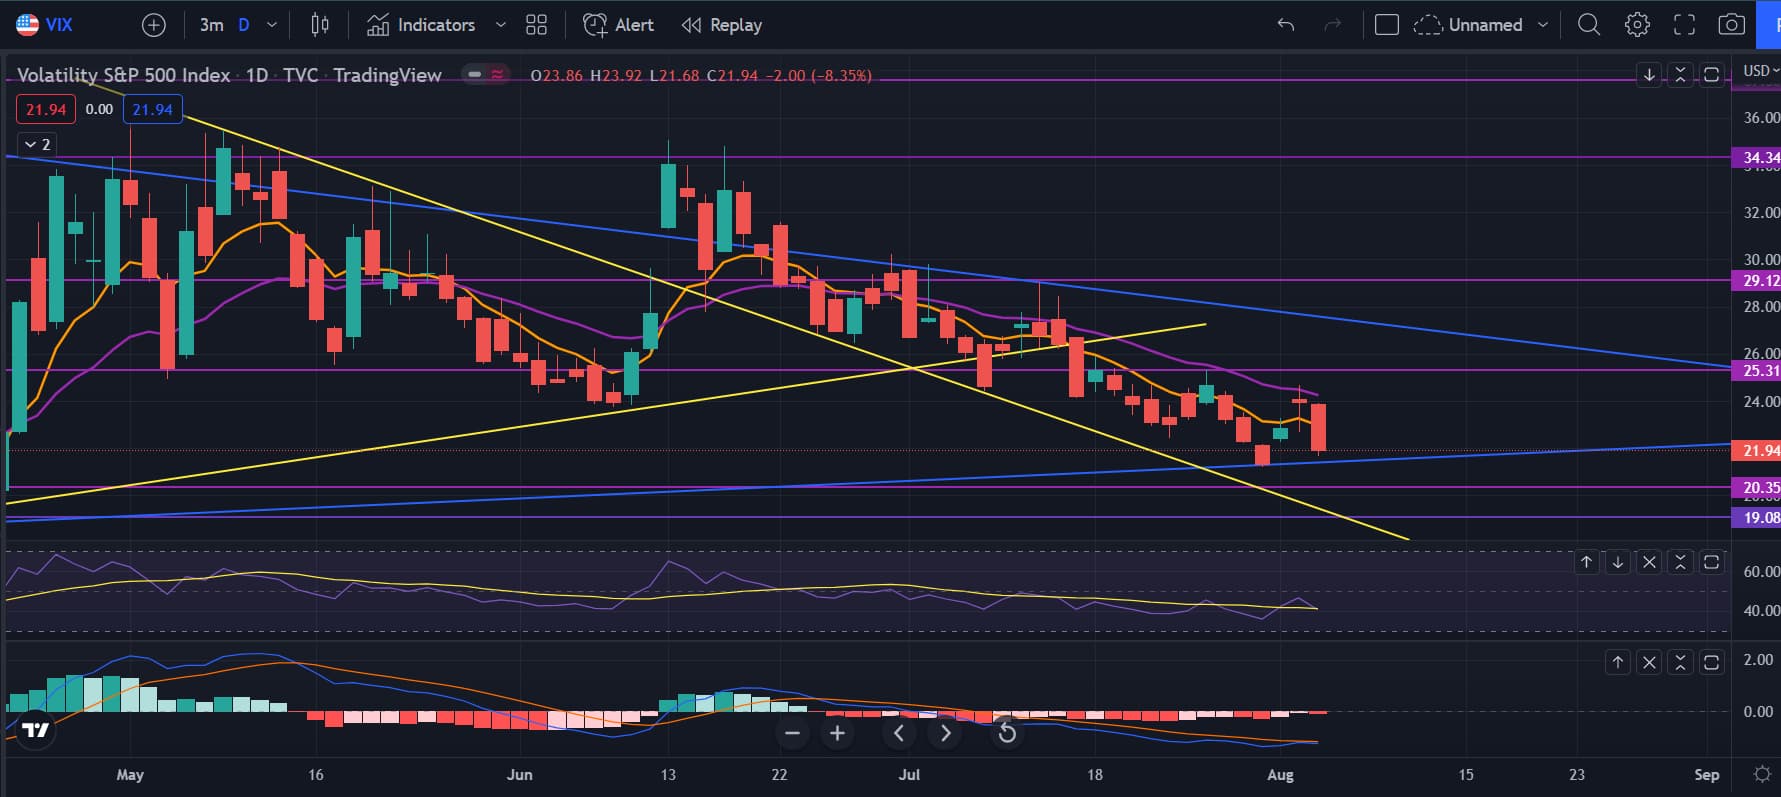
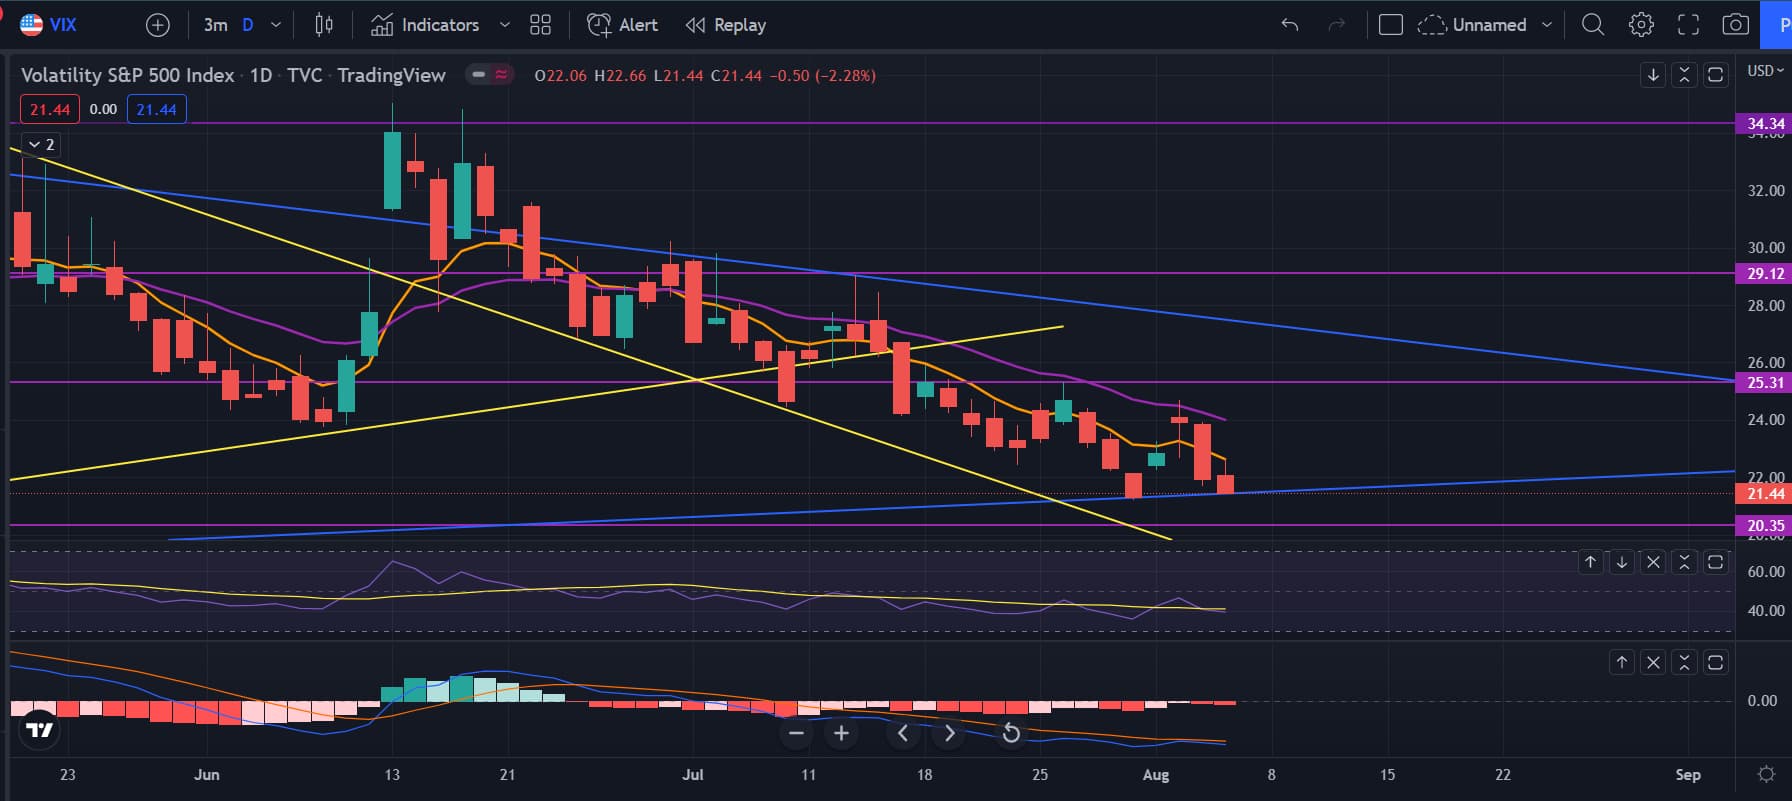
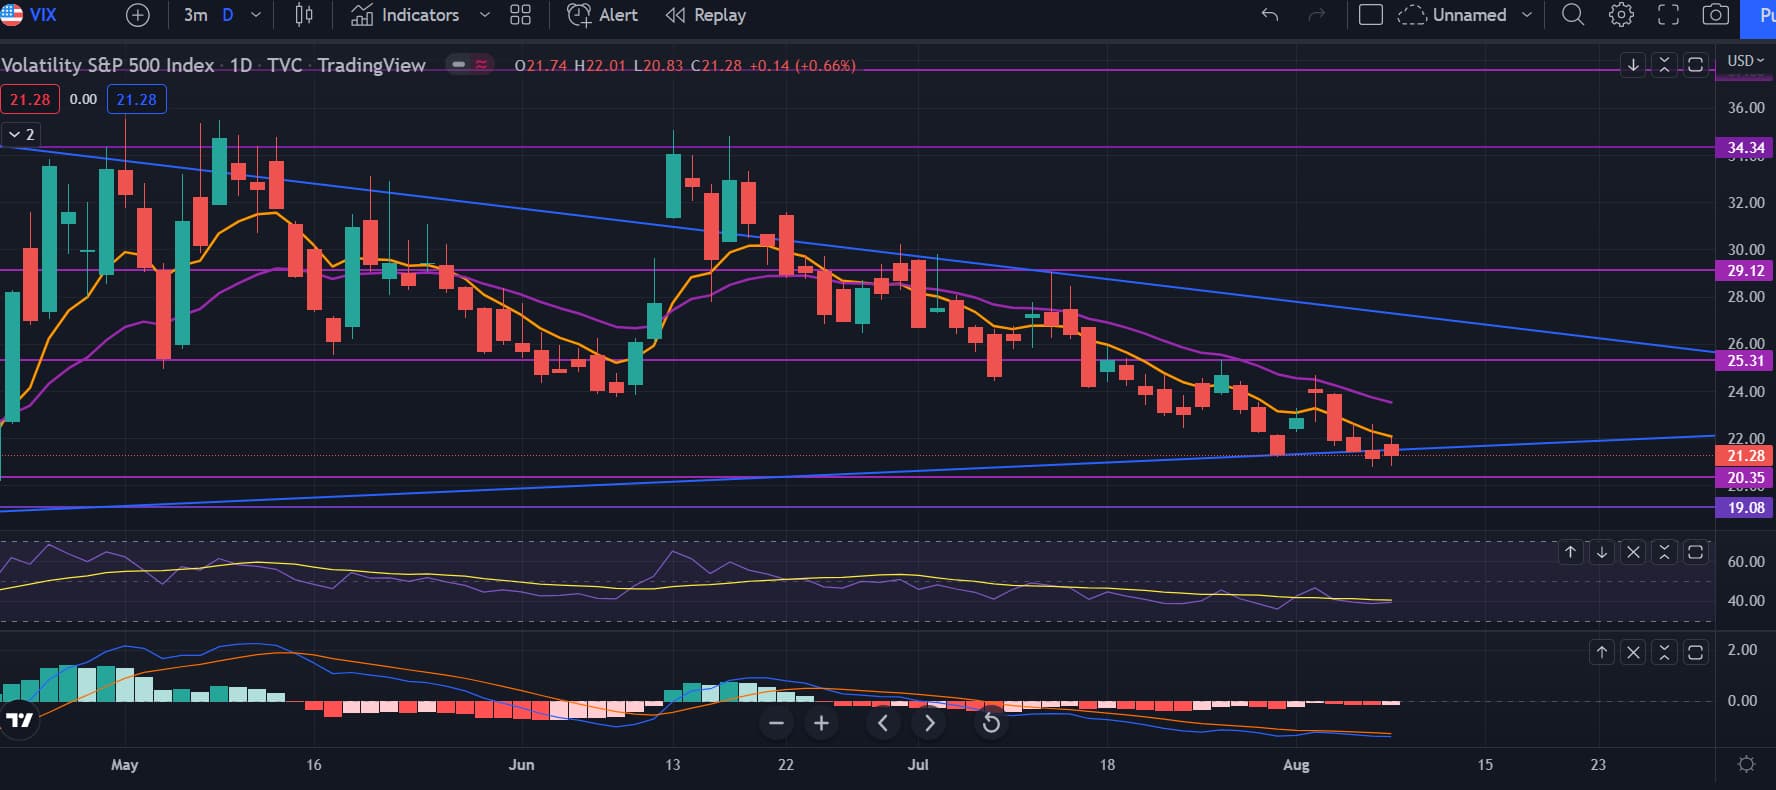
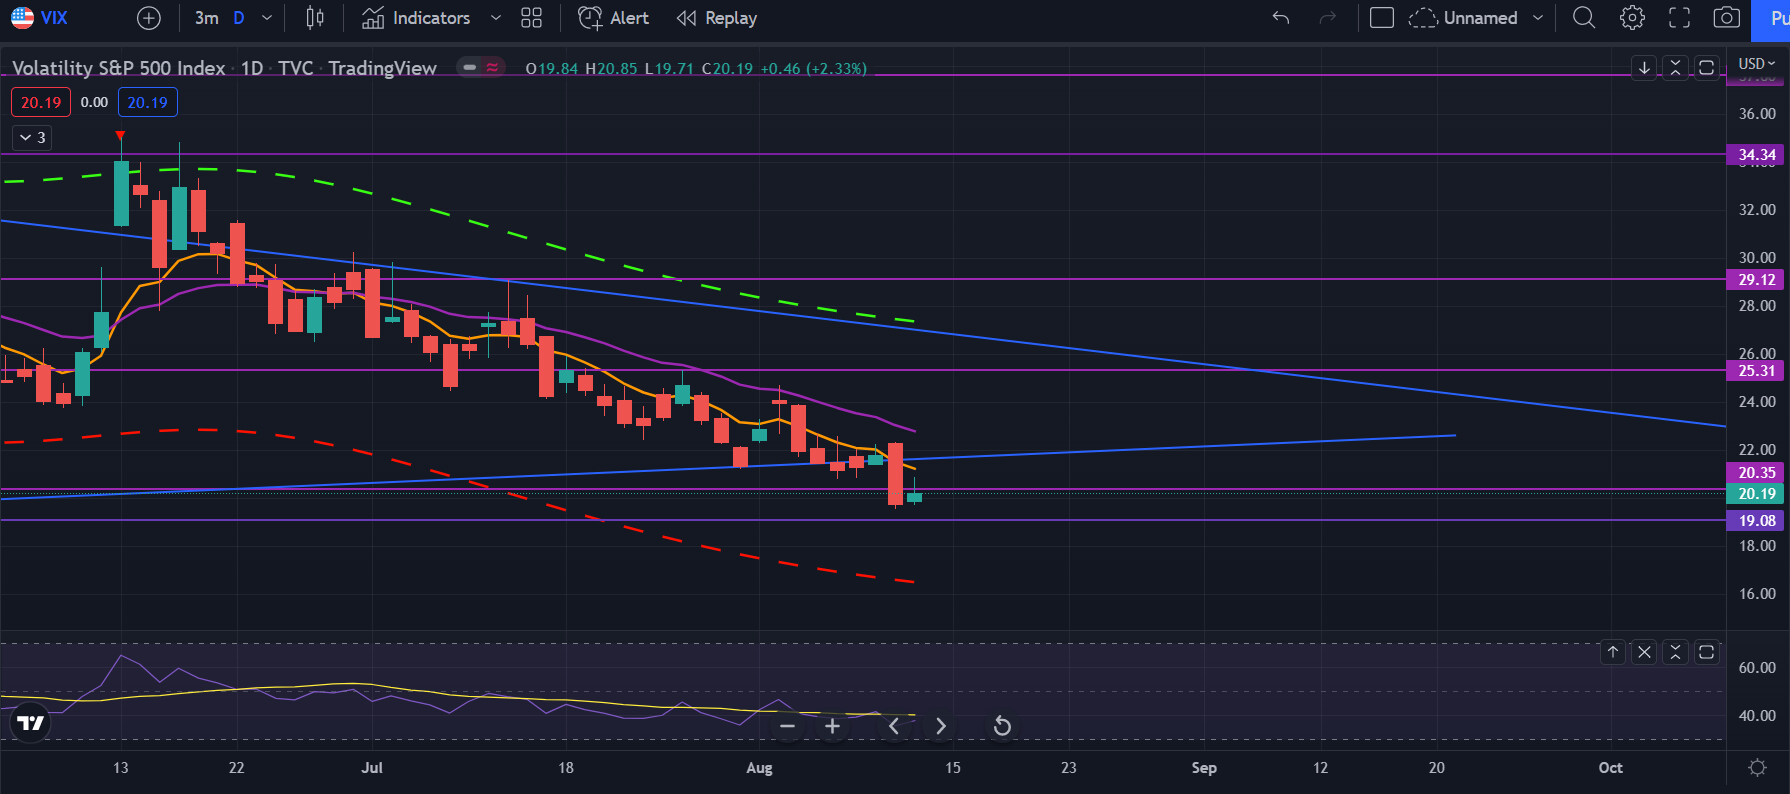
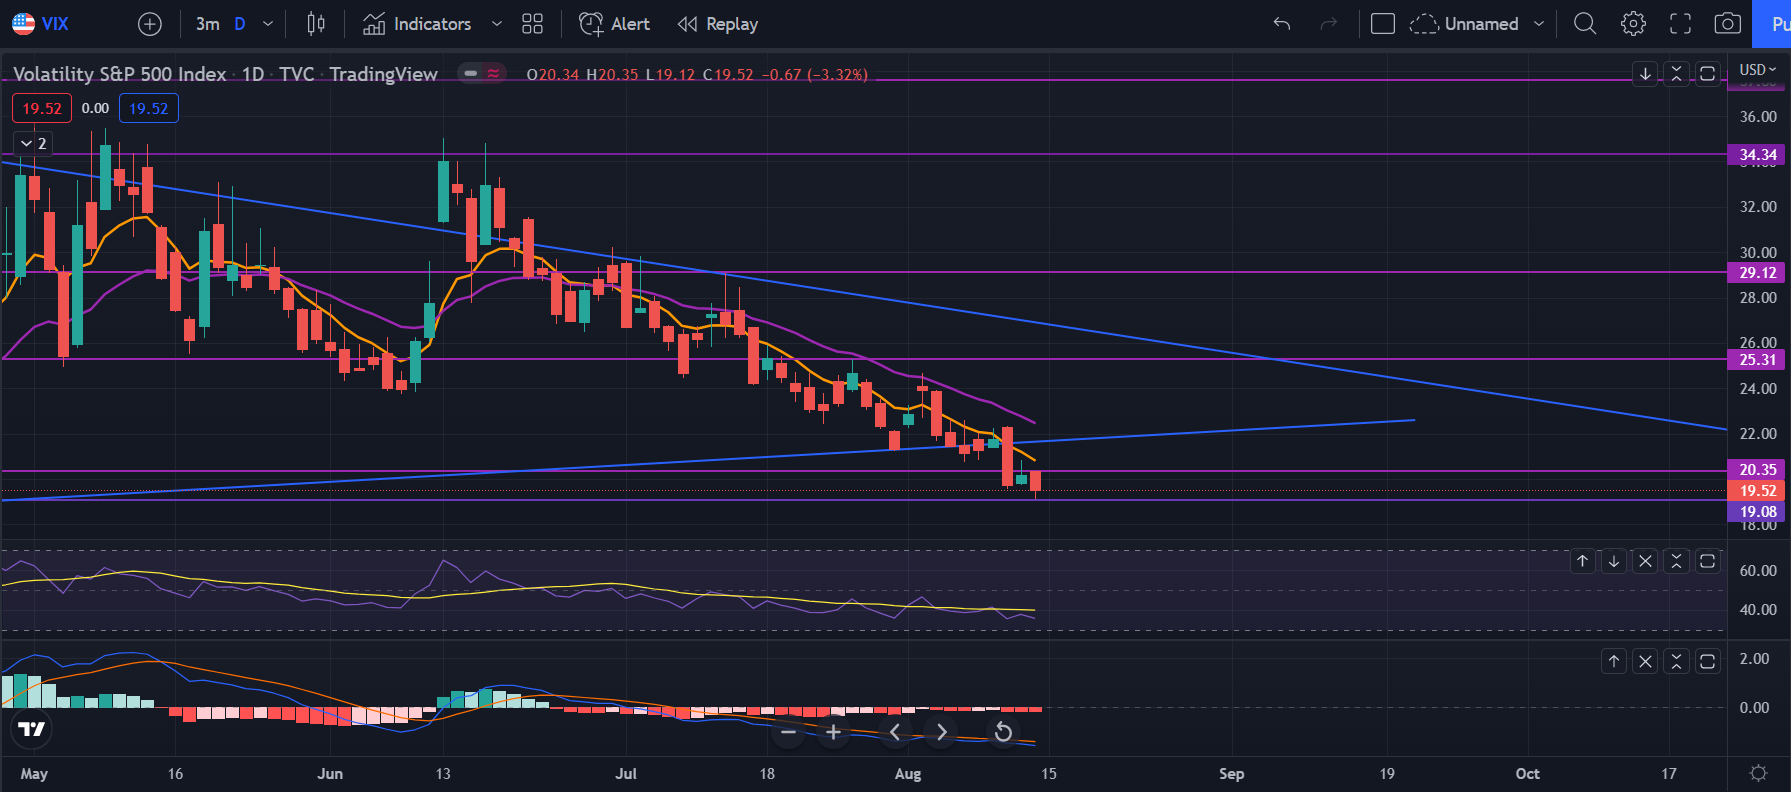
VIX bounced perfectly off the trendline since November. It’s still on a downtrend, but it’s looking like it’s trying to break out of it. If volatility returns, it could be a sign for another big move down. VIX is making it look like markets will move down again, but until it breaks above 25, I won’t be 100% for it.

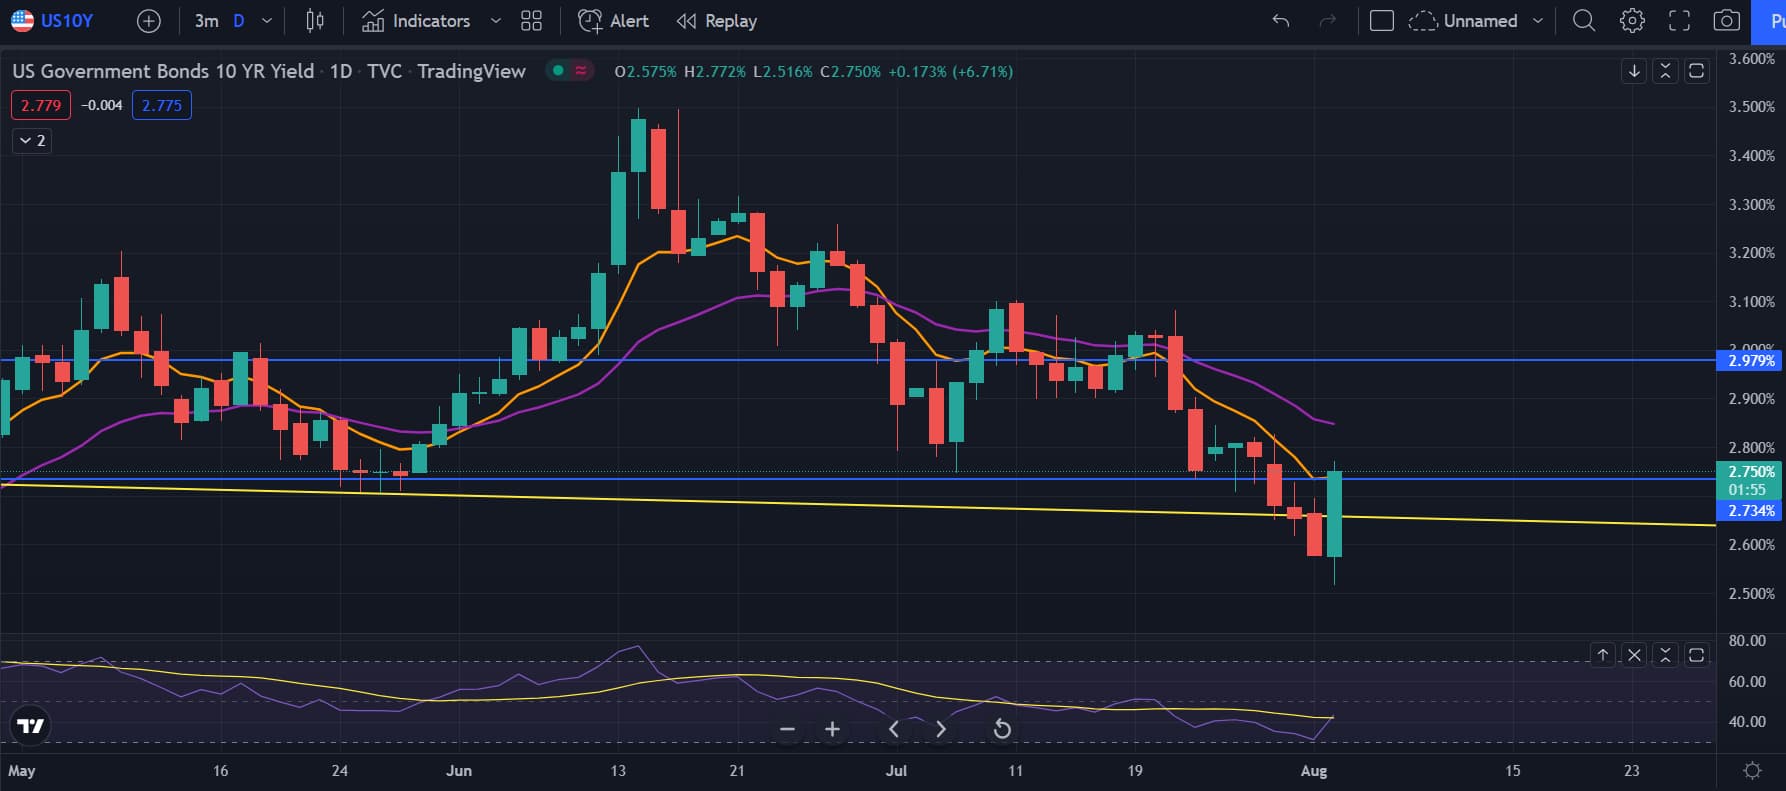
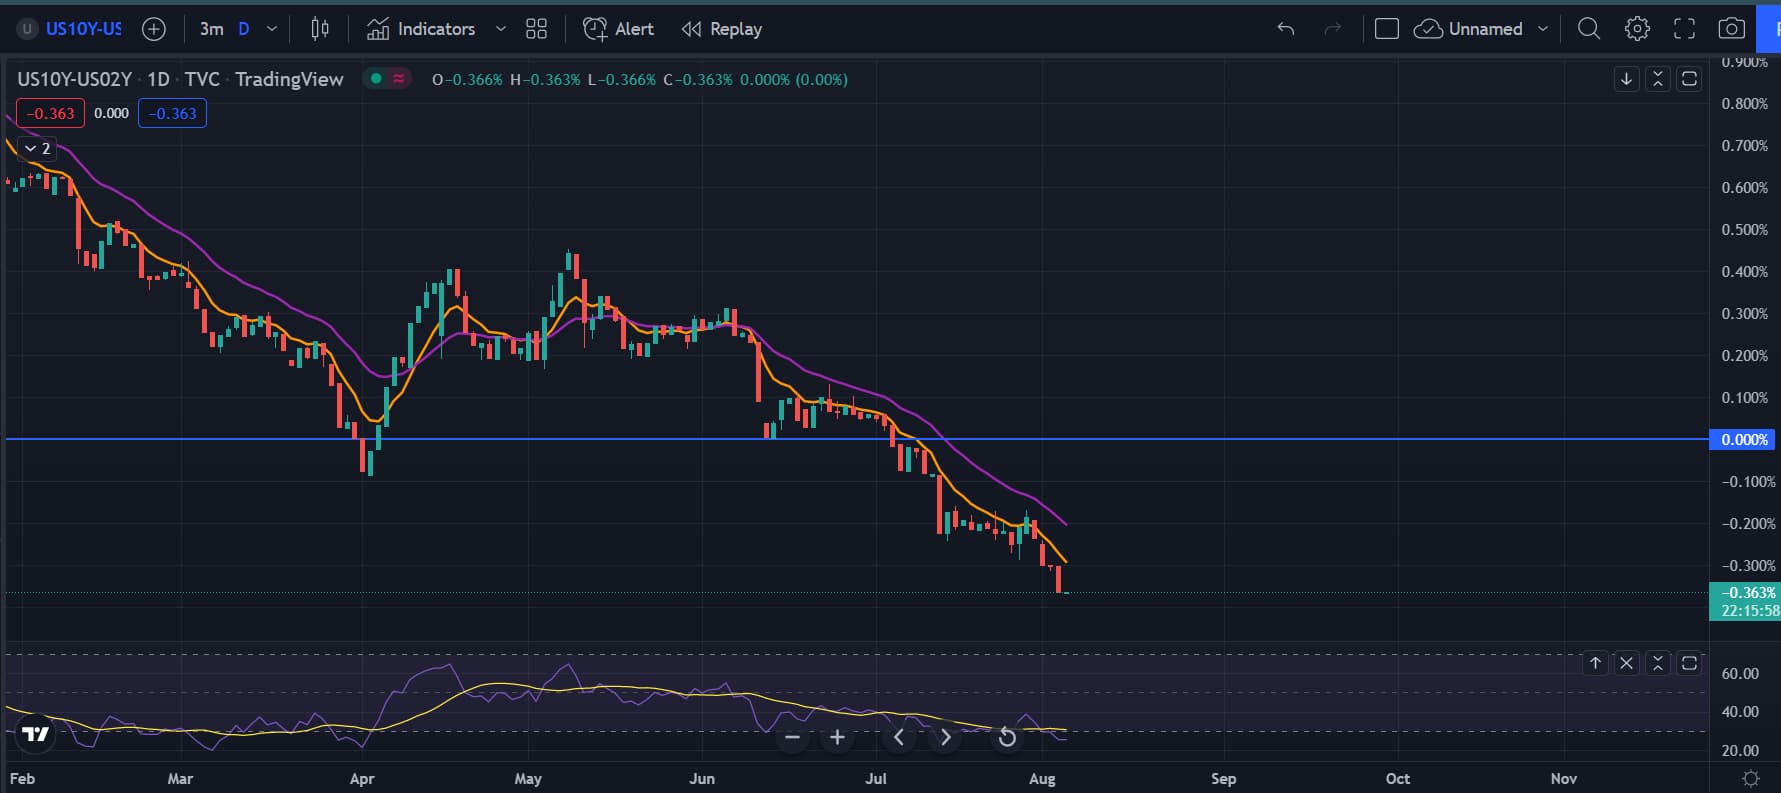
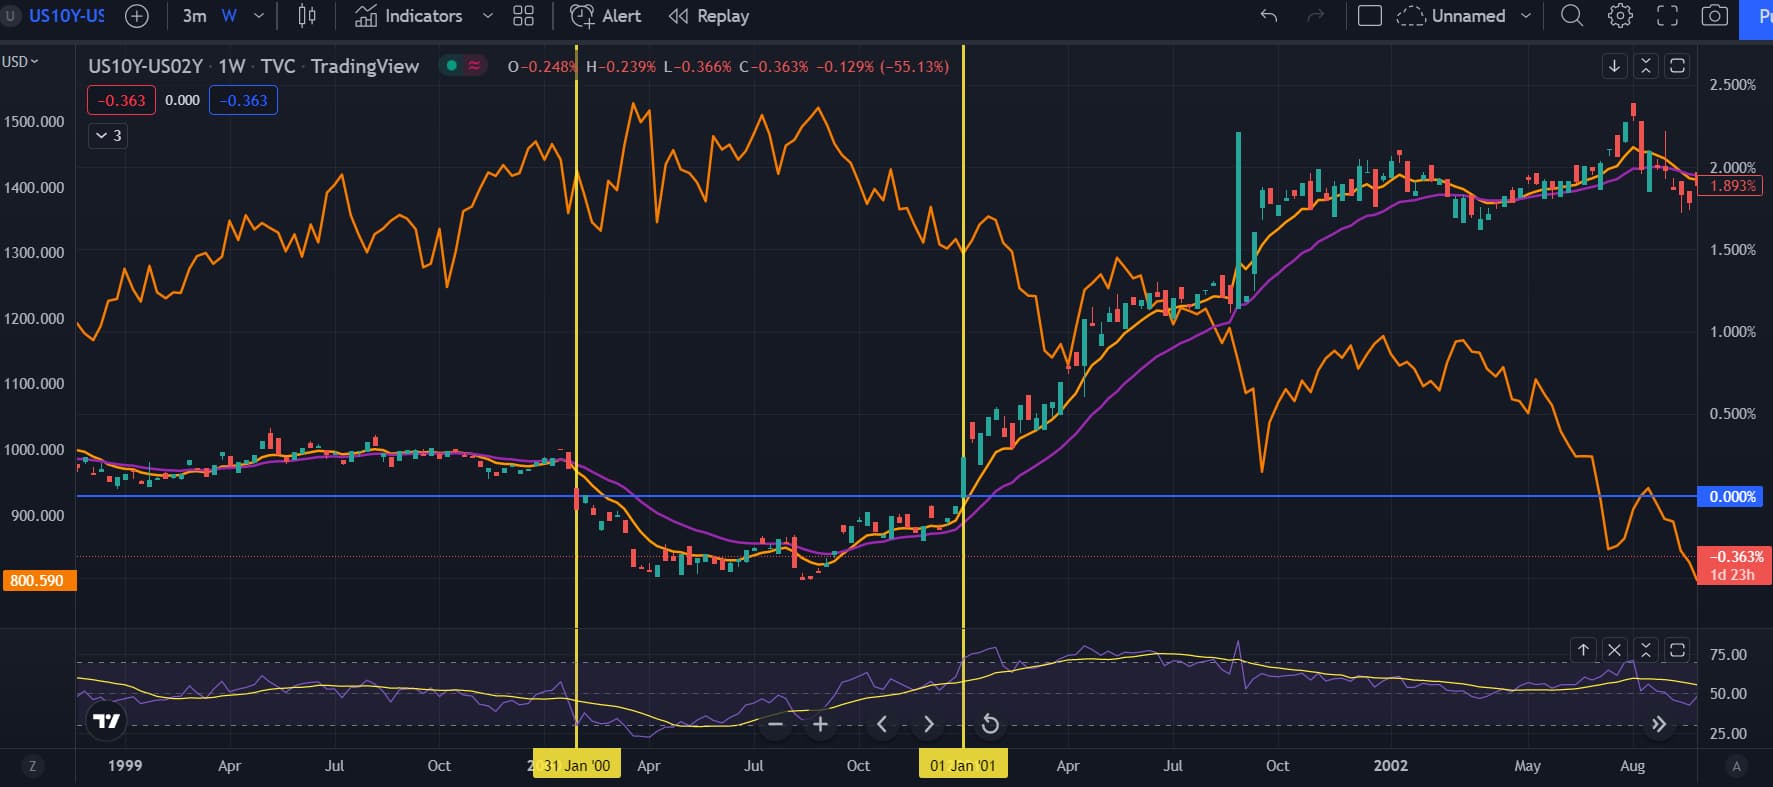
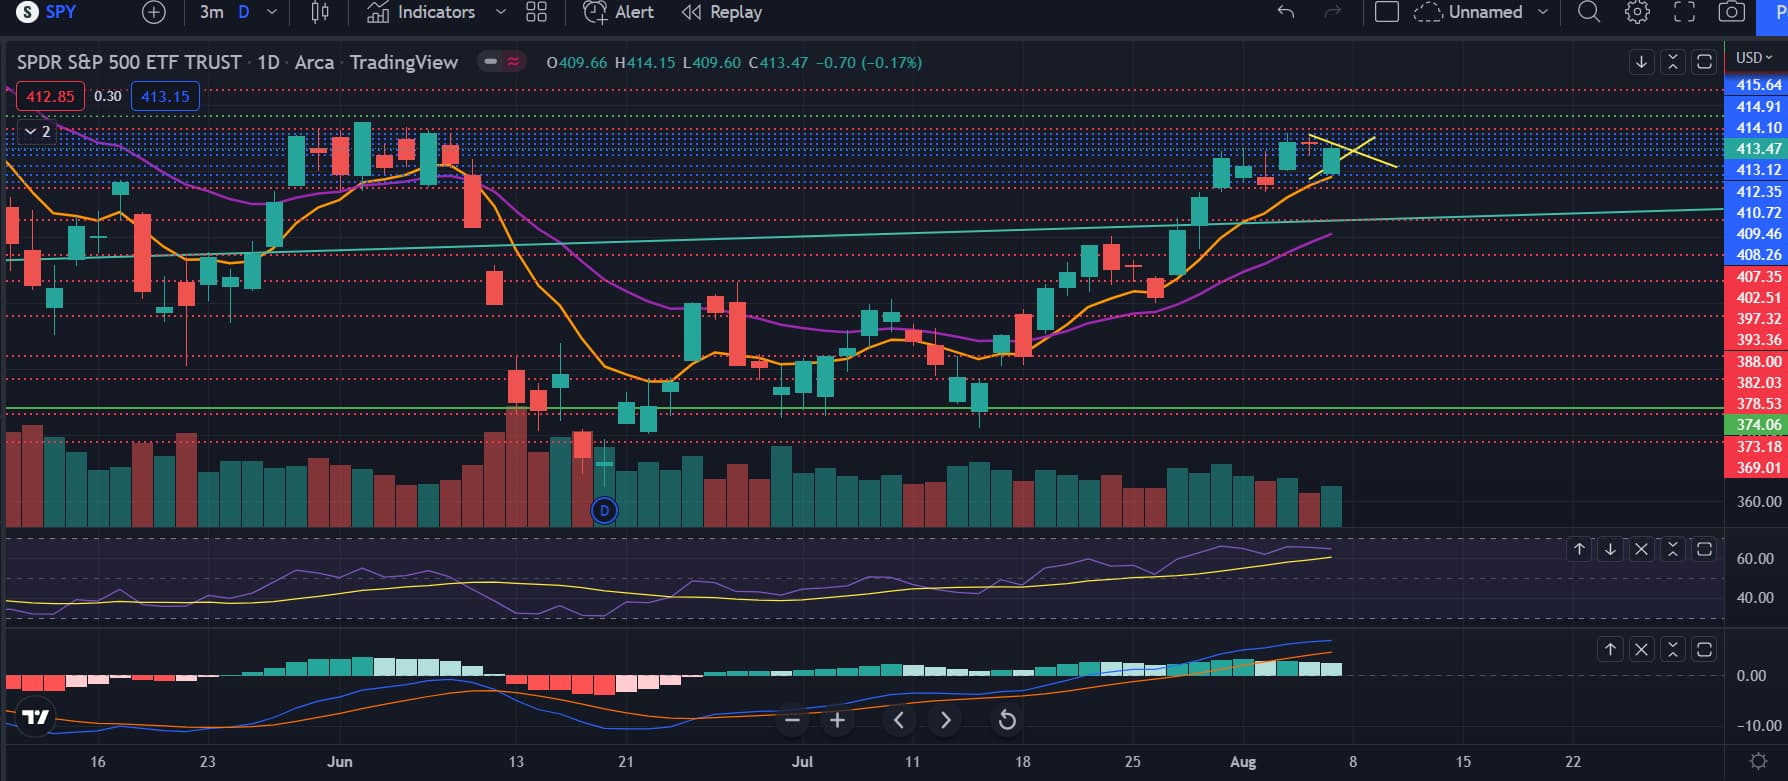
The 10 year yields moved up a lot today. Idk if it was because of fed speaking or something, but this could put more pressure on the markets to move down. Although the 10 year looks like a head and shoulders and just testing the neckline before moving down again. Who knows.

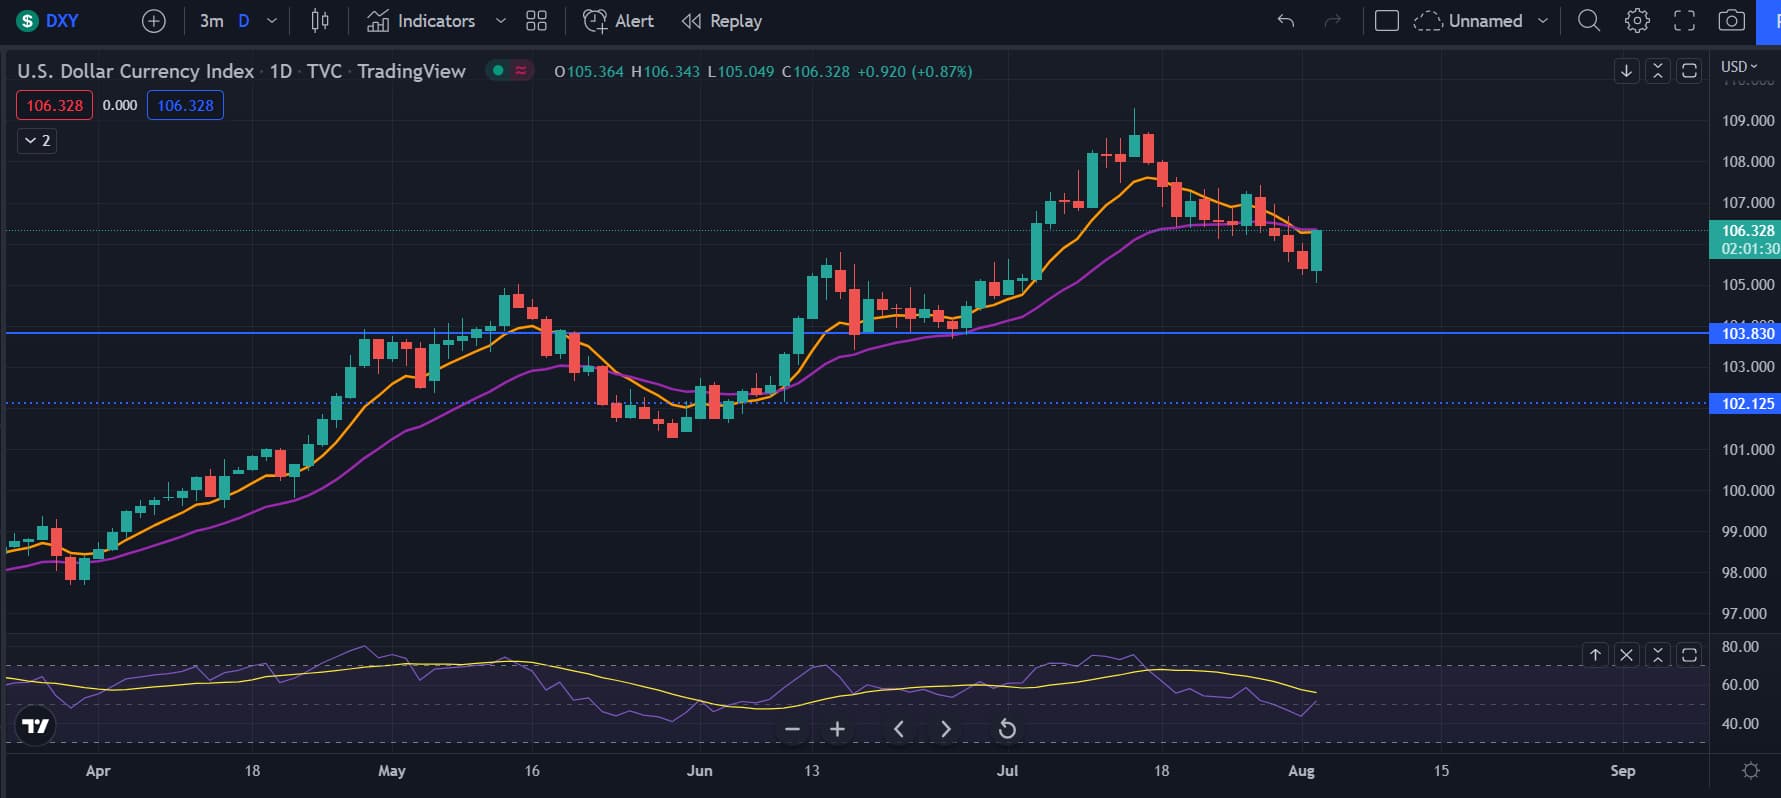
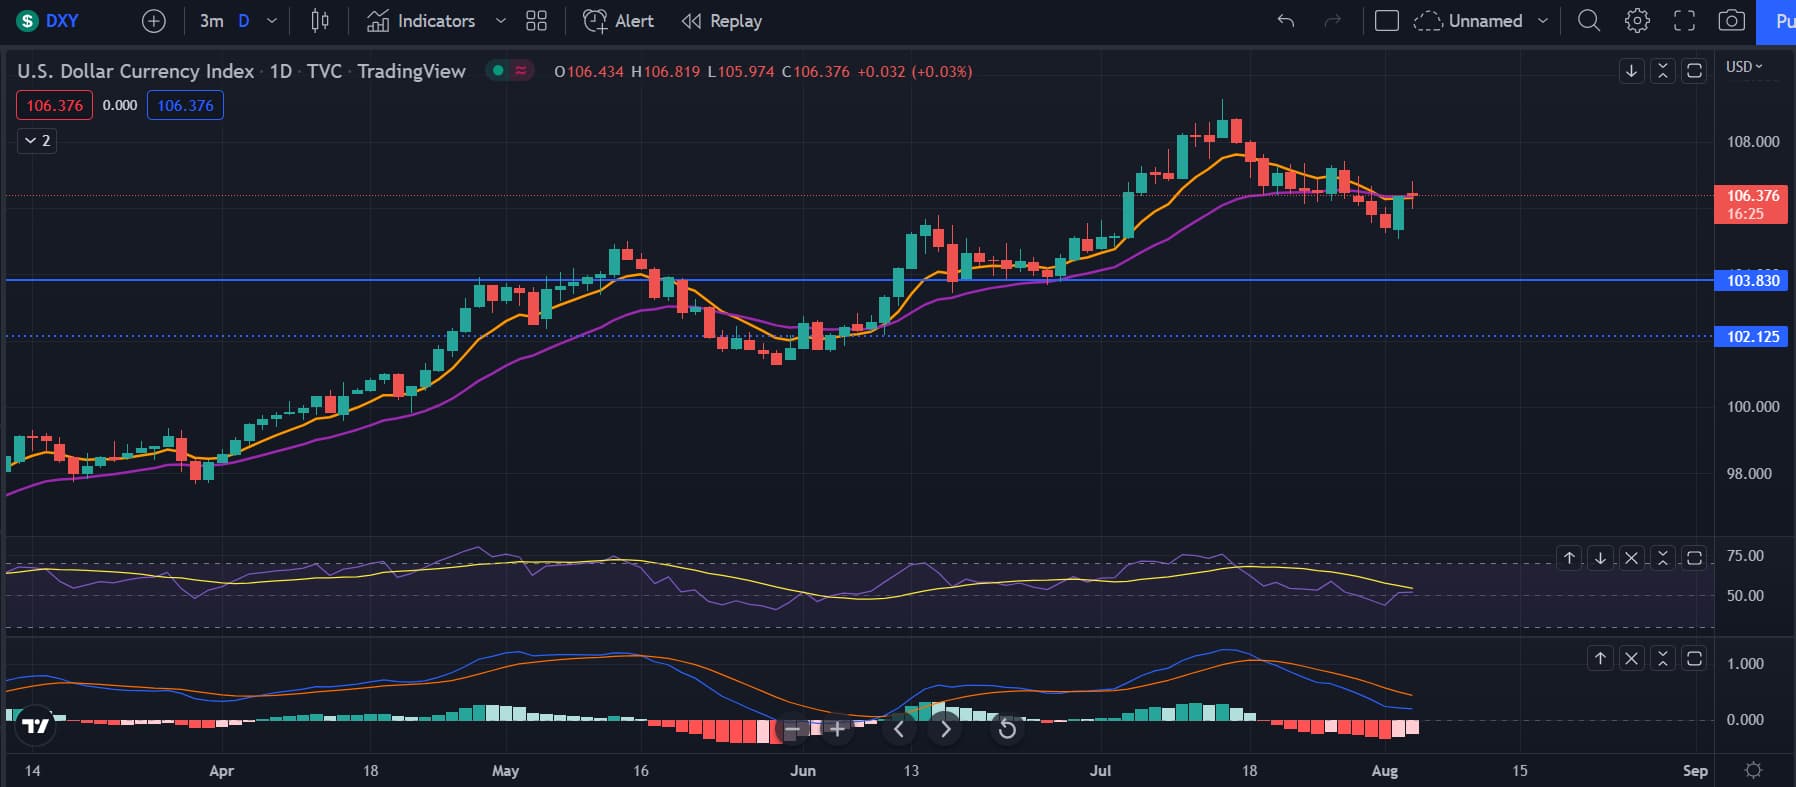
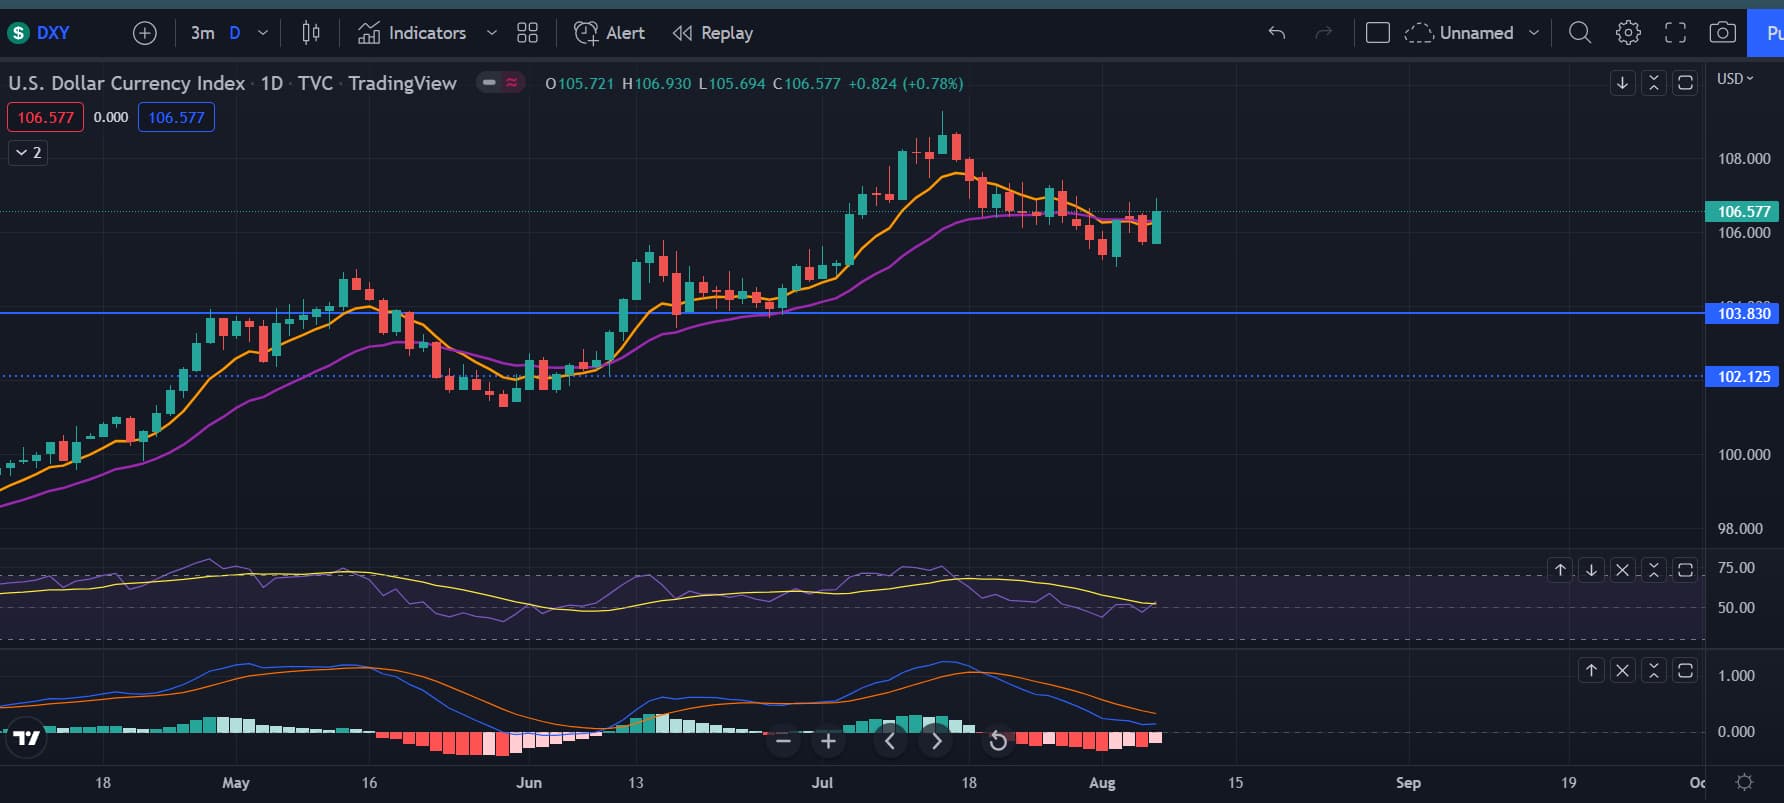
The dollar started to move back up today. If this continues to track up, markets are going to go down. But so far, dollar is still on a small scale downtrend and until we continue to move upwards, it’s too early to start chanting spy to 0.

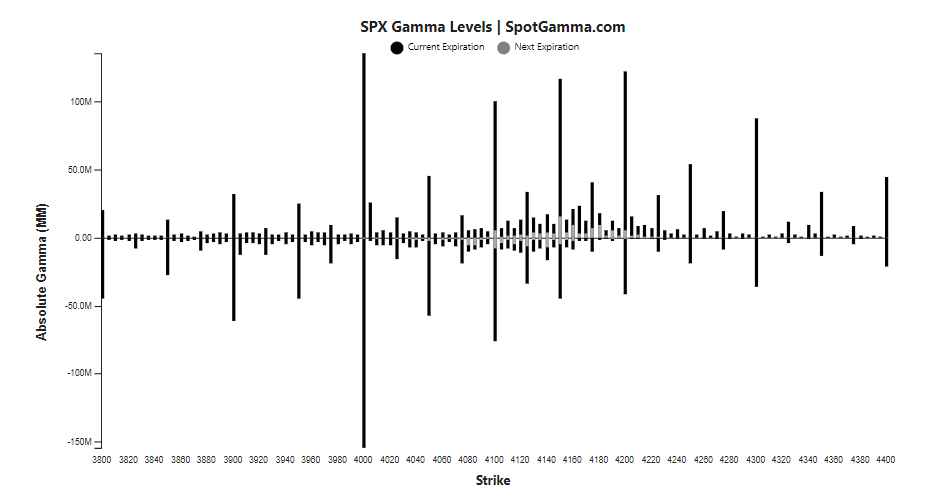
PCC doesn’t show much other than it’s in the middle.

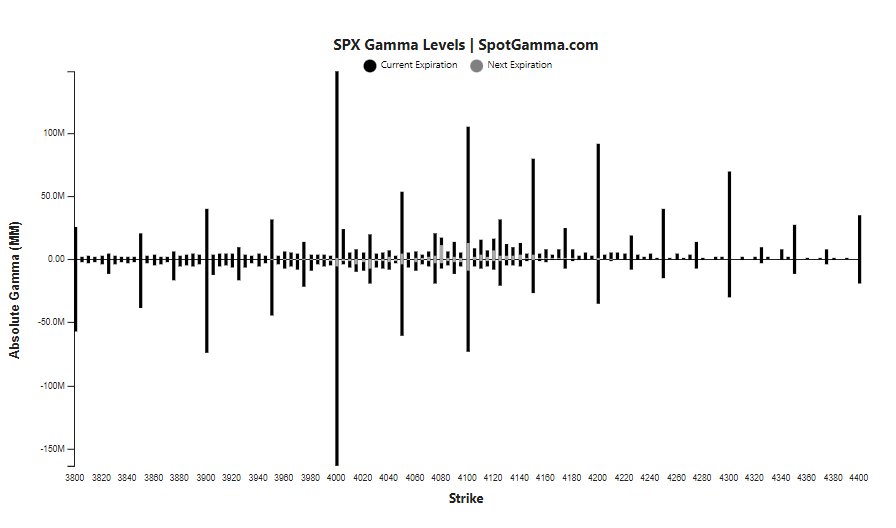
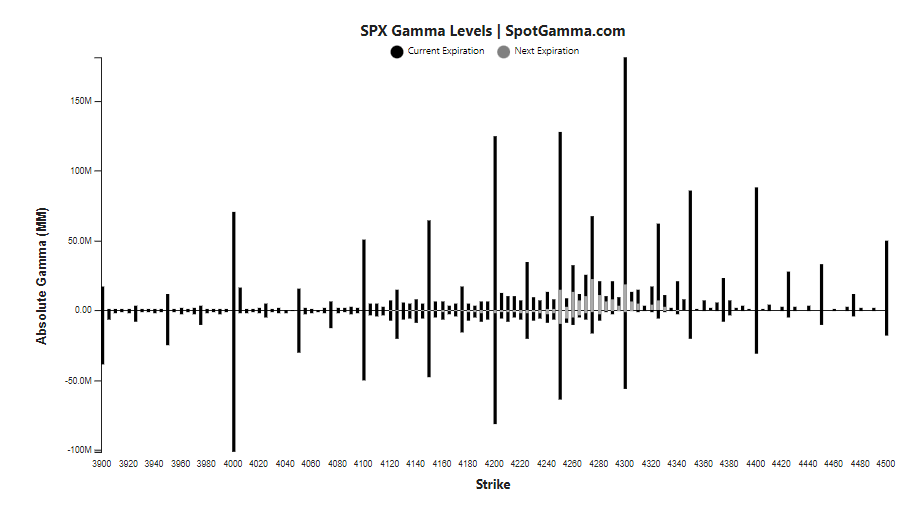
Overall, I think this does seem like a pullback before we move higher because there is no big level here to cause this shit down. I expect us to get the big rejection at 416, but we’ll see. Volume profile shows little volume here so it’s hard for me to believe that we start to reject here, but market does what it wants. I am betting on a big move to the downside to either confirm the June bottom or make another leg lower. Overall, 50/50 for the upcoming week, but if I had the money, I would get monthly puts.

3 Likes

TLDR: I expect us to start to shit down at 416-418 area still, but who knows, maybe this was the top and markets are gonna start to shit from here. I don’t think it’ll be the end of the world and we go to 0, but I do think it’ll be a good drop to around 380 at least.

So SPY on the hourly currently has a triple bearish divergence on both the RSI and MACD. This is very bearish and we’ll see if this was the top. SPY made 3 new highs but the RSI and MACD made lower highs each time. This typically signals that the top is in, but again, most of the volume is at the 416-418 area so I find it hard to believe that we start to shit down here, but we’ll see. But before anyone starts to front run and load up on puts here, this is still a strong uptrend with the RSI looking to bounce off its MA and MACD bouncing off the 0 line. There could be more left in the tank and for now, until we make a lower low, the trend is up.

Now looking at the daily, I put the volume profile here. From what I know, you want to use the levels at the ends of nodes as that’s where volume starts to kick in and cause the big moves. That’s still near the 416 area, although there is a lot of volume right where we are, so we’ll see soon if we top here. Other than that, not much else to say other than a good uptrend with strong momentum still on the daily.

VIX looks like it’s going to retest the uptrend line. It’s had 4 bounces off of it so far with 3 more bounces very near it. It’s a very strong trend line and I either suspect another green day to have us top with the VIX testing the trendline one more time to bounce or we start to bounce here. VIX does point towards incoming volatility, so be careful.

Something to note is that although the markets were very green today, the dollar was barely down. This signals to me that this rally is starting to weaken and people aren’t as convinced of it anymore. Just something to note because if the dollar and the markets go up at the same time, it typically means we’re gonna shit down.

One thing to note is that the bonds are continuing to invert and becoming more inverted rapidly. I know some people will look at this and say that this is the sign that we’re in a recession and SPY is gonna die, but this is actually bullish short term (6-12 months) and very bearish longer term and this basically tells us that we’re going into a recession.

Let’s look at how the yields behaved in the 2008 crash. It inverted and stayed inverted. During the first few weeks of its inversion, markets were volatile and tested the lows before making a topping process by making a new high before entering the recession. When the yields start to uninvert and rapidly climb up, that’s typically the sign that the recession is here.

Another recession was the 2000. Again here the yields were inverted and stayed inverted. During the first few weeks, markets were volatile and tested the lows before beginning the topping process and making new highs or testing new highs. Then when yields started to climb up higher and uninvert, the recession came and took a shit in everyone’s mouth.

Overall, yields being inverted should be seen as bullish short term and bearish longer term. This is one of the reasons why I think we’ll make a new high or test the high before heading into a recession, but we’ll see.

In conclusion, SPY does look like it’s starting to form a top, but we’ll see when it does. The next low will be critical at determining if we have seen the bottom or not. If it’s a higher low, then we should start to see some good rallies, but if not, well ig more painful markets incoming.

8 Likes

Thanks @Yongsooyuk6 , great thread, as always! A few data points to supplement your thoughts.

First, SPX gamma levels continue to grow well into 4200, and even those at 4300 are starting to take shape.

Option flows in the markets are also decidedly call-sided:

SPY’s gone through the 50 and 100 SMA, and will probably test 200 SMA

All the technical and structural stuff says markets are going higher for a while yet.

Could SPX 4300 by opex, and 4400 by month end really happen? :upside_down_face:

7 Likes

Nothing really new to say other than chop and possibly more chop upcoming.

SPY on the hourly was just wick city and bouncing off the 21 EMA pretty well. Overall just seems like consolidation before the next big move. Not much to say other than be careful out there.

SPY on the daily has a doji, but still in the overall uptrend. Again, I’m looking at the big level at 416-418 to see the rejection, but we’ll see.

VIX is pointing towards that we are going to see stocks starting to go into a downturn as we’re back to the major uptrend line. If VIX bounces here again, I expect us to start to pullback finally, unless this trendline breaks and we just go dicks up into 500.

Screenshot (649)

One reason why I kinda am expecting sideways chop for a bit is the seasonality chart. So far this year, it’s worked out pretty well. In the 2nd year new democratic president years, it seems like SPY tends to go right starting in august before making the next leg down heading into September. Will this play out? Whomst the fucketh knows. But just something to look our for. Also adding onto this potential case is that the last time we were in this area, we had over a week of just sideways trading. So this could just be another one of that.

Overall, I’m still expecting us to start to roll over, I just don’t know when. VIX is pointing towards it, although the dollar and yields are pointing towards little more upside. Be careful and if you’re not sure of the movements, just take a nap or be a productive member or society instead of getting stopped out on trades.

1 Like

Call gamma is even more juiced up.

Yet unemployment rate inched a wee bit lower, and nonfarm payrolls is actually up handily. One implication of which is Fed needs to keep tightening for much longer, because

Should make for an interesting day.

2 Likes

So @Kevin asked me to throw some thoughts in here that I dumped in another thread. I’m going to paste that thought and expand on it a little.

"Part 2.

This is really my thesis for buying alot of the shit I’m buying rite now.

I don’t think this shit is done, the fed decided to keep everything status quo for their little vaca in August. I also kinda feel everyone including myself was probably way over leveraged on the downside recently. I also read some shit on Twitter about MM being net long, I don’t have the time to validate that info but I’m throwing it in there anyway. SPY broke a pretty big trend line then decided to rip people’s faces off and is consolidating in this 410-417 range. As long as this consolidation continues, shit stocks go up."

Twitter guy
https://mobile.twitter.com/TradersParadise?ref_src=twsrc^google|twcamp^serp|twgr^author

So I think the current trend will continue next week and hopefully through the third week of August. What happens after is the question, people way more intelligent than myself and the macro side of my thoughts tell me SPY is headed back down but the feels are a little different.

Follow me on this,

SPY is down a decent amount from ATH not sure what the % deviation from the 200ma on the daily is, I do need to check that.

Your mega caps split, all the “important” ones. I don’t see these tickets loosing 20% of their value from here.

Shit blew up and held gains for days. Something that hasn’t happened for quite a while. Not even in late March did shit hold. Pharma, IPO’s, spac’s, fucking china, and now meme’s coming up the rear.

If you believe in TA or not alot of tickets broke some pretty long trendlines.

I’m still stuck in traffic in the morning on the freeway.

There’s a few thoughts I’m missing… Something about projecting shitty earnings and maybe something else.

All of this leads me to believe as long as more crazy shit doesn’t happen we may have seen a bottom and this was just a bear rally (not sure if that’s the correct term) in a inconceivable bull market. I mean if you zoom out far enough it’s always a bull market rite.

Or everything is popping off because we’ve hit a top after a hard run. Time will tell.

Sry for the vomit again. I don’t get out much.

5 Likes

I think it is a big bear market rally but if you look at the CPI projection thread it is a strong possibility we see a big sell off as fear worsens heading into a possible higher CPI reading (as unemployment has gone down and not up) that will bring us out of this bear rally and back below the trend lines. Just my 2 cents and something to watch heading into Wednesday.

3 Likes

TLDR: I personally think we’ll have a dump incoming soon, but right now, it’s pretty 50/50. We’ll see how CPI makes markets go and looking at the CPI Thread, seems like we should get a dump incoming for the days preceeding CPI. I think inflation has peaked but we’ll see.

On the hourly, SPY seems like it’s in a triangle. We’ll see which way it breaks out, but I’m leaning towards to the upside honestly. RSI has bounced off the 50 range multiple times this consolidation and MACD has bounced off the 0 line the last couple times. Based on this and where we are right now, I think we go up a little more. Another reason why I think up is because we broke below the 8/21 EMA and now back up above. We’ll see though.

On the daily, we’re just in a consolidation range and bouncing off the 8 EMA. The RSI is looking strong although the momentum is starting to fade. We’ll see if we form a bearish divergence on the RSI if we go higher. Overall, just looks like the same shit we saw at the beginning of June and I think CPI will make us break out of this range.

On the weekly, SPY is looking strong. But we are at the 50 line on the RSI and this is around the level where we turned around last time and if we are in a bear market, we should turn down here again and stay below the 50 level. MACD is showing bullish momentum which is good and although it’s not on here, SPY is above the 21 EMA which is huge. But we have to continue to stay above and not have a fake breakout like in March. One thing I’m looking at is if this is just a bear market rally. If we continue to go up, I want to see how SPY acts around the weekly 50 MA. If we get rejected straight away, I think that we’re not going to make new highs and continue to make new lows. If we break the 50 MA, I think that we’re going to make new highs before heading into a crash.

So VIX looks like it broke the long term trendline that has stood strong for a while now. We’ll see if it continues to trend lower, but it’s in a downtrends wedge which is bullish and primed for a breakout. I personally think volatility will return to the markets soon, but we’ll see when. VIX is showing that we should get more downside soon though.

So the 10 year yields looks like it’s starting to trend back up. Will this put more pressure on stocks and cause another leg down or is this just a random green day. Right now, seems like the 10 year is trying to go back into an uptrend.

The inversion is becoming more inverted, which could mean that more volatility is incoming and in my previous update, this is around the time of the inversion where markets go down hard before coming back up. We’ll see if this happens again and we get a good leg lower.

So the dollar went up which is bearish for stocks. So far, it seems like the dollar and the 10 year yields are starting to go back into an uptrend which should theoretically put pressure on stocks to go into a downtrend.

Now PCC is pointing towards a top too. We’re at levels where tops have formed before during this year. Will this mark the top again? We’ll see.

Now looking at the stocks above the 50 day moving average, we are also at levels where we start to pullback in the markets. So we’ll see how accurate these signals are.

Overall, it does seem like every indicator is pointing towards bearish. We’ll see if it plays out and how it plays out. Maybe we go hit 416 and then form a big bearish divergence to go down. Because most of my signals are pointing towards bearish, I think it’s a good r/r for puts or shorts, but we are in an uptrend so it’s better to make sure we are in a downtrend before going against the trend. I personally think that inflation has peaked, whether that’ll show in this CPI report will remain to be seen though. If CPI has peaked and does show, it should make markets go dicks up a fuck ton, although that’s going against the signals rn calling for a pretty big downside. Maybe these next 2 days we get huge red days, get a green day on CPI and a couple green the next few days before heading down lower. We’ll see, but leading into CPI, I’m leaning towards some green hourly candles before we start to go down hard.

5 Likes

Here’s the SPX gamma levels to start off the week:

The call strikes continue to grow, but interestingly, the SPX 4000 puts have also grown quite a bit. Reflects the overall sense of this being a bear market rally which has the risk of coming down soon.

Vol trigger is 4090. Since we’re above that, we should expect less volatility.

CPI on Wed is obviously the big event, but VIX is still very calm, so seems like market is not seeing much uncertainty around it.

Barring something bad happening in the big bad world, we should keep drifting up for the time being.

3 Likes

TLDR: Right now, it’s looking like the bearish downside is going to play out, but CPI is Wednesday so TA doesn’t really mean shit.

On the hourly chart, there is now a triple bearish divergence. On each of the 3 peaks, the RSI and MACD have made lower highs. This is extremely bearish and showing that we will have downside, but who knows how far. It does seem like it’s starting to play out now, but we’ll see.

So on the daily, we’re basically still ranging which is annoying. I think we’ll either end up near the 8 EMA tomorrow and have a red day, especially since we’re going into CPI and that usually leads into a sell off. The daily still shows an uptrend with the hourly showing the start of a downtrend. We’ll see how it plays out.

VIX is still near the trendline and holding onto the trendline for its dear life. We’ll see if it can fully break it or bounce off causing volatility to enter the markets. I am betting on volatility entering the markets again, but we’ll see.

There’s nothing other noteworthy to see other than the dollar is holding up pretty well. Looks like there is still fear and the dollar might be pointing towards downside because of how well it’s holding up and making higher highs and higher lows on the smaller timeframes.

Overall, things are leaning more towards the bearish side, but we’ll see if it even plays out. CPI is Wednesday so that’ll be the main mover, not TA. Just be careful, and it’s probably a good idea to stay out of SPY until like 10-11am on Wednesday when news comes out and is digested.

4 Likes

TA is useless just look out for CPI data tomorrow. What you should be focused on is the core inflation since that’s what the fed is looking out for.

Basically if Core inflation rate comes in above 6.1%, be prepared for a shitter. Basically if inflation hits expectations or beats, be prepared for some massive short squeeze green day tomorrow. Bc if inflation is showing a peak, then markets are gonna start to price in peak inflation and the fed being more dovish. If any of these numbers comes in hot, well shit put szn again.

3 Likes

After the big important numbers, we will get to hear the immediate reaction from two fed doves: Evans and Kashkari, at 11 AM EST and 2 PM EST respectively.

TLDR: Potentially SPY is starting to peak for a good pullback, but so far it’s a huge uptrend so don’t be retarded and full port into puts. I think NI said something about options being bullish and there’s a good tailwind to get to 4300.

SPY on the hourly is bouncing off the 21 EMA right now after being overextended. We’ll see if we can break it and start to track lower. Right now, it’s 50/50 whether or not SPY will shit or not.

SPY on the daily is looking strong still as we’re above above the 8/21 EMA with the RSI holding strong. Although it’s nearing the levels were we do see tops. Still, the 8 EMA has been a strong support with 21 EMA being a stronger support. Lots of supports for bears now.

VIX broke the uptrend line and still looking weak. Who knows when VIX will rise, but it’s strange seeing it be so low.

Other things to note is that the 10 year yields are going up and the dollar isn’t going that much lower. Possibly signs that the market is peaking and soon to shit.

I’m kinda busy so this one was shitty and quick, but overall, looks like we’re at a turning point. 50/50 where we go from here so be careful.

2 Likes

Yup, them options gammas are stacking up quite nicely. Sentiment is certainly bullish at the moment.

The 4200 has ended up being an effective “gamma magnet” these last two days, although today it seems like the relatively larger 4250 and 4300 gammas are managing to pull up the index even more.

Still feeling like we could end at 4300 or so by opex.

Bullish options flow also seems to be prevalent across the market:

Now… this is where the “no free lunch” thing comes in. This is a lot of positive gamma, much of which will expire next Friday. If we stay > 4200, when all these calls expire, de-hedging will occur in the form of long positions being closed. This selling should result in a post opex fall on Monday (22nd) and/or Tuesday (23rd).

3 Likes

Ladies, gentlemen and retards, according to statistics, we have seen the bottom of this bear market and we should be mostly green from here.

So apparently, so far in history, every single bear market has bottomed if we get above the 50% retracement from the peak to low as there has never been a time where we have gotten over the 50% retracement without seeing the bottom. This Bear Market Backtest video shows the proof of this theory and so far, it’s held up true.

This is a screenshot I took from the video by The Stocks Channel. It honestly looks like we should be buying the dip on the next drop instead of fomoing into puts. With NI’s options tracking skills, we can also see that options are bullish which lines up with this theory as well. One thing that scares me is that now that this information is out there, has the market priced it in and we’ll see a complete shitter?

Now looking at the SPX daily chart, we are above the 50% retracement from the peak to low. This usually signals that the bottom is in, BUT we are still news driven. So if the Fed pulls some unexpected bullshit or the next CPI print is bad, we could possibly make another leg lower. But statistically, that is very unlikely. It’s just something to look out for, but overall a good sign for bulls.

One thing that kinda worries me is that there are so many bearish divergences forming on SPY right now. On the hourly, we have another bearish divergence setting up on the RSI and MACD as the recent high has made consecutive lows. But another thing that’s worrying is that we have a much bigger divergence as the RSI and MACD from SPY 413 is still higher than it is right now. That could be a bigger bearish divergence looking to take place for a good shitter down. Just something to look out for before jumping into calls. I feel like last Friday was mostly a short squeeze and no actual buyers given the price action.

SPY on the daily looks very bullish still, although we are nearing some overbought readings. Another thing to watch is that we are nearing the next major resistance at around 429. That’s where we bottomed multiple times before so it could be that 429 is the peak for this rally before we pull back. I personally think that we do go to 430 before pulling back, but we’ll have to see. Another thing to note is that the weekly 50 MA is at 434 and historically, the 50 MA on the weekly has been a strong support and resistance. So there are a lot of strong resistances coming up.

VIX is continuing to track lower which is wild to see. We had 8 straight weeks of red on the VIX and I believe that this won’t continue for much longer. I do think we’ll see VIX rise again and give us another good dump to hop into calls. VIX is in a falling wedge which is bullish and everytime VIX has broken out of this falling wedge this year, SPY made another leg down. Whether we’ll make another leg down is to be seen, although statistics are telling us that we will not.

Overall, it seems like the bear market is over and the bottom is in. The next pullback will be crucial to confirm this theory and prove that we are not in a bear market anymore. Also short term, I think SPY goes to around 429 before finally having a big pullback, but we’ll see how SPY acts.

5 Likes

Barring an attack from Godzilla or something equally unexpected, we should continue on the bullish run this week. SPX gamma levels have beefed up even more. With vol trigger at 4145, we are in little risk of falling back into turbulent times. We should attain and hold 4300 with relative ease.

SG also notes:

Our gamma tilt indicator (below) measures put gamma/call gamma, and as you can see the indicator surged as call gamma pushed a second leg higher in markets (blue arrow to red arrow). We view the initial move higher (into the blue arrow) resulting from put destruction, and again, a build in calls fueling last weeks move >4200.

And apparently retail is piling into this call buying spree:

image

All in, should be another green week.

4 Likes

TLDR: I think this week will still have us continue on the uptrend and sell off next week taking into account what @The_Ni says about the options and stuff. He sounds smart so I agree with him, although I am looking for a pullback to enter into calls.

So the hourly chart looks bullish as we’re holding the 8 and 21 EMAs. One thing to note is that there is a triple bearish divergence on the RSI and MACD. This makes me think that we are due for a pullback, whether it’s small or big. I think we’ll see another good dump to buy calls to ride this week, but there are some good news and earnings that could move the markets. Overall, there are some bearish signs, but this is still a strong uptrend and the bearish divergence could just turn into a minor pullback like what happened this morning.

SPY on the daily is looking bullish as well. But we are going on lower and lower volume which is worrying. Another thing that worries me is that the RSI is nearing the oversold readings where we typically see a top. But right now, it’s buy all dips and follow the trend.

The VIX is still dead, but it’s not dying as much anymore. Is this an early sign that a pullback is coming? Who knows but just something to look out for because the VIX might have bottomed.

Another thing that stood out to me was how the dollar was spiking. It’s interesting how SPY is continuing to trend up while the dollar is sideways/ up. I think this is showing that buying right now is just a bull trap and we’re going to see a pullback soon.

Another reason why I think that a pullback is coming soon, which will determine if the market has bottomed, is because there are more bearish divergences forming. Looking at the smart money flow, there is now a bearish divergence there. Typically, this is an early marker of a pullback and that we are nearing the end of this run up. Another thing to watch out for is the junk bonds. Junk bonds have not moved up above the June highs unlike SPY. This is also bearish as it shows that the shittier companies are not following, which means that the market isn’t actually fully healthy. Overall, just something to watch out for and not fomo blindly.

In conclusion, I think that this week will be green, but I do think that we will see a pullback soon. I think the pullback will be a good amount, like 5-10% but who knows. Lots of things are pointing towards signs that this rally is near its end. I’m not saying that we go make a new low, I personally think that the bottom is in and we’ll have a 2-5% pullback, but we’ll see what happens.

4 Likes

TLDR: Probably an overall flat day tomorrow until minutes drop. Also possibly the peak of this run up we’ll see.

So looking at the hourly chart, we’ve been bouncing really damn nicely off the 21 EMA. This is a hella strong uptrend with the bearish divergences so far just leading to the drop towards the 21 EMA. Until the 21 EMA breaks, there’s no point being bearish. RSI and the MACD is rolling over, but we’ll see if it actually holds this and starts a downtrend. SPY right now is hella hard to trade if you’re day trading imo so it’s better to watch out for JB’s alerts or just stay out if you didn’t enter swing calls earlier.

So SPY on the daily has reached a critical trendline. This is the trendline connecting the December peak and the March peak. So far we’ve bounced almost exactly at that point, but we’ll see if FOMC minutes can push us above this level. Another thing to watch out for is that on the weekly chart, the 50 MA is at 433. If we can’t break above the 50 MA on the weekly, there’s a good chance that this is just a bear market rally as most bear market rallies ended at the 50 MA on the weekly. But on the daily, the RSI and MACD seem overextended, but don’t show signs of rolling over yet, which is good.

The VIX is holding up nicely at this range which probably means that the market is near its peak, but we’ll see when it actually peaks. At this point, I personally think that we go to the 435-440 range to peak to confirm that it’s a bull trend, but we’ll see.

Nothing major to see on the other charts as basically all of them are flat. Right now, I think people are just scared to enter the markets right now because of how much its ran.

Overall, same thing I’ve been saying for a while now. Lots of bearish signs and divergences that haven’t really led to big pullbacks. We are near 2 major resistances so we’ll see how SPY reacts which FOMC minutes coming out tomorrow. I’m starting to believe more and more about how NI’s options thing says we have a green week and next week we have a sell off.

6 Likes

Interesting tidbit from Kantro:

Surprised by the junk/short interest/meme rally? Beta, junk and highly shorted stocks perform best in bear market rallies. Here are the stats from the last two major bear markets.

Granted, Kantro is a macro guy who’s been a solid bear this last year, but he seems to know his stuff.

7 Likes

Next week is the Jackson Hole Symposium Aug 25 to 27. Could be a market mover.
https://www.reuters.com/markets/us/feds-powell-could-use-jackson-hole-flesh-out-qt-thinking-mcgeever-2022-08-12/

1 Like