SPY Tech Anal: May was Gay but now it's June

I forgot May ended so here’s the new monthly thread

TLDR: At this point, you should be expecting that SPY goes to 420 tomorrow. Whether we pullback from there for run to 430 will be seen.

Looking at the hourly on SPY, we formed basically a perfect double bottom. Never filled the gap at 405, but bottomed at 407. The RSI did form a bullish divergence on the hourly but right now, it’s forming a bearish divergence looking at the peaks. Should we ignore this? Maybe because we might not actually pullback significantly for a bit now. It’s looking very bullish on the hourly. 8/21 EMA back above, curving up, RSI MA curving up with RSI climbing higher. With a break of the 416 resistance where we got rejected, you should be expecting 420 tomorrow.

Momentum is showing that bullish sentiment is continuing strong. Also possibly a bull flag that we just broke out of. The 8 and 21 EMA just crossed, showing big bullishness. We had horrific volume, but I would assume that it’s because no one believes this rally and this is shorts getting squeezed. I’m looking at 420, and then testing the downtrend line and if my thesis is right, we should break and then test 430.

VIX finally made a new low and this is bullish. We finally crossed below the 25.5 line and VIX is only getting crushed. Because of the close below, I would expect this bull rally to continue.

Other things to note is that the Dollar died, yields were flat and more calls entered the market. This shows that the markets are bullish, so it’s better to just play the trend right now until downside is confirmed.

Overall, nothing to say other than look at 420, 423, 428 and then 430.

Now here’s my game plan for tomorrow. Either you’ll see me showing off my gains or I’ll be gone for a month grinding at the back of Wendy’s making back money.

Now here is my play. I’ll be looking for a retracement back to the 4160 level to backtest. Also for the RSI to reset and not be so overextended. If the 3 min confirms a bounce off that zone, I’ll be playing calls to probably the high we made today, I’m not gonna risk having SPX run to 4200 like it says on my chart. If the 3 min confirms a breakdown of 4160, I’m going puts until my support.

I’ll be looking at contracts that are in the .5 to .6 price range and hoping to make a bagger as from what I’ve seen a dollar move is usually 100%+ gains on those priced options. I might cut earlier, but we’ll see. Anyways, that’s my game plan if anyone else wants to follow along. Godspeed to me and all you fucking retards.

4 Likes

Dont forget to figure in what being released tomorrow. That can throw TA out the window right?

image

Yeah I checked. Ideally the move is made within the first 15 mins, if not I’ll be waiting until 10 when all news come out

yong is wise. United States ISM Non Manufacturing PMI - March 2023 Data - 1997-2022 Historical

Could see continuation of rally if it’s above 57.

TLDR: No fucking clue where we go lmfao

SPY on the hourly looks bearish. We’re now riding down the 8 EMA while the 8/21 EMA has crossed over. The RSI is also below the MA and trending lower. Good thing for bulls is that now there’s a gap to fill at the 415-417.5 range. We’ve been holding the 410 to 409 range. It looks like we’ll retest these levels and if we break 409, most likely we fill the gap at 405. Something to note that CPI data comes out next week and FOMC is 2 Wednesdays from now. Could that be a sign that markets want to derisk before those news come out? Who knows. Overall, hourly is showing bearishness although today was just flat as fuck.

SPY on the daily is still bullish, although losing steam. The MACD is now showing that the momentum is slowing. It doesn’t mean that we’re going to dump, but the lower timeframes are signaling it and the daily is showing early signs. Good thing is that 8/21 EMA is still crossed over and we’re holding the 8 EMA very well. Break below and we dump hard. The volume was disgusting today, but the volume was disgusting all week. We’ll see what happens.

VIX strangely was still down and holding below 25 even though we had a huge red day. Maybe signaling that we’re not going to dump hard and this is just consolidation before a huge move up. Of course, since VIX is volatility, it could be down just because SPY was so flat today. Overall, VIX is showing bullishness.

Other things to note, Dollar was up and above the 8 EMA, but the RSI hasn’t broke above the MA. The yields were up, but the 10 year got rejected at the 3% level which is a good sign. Possibly marking that this move down is gay and fake. Bonds rallied hard today too, maybe showing that SPY and the markets will rally again. PCC is showing a lot more puts entering the markets. It’s not at the level where it usually marks the bottom, but something to note. Overall, signs are showing bearishness, although it’s not showing extreme bearishness.

SPY on the weekly does look slightly bearish. The RSI failed to break above the MA and we got rejected off the 8 EMA. Something to note is how dogshit the volume was this week. Maybe showing that there’s no conviction in the selling. We’ll see what happens next week.

Overall, your guess is as good as mine because who the fuck knows where SPY will head now. Short term and some signs are possibly showing further move down, others are showing that this move down is weak and gonna be reversed soon. I’m willing to bet that we pullback to fill the gap at 405 and then rally back above because of the huge bearish divergence on the hourly on SPY. We’ll see. Good luck to all and have a good weekend

2 Likes

TLDR: I’m still betting on more downside, but we’ll see. It seems like we’re stuck within the 416 - 409 range.

Looking at the SPY hourly, we broke below the 8 EMA and then failed to break above all day. There are a lot of bottom wicks, which is bullish, but the fact that we can’t break above the 8 EMA makes it seem more bearish. Also, the RSI is now below 50 and the MA. Looking at the volume profile, we’re right at the region where we see lots of volume - either as support or resistance. If we break and hold below 411, I would imagine a quick dump to 407 and then beyond that, an even quicker dump to 400 because there’s no volume between there.


Looking at the SPY daily, we’re still bouncing off the 8 EMA and consolidating for a big move to either side. Also there’s no volume today again, showing that there will be a huge move soon. Looking at the RSI, it does look bullish because it’s holding above the 50 RSI and the MA. The MACD is showing the weakening bullish momentum, but the bars aren’t really moving down a lot. Overall, nothing really other than consolidation. Another thing to watch is that there a gap to fill above at 417 so we could fill it to bull trap before going back down.

The VIX has been getting rejected off the 8 EMA for like 2 weeks now. We are above 25 now, but still getting crushed midday. Not much to say other than VIX is looking like it wants to bounce soon because it’s not really getting crushed any more and the RSI is starting to curve back up.

The 10 year yield spiked up and now above 3%. This is bearish for stocks and no bueno. The dollar was also up today which is bearish. PCC shows that a lot more puts entered the market midday as the candle shows a huge green.

Overall, charts are slightly bearish, but the other stuff like the dollar and yields are showing bearishness. I’m willing to bet we go fill the gap to 405 and head a bit lower looking at the volume. I’m still bullish longer term and I think that we’ll see SPY at 500 and the rally starts after FOMC and the quad witching next Friday when options get repositioned.

1 Like

TLDR: Another day of consolidation. Who fucking knows. Whichever way we break - below 407 or above 416, it’ll be very explosive and that’ll be the trend for a while. Break 416.5, I assume we go to 430, break 407, I assume we go to 395ish.

Looking at the SPY hourly, we can see that we’re stuck in the channel between 416.5 and 407.5. I assume this is because CPI is Friday, FOMC is next wednesday and quad witching is next Friday so everyone is just watching. Anyways, hourly looks bullish again, although after hitting the top of the channel the last 2 times, we just shat the next day. Will we see the same thing again? Who knows. There’s no bearish divergence on the RSI, MACD is showing bullish, although it’s weak. Another thing to note is that the stochastic is in the oversold region and rolled over. Maybe showing that SPY will shit the bed again? The 8/21 EMA shows bullish, but it really doesn’t mean shit at this point until we break out of the channel.

SPY on the hourly and the daily might be forming a h&s. The 2 shoulders topping at 416.5 and the head topping at 417.5 or whatever. The daily chart is meh. Nothing to see other than it’s still consolidating. The volume has been declining for the last 6 trading sessions. This is textbook consolidation and whatever way we go, it’ll be explosive and you should only be playing that trend for a bit. MACD is showing weakness, but it’s still not getting crushed, which is bullish.

VIX is getting crushed again and it looks like it’s showing that there won’t be a SPY pullback and we’ll just be pushing up from here. Multiple closes from the 25.4 area and it’s looking like it wants to roll over still.

Other things to note: 10 year yields got crushed, but still holding up the support zone. Dollar went down a little, bonds went up, PCC is flat and the Russell is continuing to move up. Typically this shows that markets are strong since small caps are doing well and the other indices should follow soon. Russell does give lots of false signals though, so it’s not a 100% thing.

Overall, some signs are showing bearish, but more are showing bullishness right now. if SPY does break 416.5 tomorrow and holds, I expect 420 tomorrow and then 430 or we shit the bed because of news. Basically, either tomorrow we see the massive move up or we shit the bed and form a h&s and then shit down. I’m leaning towards up based on VIX and the IWM, but we’ll see.

1 Like

spy consolidating for this long probably means rally might peter out, unless ofc CPI numbers look very good.

TLDR: Still consolidating and looking more like the shitty h&s on the daily which means more downside so basically the same shit I’m gonna say from yesterday.

Surprise the 8/21 EMA are now showing bearish. Anyways, the RSI is back below the MA which is bearish. One thing to note is that the stochastic has been “oversold” for a bit now. Typically at around this point, it starts to roll up due to us getting a bounce. This suggests that we either go back to retest 414 or whatever, or just a smaller pump on the hourly before we continue to trend down. Anyways, the next major support to watch is 409 again. One thing to note is that the volume profile shows the 411.5 as the major support/resistance right now. If 411.5 breaks tomorrow, look for a flush to the 409 area.

On the daily, MACD is slowly rolling over, the 8 EMA is holding up as strong support so far. Volume is slowly increasing though, maybe signaling that this consolidation will end soon, probably with the CPI report. With inflation as high as it is, I’d assume people are bearish about it and start to sell off tomorrow, and who knows what CPI will say. If it shows signs of slowing down, it’s moon city from here. Again, the daily candles are kinda showing the h&s pattern, so watch out for the flush to the downside.

VIX is holding that 24 zone well now. VIX being down on a red day makes this a bullish development. Another thing to note is that it hasn’t had a green candle for a while now. VIX is showing bullishness on the upcoming days, but I wouldn’t put too much weight right now because the SPY earnings (CPI) are Friday and the earnings call (FOMC) is next Wednesday. I’m still willing to bet on downside and let bears fuck bulls again.

Other things to note, 10 year yields were up, Dollar was down, bonds were down, and more calls entered the market today. So kinda just a mixed bag with no direction leaning.

Overall, just another day of waiting to see where markets want to go. I expect weakness heading into the CPI data and then more weakness heading into the FOMC meeting. I also expect the fed to be more dovish and the talks about pausing rate hikes in September combined with quad witching where options reposition, could have us moon shot. My thought is that for the next few days, it’ll be bearish and bear trap people before we moon shot starting late next week.

1 Like

I came looking for your daily post and reread yesterday’s. I wanted to say out loud that I am grateful we’ve got you sharing proper TA with us. Your stats are good. Thank you.

TLDR: TA means jack fucking shit since CPI is tomorrow and that’s gonna dominate where we go. Today’s sell off was just people derisking for that report. So whether we go fill the gap to 397 or just green dildo to 500 is up to the CPI report. But if you still want TA, read on.

Before we go to TA, I’m gonna show you what the usual pattern is for SPY when CPI drops. Because TA is batshit useless on CPI report days.

5/11

4/12

3/10

2/10

Basically, no matter what the CPI report is, we’ll prob see a sell off in the morning, but we will sell off within the first 2 hours of the market. I did say that the CPI report days were usually green in TF, but I was wrong. It was all red, with the best day being basically breakeven.

If you want to play the trend, you should buy calls in the morning and hold until like 10 and then sell then switch over to puts

Now onto the scheduled TA which will be useless.

Looking at SPY hourly, there is really no volume where we are right now until 397.5 where the volume comes back in. The hourly is bearish and the RSI is on its deathbed right now. Because it’s such a downtrend for now, until the RSI MA goes to the oversold reading, I don’t think we’ll reverse. Tomorrow when CPI drops, I would expect us to recover fully from the CPI drop and then shit the bed.

SPY daily chose down. We broke down, MACD is now rolling over and if the bottom holds like I expect it to, I want to see the RSI and MACD bullish divergence. If no divergence shows, I will no longer be bullish longer term. The volume has picked up and I assume that CPI will confirm the direction. Overall, the h&s looks like it played out on the daily and tomorrow we’ll see where we go.

VIX shot back up today. it’s over 25 and now at 26. This is bearish and good for bears. I expect it to continue to go up and markets to go down as we approach the FOMC meeting. Another thing to note is that the yellow line shows another uptrend line where VIX bounced perfectly. I didn’t notice this and this could have been key at predicting this dump. Anyways, there are now 2 big uptrend lines. The yellow and the blue which could mark the top or an incoming dump.

One thing to note is that the small caps are now dying. This is a big bearish indicator since small caps are affected more by the market movements. For the other indicators, yields are up, dollar is up, more puts, but bonds are up. Overall bearish signs for the markets.

Again, my plan tomorrow is to buy calls at open and then hold until 10am or until I see us recovering fully to the CPI drop and then entering puts. TA right now is useless until CPI drops, so we’ll see how the weekly looks.

1 Like

Hi keep in mind, in addition to CPI tomorrow, we have PPI, and the Fed meeting June 14-15

https://www.reuters.com/markets/us/feds-mester-could-easily-see-50-bps-rate-hike-sept-too-2022-06-03/

3 Likes

The last 5 CPI release days had a huge pump in the morning before a dump. The one day I actually try to play this trend, it doesn’t happen. Yay market.

I expect us to go retest 395-397 before continuing lower heading into FOMC.

Looking at the hourly, obviously a bloodbath today with no buyers and the buyers that did come in near close just got shat on. Something to note is that the RSI MA is in the oversold range and this typically results in a bounce. Not saying that it’ll bounce, but just something to note and also noting the bullish divergence on the hourly. Overall, I expect us to retest the 21 EMA and then continue to drill into the FOMC meeting.

The last time the RSI was stretched to this level was back during the $12 dump days. The RSI can stay in this range for a bit and continue lower so it’s not a signal to just buy. More likely than not, on Monday, we’ll double bottom at 390 or 387 and then it’ll start to move back up. Also looking at that time too, SPY went to the 21 EMA and then tracked lower. I expect around the same thing to happen.

SPY on the daily has a huge gap to fill now which is good for the bulls I guess. But overall, very bearish looking and with huge volume too. Something to note is that the RSI is showing a bullish divergence on the daily and the MACD is also showing a bullish divergence. I personally don’t think this is the bottom, but just something to note and signs pointing to a bounce.

Looking at the VIX, we’re in 2 triangles. One in yellow and one in blue. We bounced off the yellow triangle, possibly signaling a bounce and that bounce ending when it hits the lower triangle bottom. Overall, VIX is kinda showing a sign for a bounce, but we’ll see.

PCC is signaling a bounce though. We’re back at the levels where we typically see a local bottom on SPY. So many puts and these times have been the bottom for the last couple times now. I expect Monday to either be green or have a huge rally intraday followed by a dump. I don’t expect a multiday run on SPY or anything, too much fear heading into the FOMC meeting.

Somethings to note, 10 year yields are back at ATH, although there is a bearish divergence, dollar is back up, although not at ATH. Overall, things are looking bearish heading into FOMC so manage your risk.

Overall, there’s a good chance we go retest 380 and form a double bottom or we continue to drill and we have the most predictable recession/ market crash in history.

2 Likes

TLDR: I expect another red day or a pretty flat day tomorrow. We are oversold, but there is too much fear and big news coming out that I don’t expect us to rally.

Looking at SPY hourly, obviously we are very bearish. RSI is extremely oversold although it’s now above the MA and flattening. 375 is a strong support based on volume and previous reactions. MACD is showing some bullish signs, but we have been rejecting off the 8 EMA on the hourly so there’s nothing to really say that we are bullish.

SPY on the daily is showing capitulation. Increasing volume with gap downs and red days. Anyways, there is a bullish divergence on the RSI and MACD so far on the daily. If we continue to head lower these could get erased so something to note. Futes are currently rallying, but we could easily just bull trap people into poverty.

VIX broke out of both triangles. Extremely bearish for stocks. 35 is typically where we do see bottoms, but we could easily continue higher and look for 40 and continue to crash. One thing to note is that although we are down this much, VIX still hasn’t made a new high since the May bottom. Possibly a sign of a bottom forming, but we’ll see.

10 Year Yields

Dollar

Put Call ratio

Somethings to note. IWM hasn’t made a new low like the other indices. This is bullish as small caps are still showing some signs of strength. The yields and dollar are making new highs, but they both have bearish divergence on the MACD and RSI. This is possibly a sign that this is a bear trap for the upcoming triple witching this Friday. Put call ratio is still very elevated, and it’s at the level where we do see bottoms form.

Overall, things are looking bearish with some bullish divergence. In my opinion, I don’t think we reverse until FOMC if we do. The Fed could do something that could cause markets to rally, but I think the thing that will cause markets to reverse is the triple witching this Friday. This is when big money repositions. If markets do reverse, it’s because the big money will reposition into long positions during triple witching and cause a short squeeze like the last 2 bottoms. Maybe the FOMC will cause a bottom and then triple witching causes it to accelerate, but this is all just speculation. If the Fed doesn’t come in with good news or something to save the markets and big money just continues to go into the short side, then we’ll have a recession and the most predictable crash in history.

Personally I think tomorrow is going to be pretty sideways and we form a doji on the daily or something. Then FOMC might cause a bottom or might just cause volatile sideways action until triple witching which can either lead to a bottom that day or the week after. But for now, it’s just finding put entries rather than trying to time the bottom.

3 Likes

TLDR: FOMC might cause a rally with them most likely announcing a 75bp hike unlike the 60bp they were suggesting in May. Who knows at this point how markets will react. Maybe we’ll run up into FOMC and then sell off or rally due to FOMC and then shit the bed the next day.

SPY on the hourly is oversold and bearish still. Overall a flat day and got rejected off the 8 EMA all day. This is bearish and based on the consolidation, we could make another leg lower. We’ll see what the markets want to do.

So far, MACD has a bullish divergence, but we’ll see how it goes. Because we’ve closed beneath the uptrend line twice now, I’m honestly expecting a drop to the 200 MA on the weekly which would be 350. The volume was lower today, but still high which is surprising for a flat day. Anyways, overall looking bearish and most likely going to make a leg lower based on FOMC.

VIX has a bearish candle formation. The candle today is inside of the candle body of yesterday’s. This typically means a downtrend which means SPY could have a green day tomorrow. This doesn’t mean that SPY will bounce because the last 2 times this happened on the VIX, we did have a green day while the other time, SPY went down lower for a day before coming back up.

Looking at other things like the dollar yields, bonds and pcc, all of them are looking bearish other than the PCC. The yields and bonds and the fed futures are basically saying that the fed will do a 75bp rate hike. If the fed for some reason decides on 50bp, then the markets might rally short term. The PCC shows that puts exited the markets which could signal that a short term bounce might be incoming. Who knows what will happen though.

Overall, TA isn’t the most useful with FOMC coming up because who knows what the fed will do and how markets will react. So far, it’s looking like we might go to 360-350 with all the fear and volatility with maybe a small pump in between. Something to note is the triple witching this Friday where we could see big money reposition and cause a huge short squeeze rally. Other than that, nothing worth predicting or saying and just seeing how tomorrow goes.

4 Likes

TLDR: I expect further downside but I do see us filling the gap up to 390 before we do.

On the hourly, we see that the RSI is looking bullish and that the 8/21 EMA is starting to curl up. This is with weak momentum though and I do expect it to fizzle out. We did break 382 partly before getting rejected. I expect us to retest 382 and if we break above, I expect a gap fill to 390. I think that the bearish news about inflation and the Fed being uncredible will be enough to push SPY back down so it’s not a long term bullish situation. Maybe we don’t gap fill, but more likely than not, we’re going to come back down and form a bullish divergence around the triple witching and then get a bear market rally.

On the daily, we can see that we are tracking back to the 8 EMA which very nicely lines up with the 390 gap fill level. There was good volume today, suggesting that a further upside is in store. Overall, daily is looking bearish with a MACD bullish divergence, but with short term bullish move. Looking at the orange line, which is the trendline of the 2 previous lows, I think that we go test that trendline and then form a bullish divergence and rally up. This level would be between the 150 and 200 MA on the weekly chart which is typically when we see bear market rallies/ deep corrections to end. I think sometime around the options expiration, we’ll see that explosive move up and get a short squeeze rally like in March and whether we manage to break above the 200 MA on the daily will determine if this is just a bear market rally or not.

VIX is getting crushed again. Right now, we’re on the trendline support and based on this, there could be the possibility that we see a red day tomorrow because VIX could go back up. Overall, VIX is looking weak as it’s been forming lower highs since the February low. If this is a true bear market, you would be seeing higher highs, but as there’s no higher highs being formed, there is a good chance that this is just an extended correction as this bull market has been magnified by the stimulus checks and all.

Other things to note, dollar and yields were down, possibly signaling more bullish momentum incoming tomorrow. Another thing to note is that PCC showed more puts exiting the markets and nearing the point where we’ve seen markets top recently. This could signal one more green day before a continued dump.

Overall, I do think that we see a rally soon powered by the options expiring and repositioning, but short term, I do see a new bottom that you can get calls at like at 360-365.

4 Likes

TLDR: I’m predicting a rally starting within 3 days so Friday, Tuesday or Wednesday, most likely Tuesday/ Wednesday. Friday will most likely be volatile, but we’ll probably see more downside. Whether we end red or not is up for future readers.

SPY on the hourly is forming a bullish divergence although it’s failing to break back above the 8 EMA and have the RSI go back above its MA. Overall, it does look like it’s bottoming as we’re holding the 365 level well, although I do think that we see more downside because we’re just unable to get back above the 8 EMA.

On the daily, there’s no bullish divergence, but the RSI isn’t that much lower than when SPY was $15 higher so it can be seen as a bullish divergence. The MACD is currently showing a bullish divergence but for it to play out, we need to start rallying and curve above within the next few days. Some things to note is that we are below the bollinger bands and pretty far removed from the 8 EMA. Not saying that we can’t go lower, but most likely we’ll see a return to average at the bare minimum within a few days.

Something to note is the amount of Put OI for Friday. There’s over 200k on OTM strikes and over 80k scattered around all prices. This makes me think that because there’s so much put pressure, we’ll see red until these options expire. But these of these huge put OI, I don’t think we’ll break below 350 at least. Other things to note is that SPY weekly is currently between the 150 and 200 MA which is typically when bottoms form during bear markets and corrections.

One more thing to add is that VIX had a 10%+ green day. This typically signals an up day for SPY. I don’t know why, but that’s usually the case. Not saying it has to happen because the last couple times other than Wednesday, SPY had a green day after 2 days, which lines up with the Tuesday rally. VIX also isn’t making new highs, even from Wednesday, showing that this move down most likely isn’t going to continue much longer without a rally.

10 Year Yields

Dollar

Put Call Ratio

Things to note is that the yields and dollar are showing bearish divergence and now playing them out. This is bullish for stocks and possibly showing a peak on these yields and dollar giving more reason for SPY to rally soon. Put call ratio shows more puts entering the market, but not at the level where we really expect to see bottoms. Overall showing bullish signs, but I do expect one more red day before we rally hard.

US Oil is showing signs of peaking too. It’s showing a bearish divergence and now playing it out. Even with the CPI data, it’s down. This is possibly signaling a peak in inflation and whether or not it is, Oil going down will give the markets more boost to go up.

To conclude, many signs are showing a market rally soon. I do expect Friday and possibly Tuesday to be good days to get into calls for a market rally fueled by a short squeeze like in March. Quad witching is when options, futures and index options expire and when big money repositions. If they reposition bullish like I predict, we should see the start of a huge short covering rally within 3 days. Many bullish divergences on the index and bearish divergences on the other stuff like oil. I expect the first half of Friday to be red at least and possibly a rally near EOD as shorts start to cover.

3 Likes

TLDR: I do expect some more downside to the 350-360 range before we go back up. Because quad witching didn’t produce the rally, I’m expecting a little more downside before we start to go back up as Powell starts to talk Wednesday so I don’t know if people want to buy in starting Tuesday. Overall, I do expect markets to bottom and have a rally sometime Wednesday/ Thursday after markets digest what Powell says.

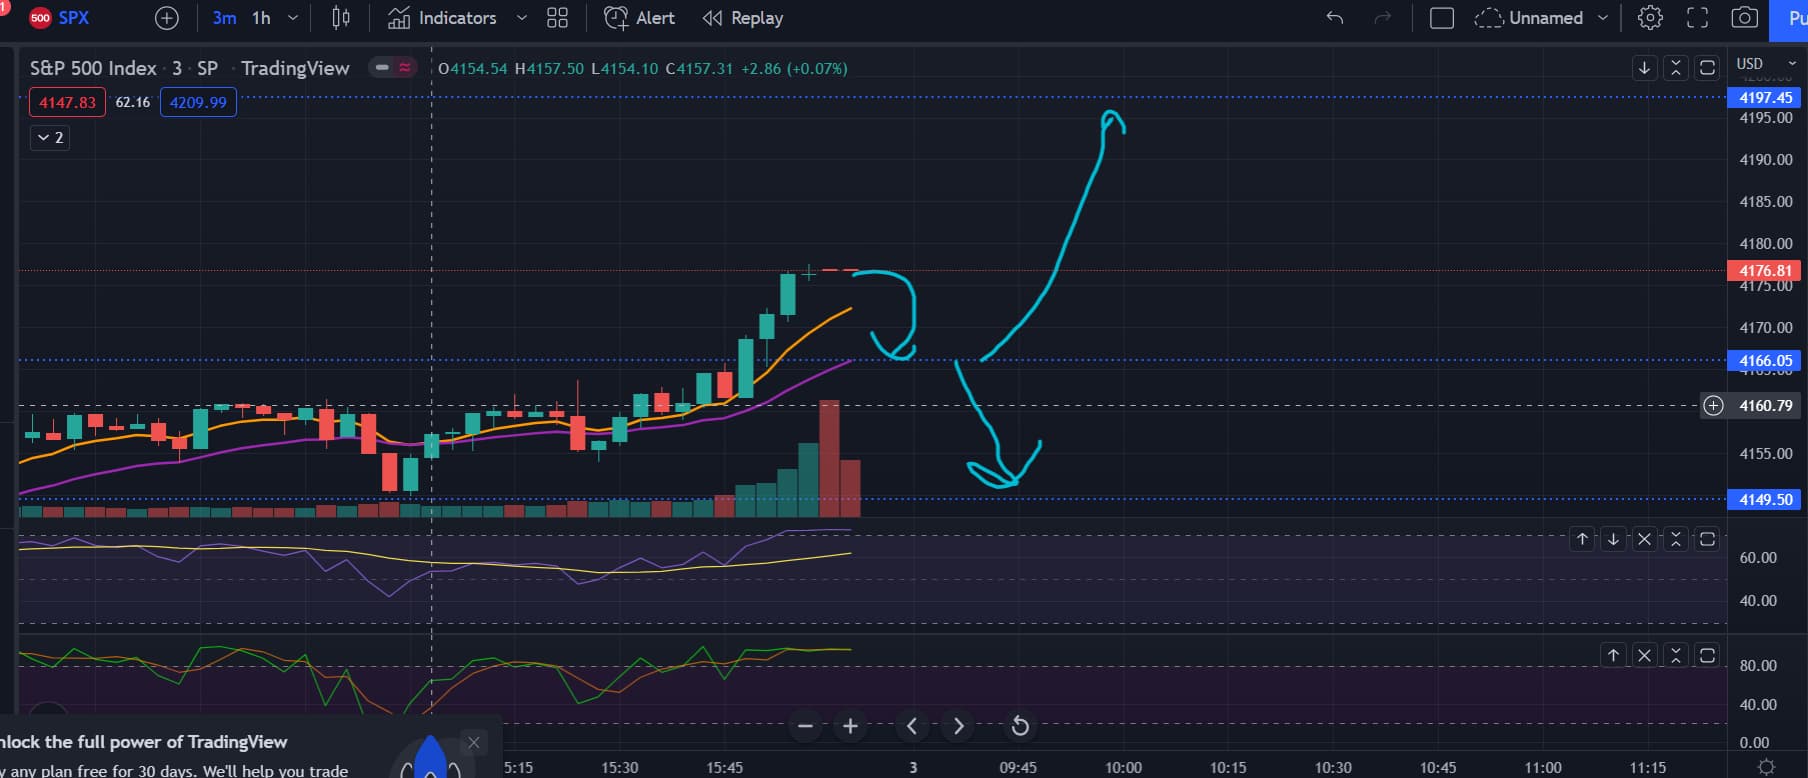
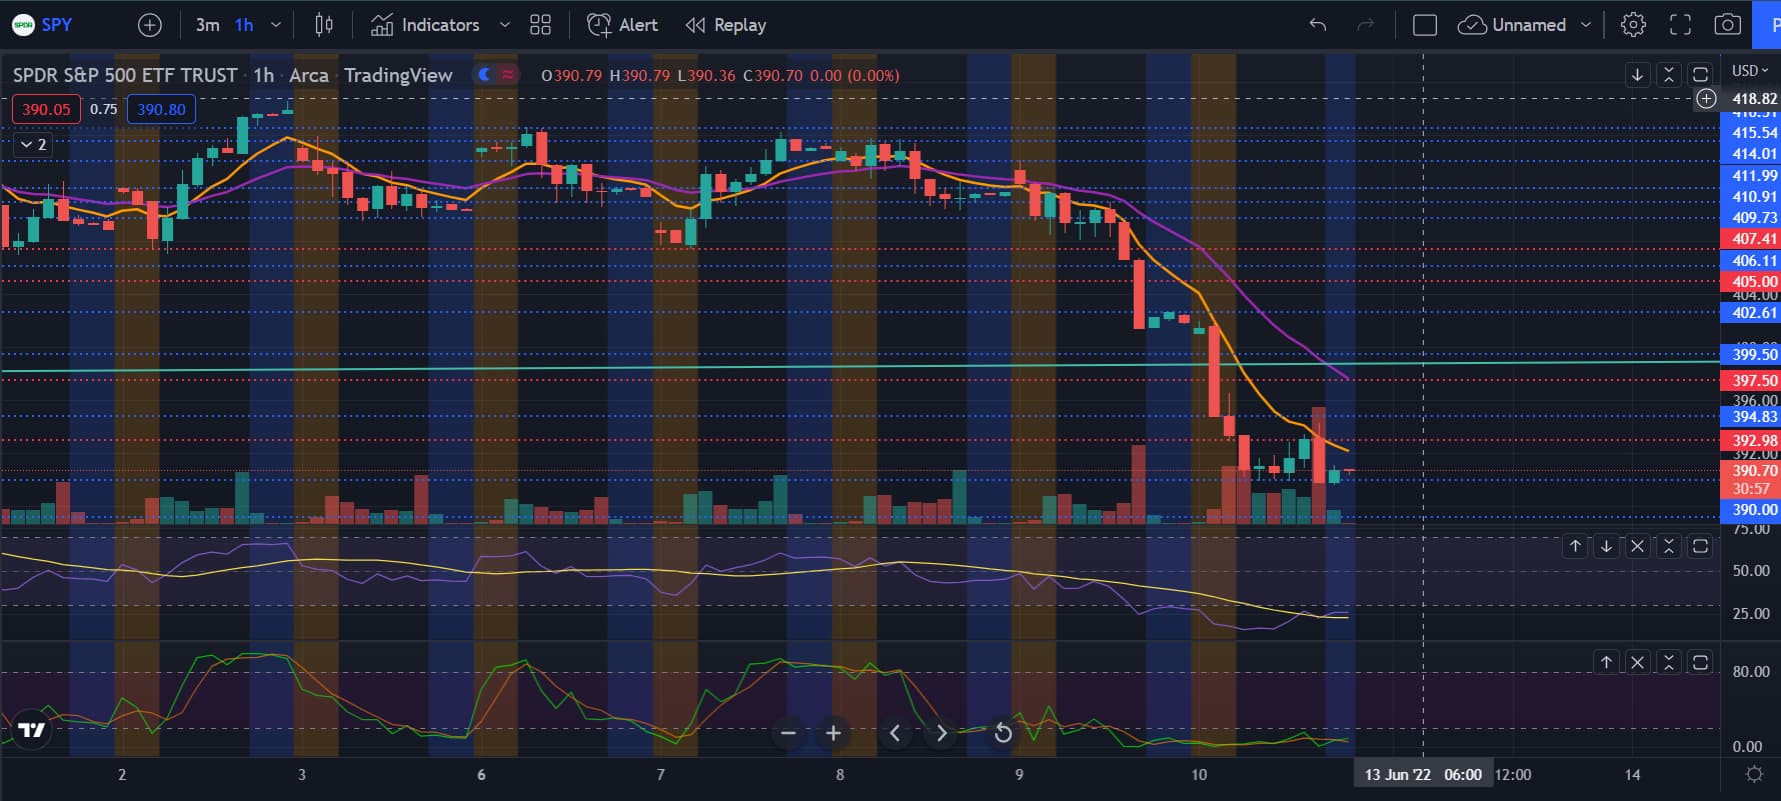
Looking at SPY hourly, we are forming bullish divergences and now the RSI is holding above the MA which is bullish. Another thing to note is that we are trying to break above the 8 EMA. This is slightly bullish, but because it’s unable to truly break above the 8 EMA, I wouldn’t call it super bullish yet. The EMAs are starting to flatten and there are bullish divergences, but until these play out, there’s no reason to be bullish based on the chart.

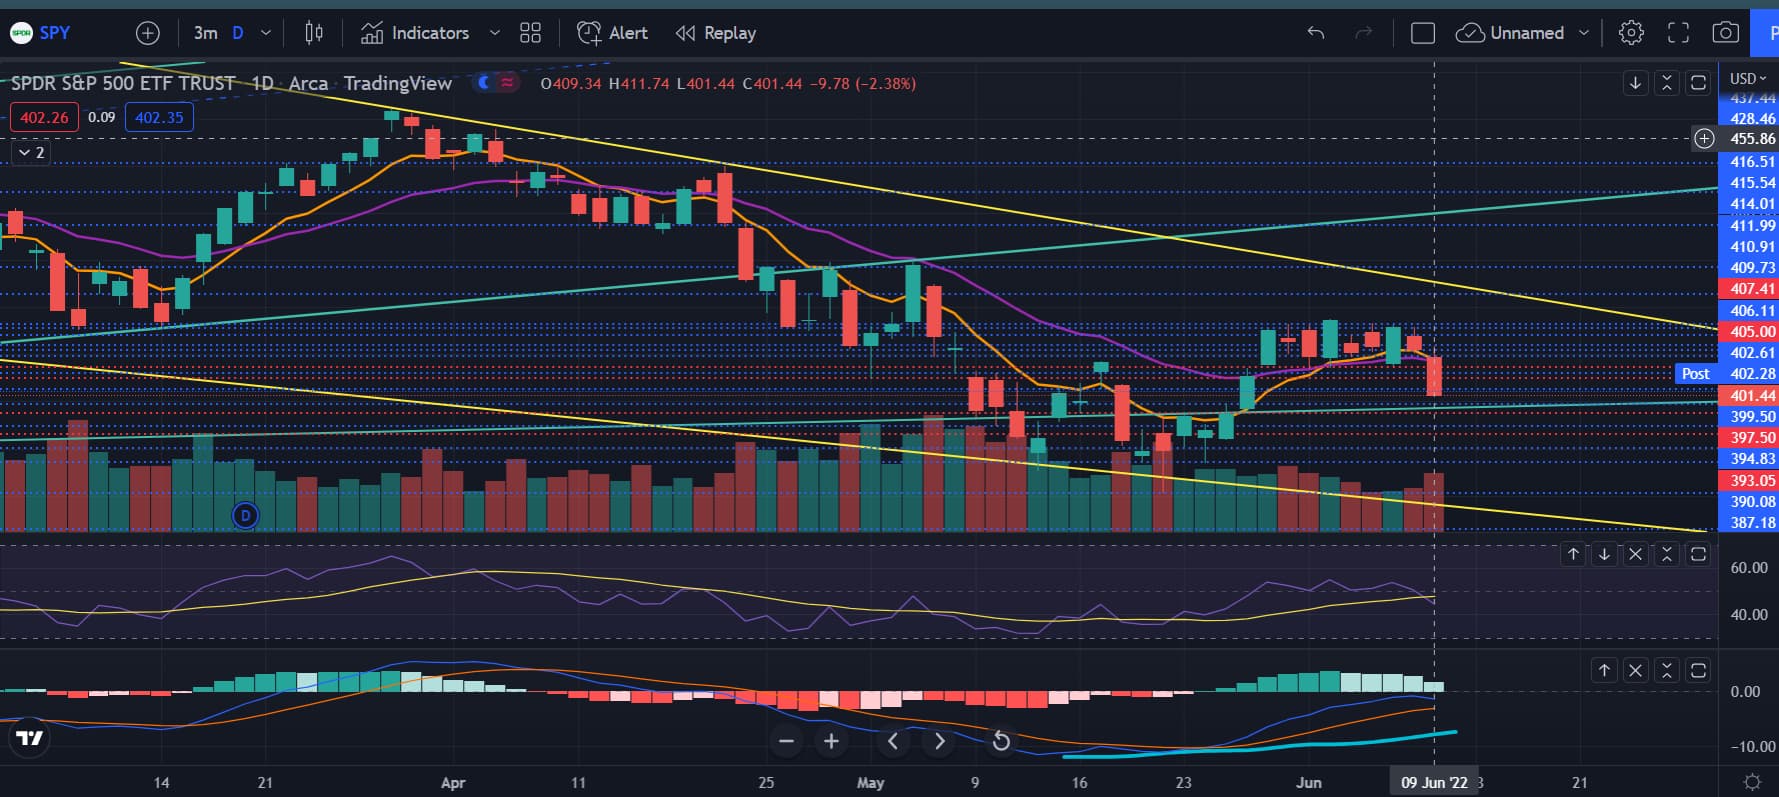
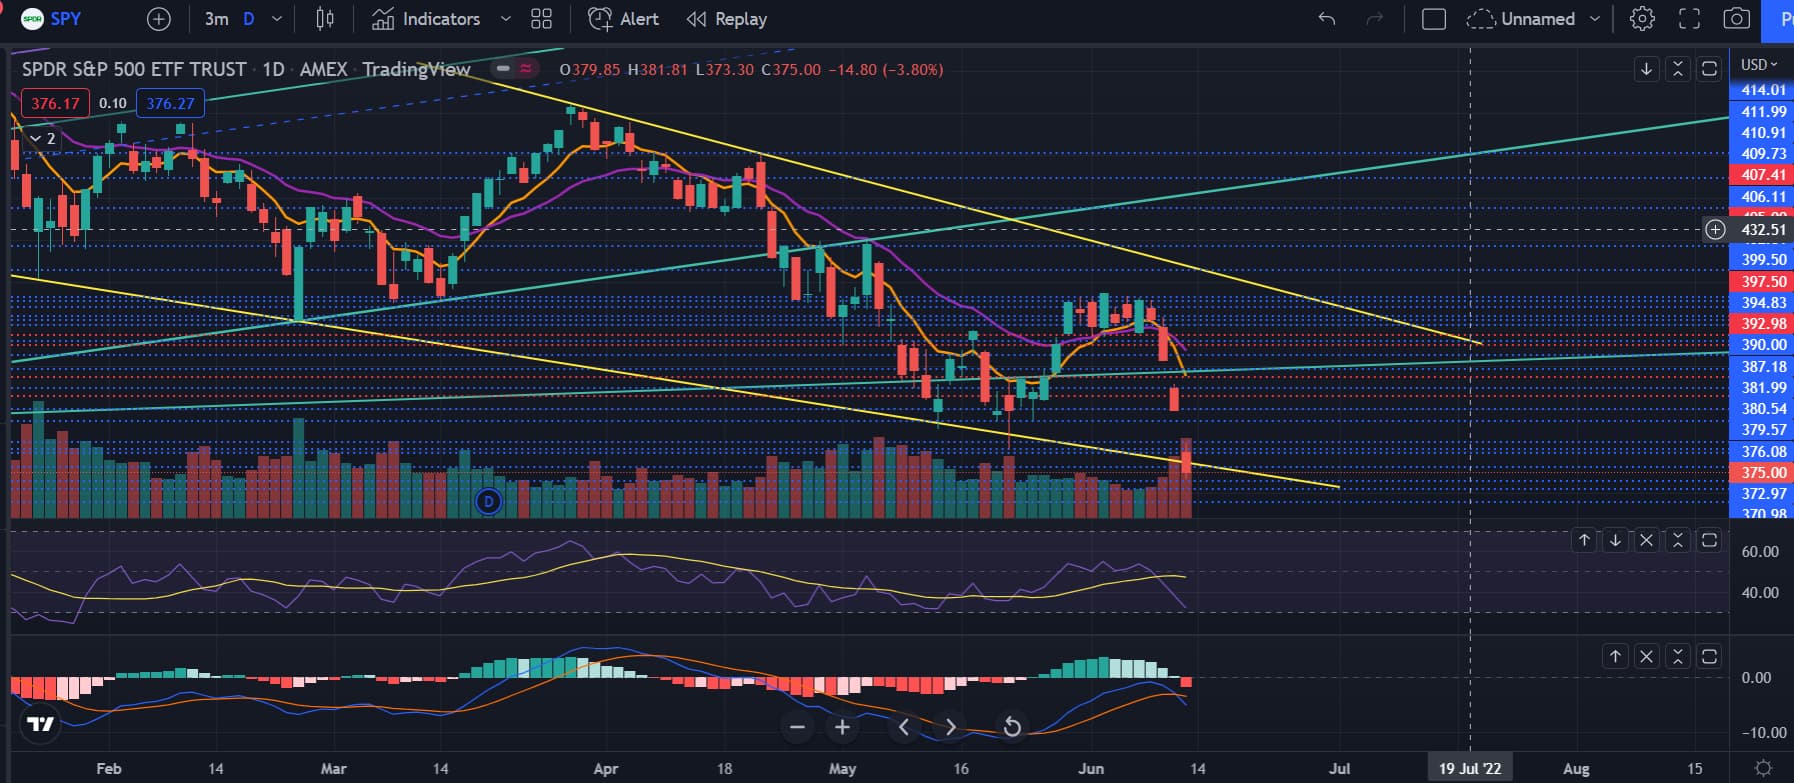
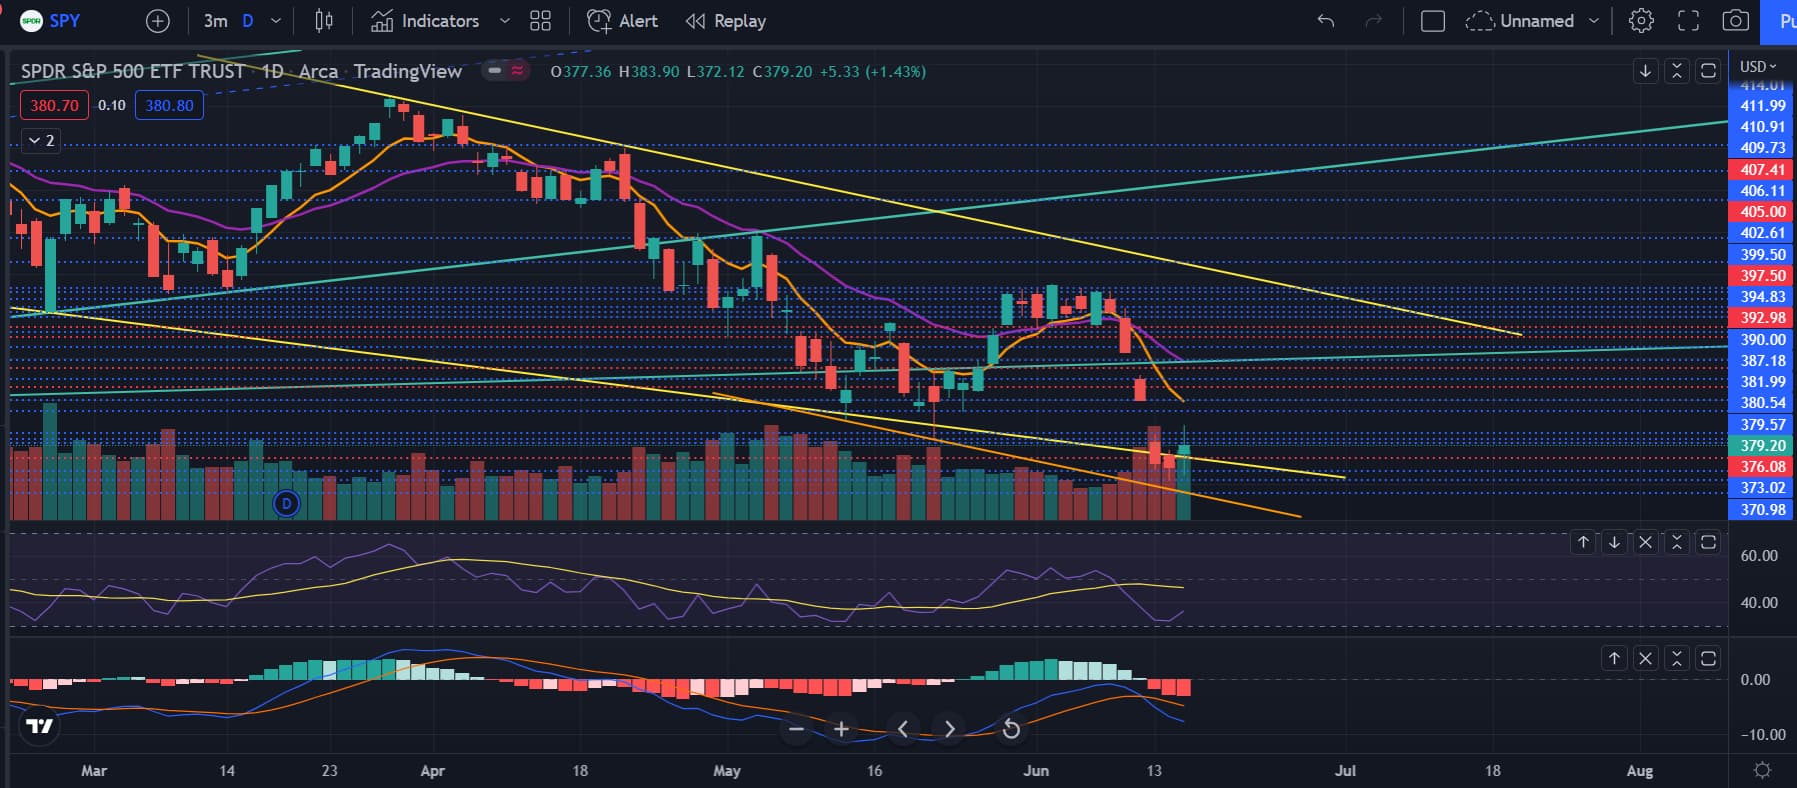
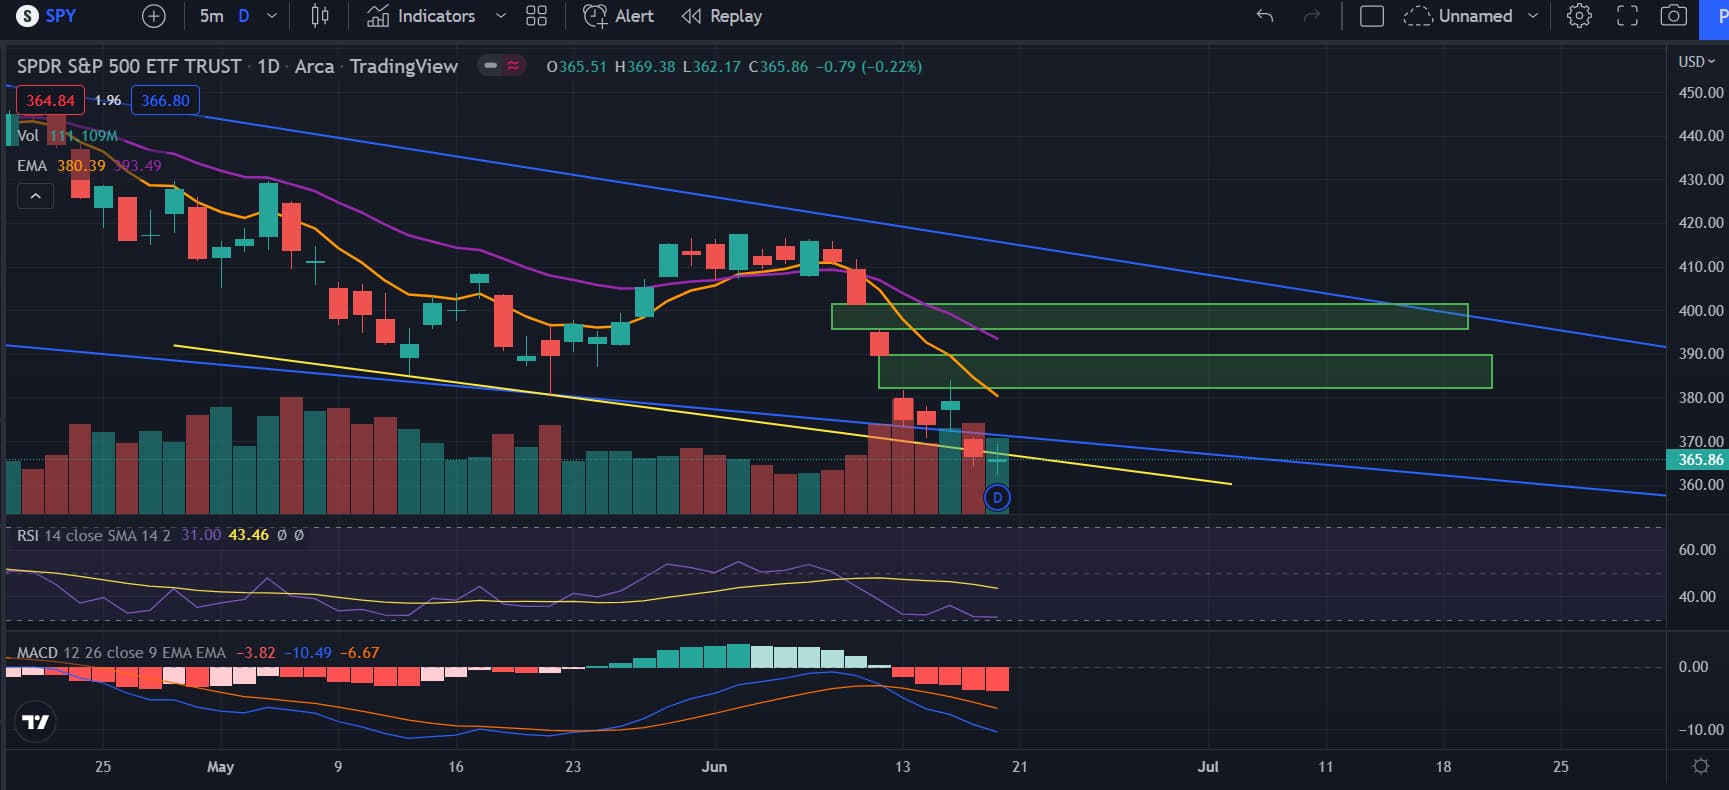
On the daily, we are forming MACD bullish divergence and the RSI is flattening even though we’re going down lower. Something to note is that we’re still below the trendlines and right at the bottom bollinger band. Daily looks bearish and we formed a doji candle. This is an indecision or maybe just sellers getting tired and unable to push the prices too much further down. Looking at how extended we are, I do expect some kind of rally soon.

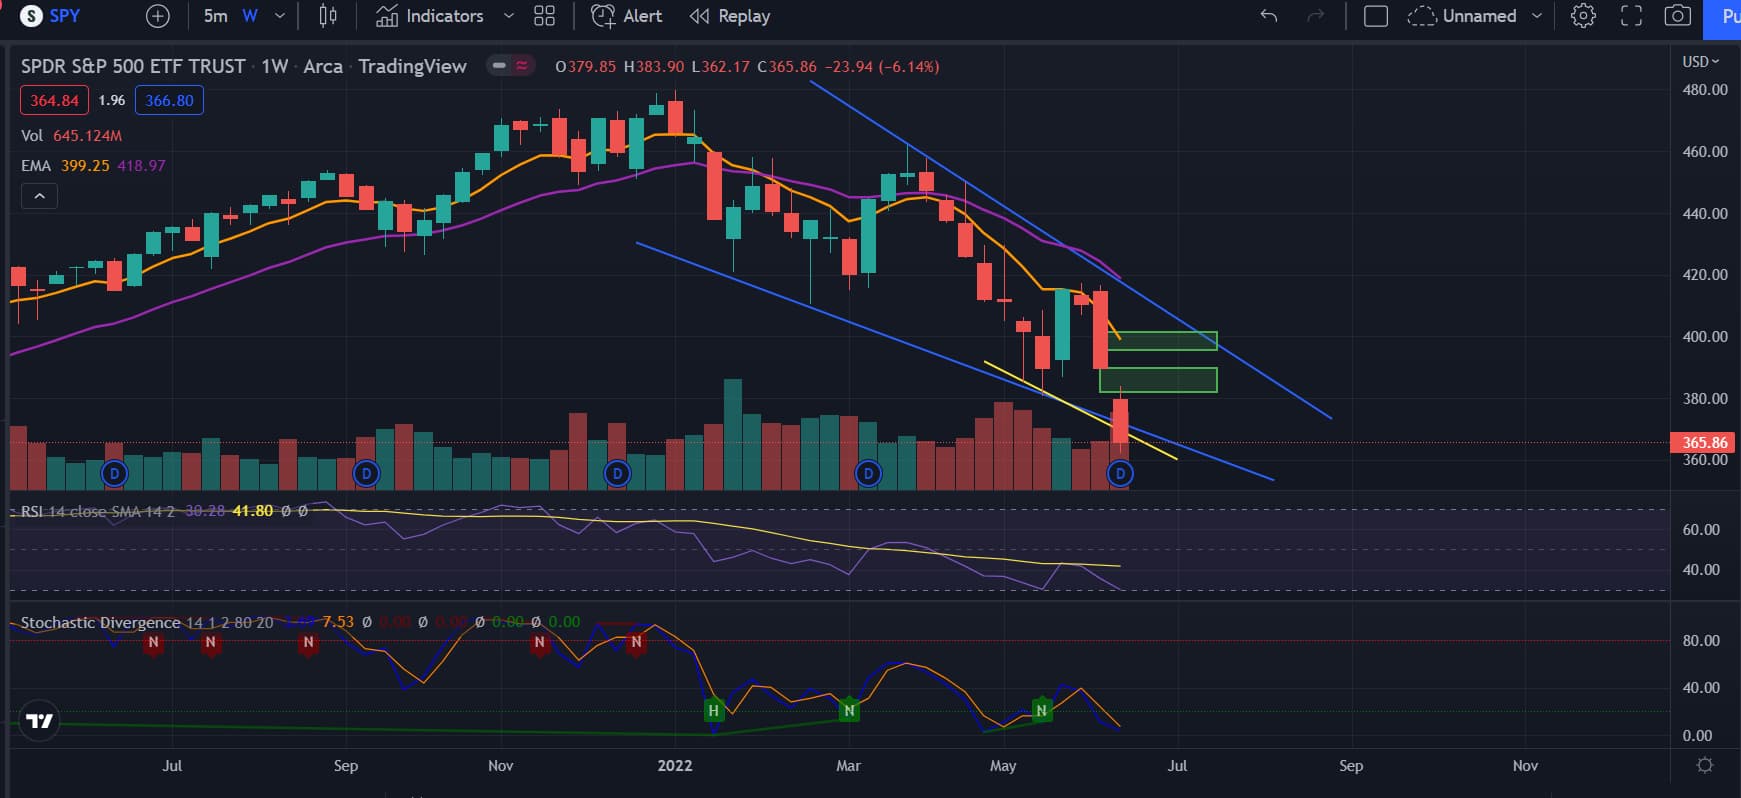
Looking at the weekly chart, we still have a bullish divergence on the RSI and gaps to fill. Having gaps above is bullish, but I do remember seeing a chart posted on the forums about how in 2008 we had a weekly gap, we shat the bed. Whether we do the same, we’ll see, but I actually expect a rally. The weekly is almost at the 200 MA which is when bear market rallies usually start. The 200 MA is at 350 right now, whether we go down that much or not is to be seen.

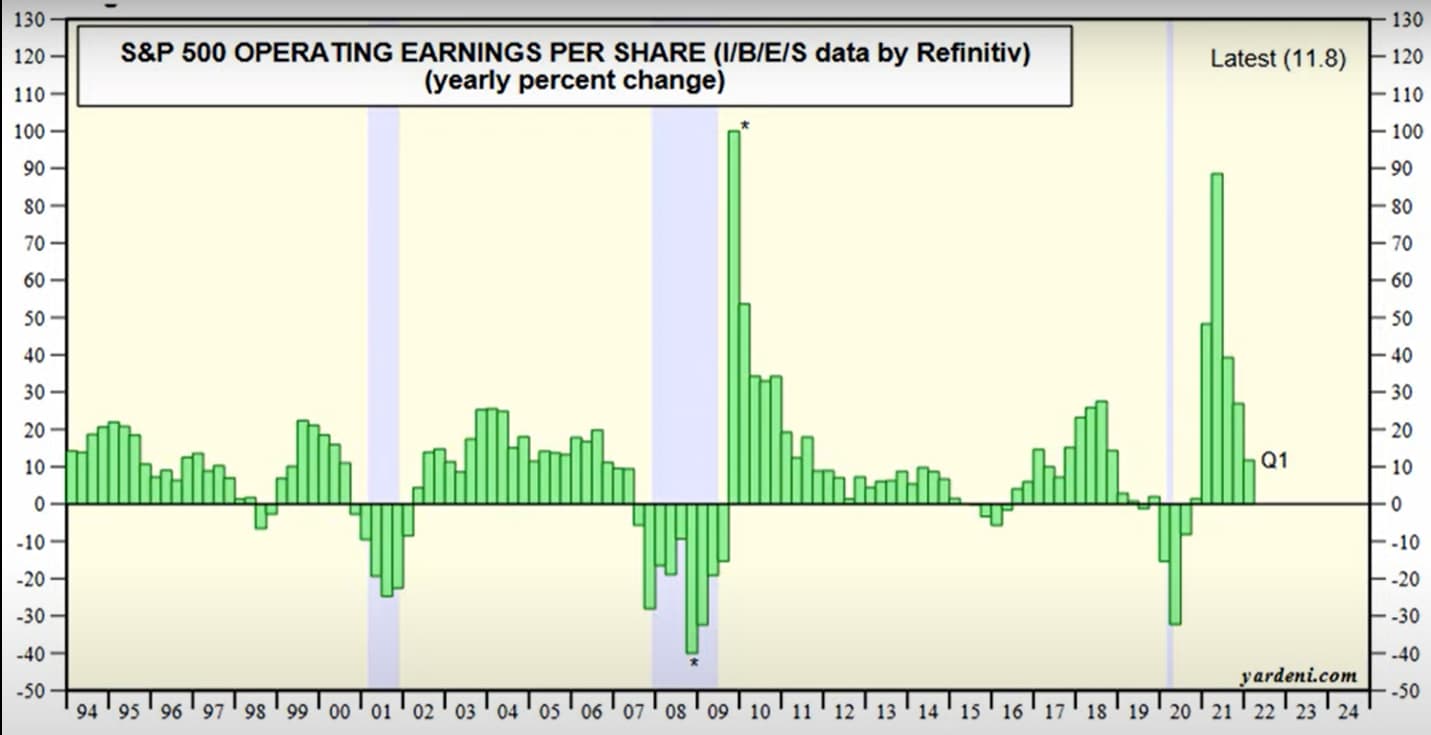
Some things to note is that recessions start when earnings start to go negative. We’re still in positive earnings so I don’t think we’re about to enter a recession as everyone is looking for it, earnings is positive and everything is extended to the downside similar to the bottoms of bear markets and major corrections. Until we start to see earnings go negative, I’m hesitant on saying that we’re in a recession or heading straight into a recession without a rally.

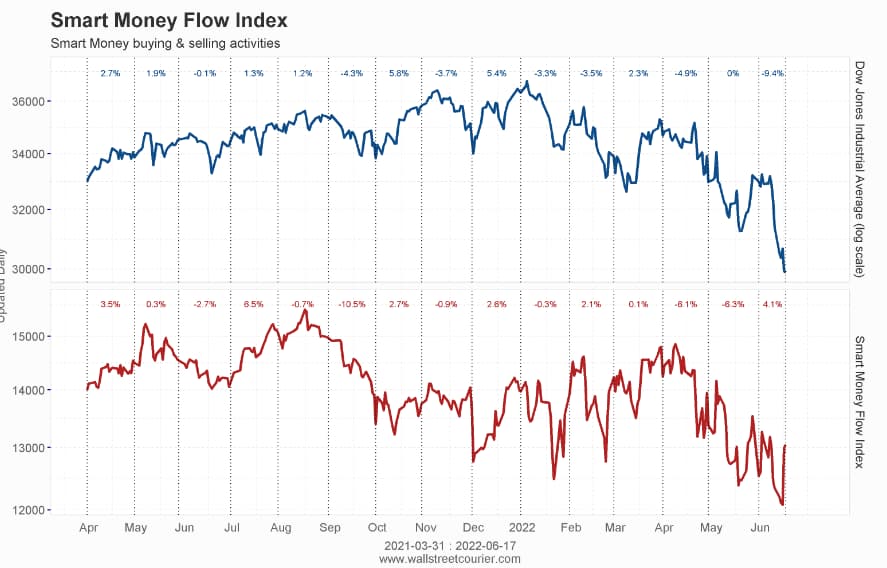
Another thing to note is the smart money index where we can see what smart money is doing (red line). We can see that although prices are going down, big money are buying. This divergence typically marks an uncoming rally. Something to note is that although the SMI is going up, there isn’t a bullish divergence looking at the 2 recent bottoms. Maybe this is just a false signal, but it’s something to note that big money looks like they’re buying the dip.

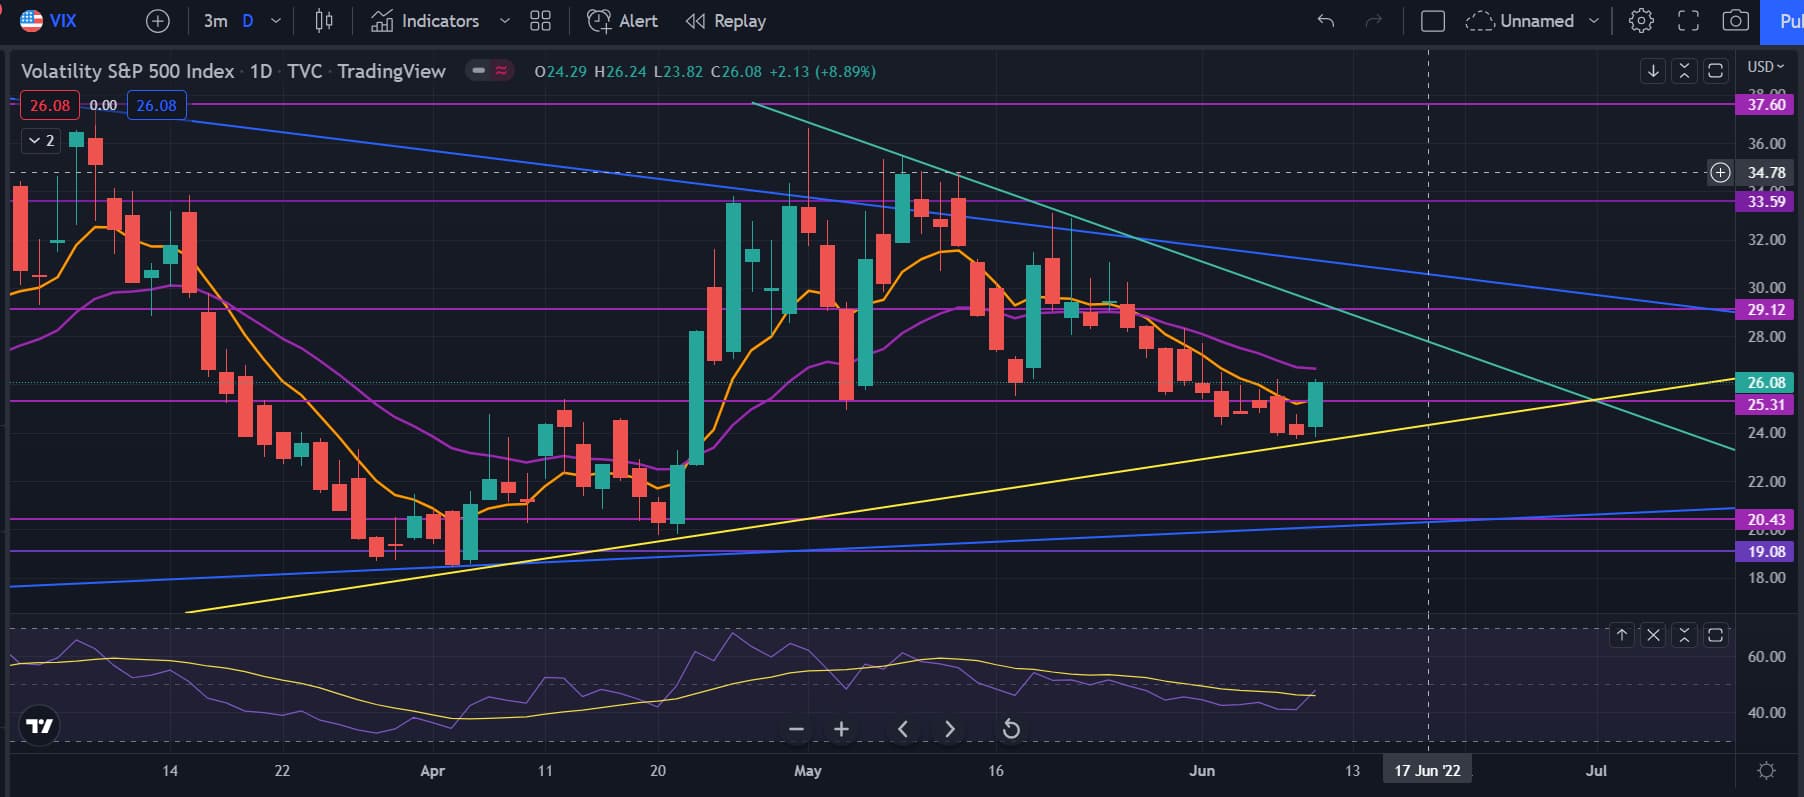
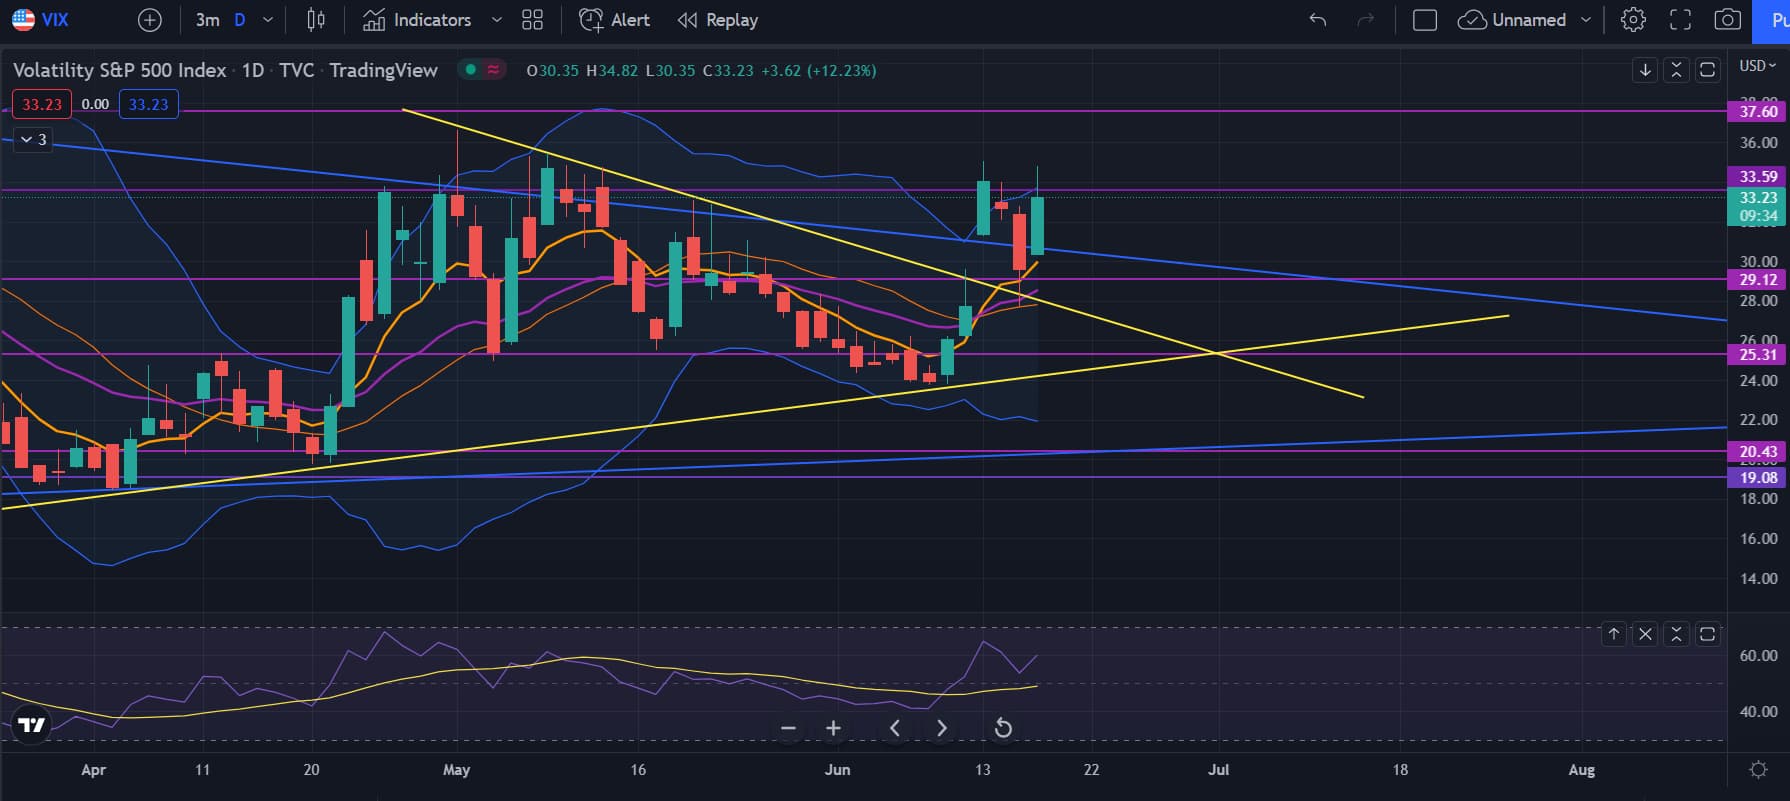
The VIX got crushed again, but it’s right at the trendline. I do expect it to bounce from there and if there is to be a rally, I expect it to make a lower high than it’s previous 2 highs. If not, then I’ll start to reassess whether a rally is to come soon. Looking at the trendline and the 8 EMA, I would expect VIX to try another high and then form an upwick showing bullishness if a rally is to happen. One thing to note is that the VIX still isn’t spiking and holding above 35 which makes me hesitant that we’re in a recession or about to tank to the depths of hell.

The 10 year yields currently has 2 upwicks and is looking bearish. It’s looking like it’s going to continue to roll over and give markets the boost it needs.

The dollar is up massively which is worrying, but we’ll see if it continues to track down as it’s still down overall for the week and was near a strong support. As the yields and dollar comes down, it should give markets the fuel and boost it needs to have a rally, but I want to see further continuation of them rolling over to confirm that this isn’t just a pullback.

Put call ratio is strangely showing that less puts are in the market. Whether we see another spike will be seen, but it’s interesting that puts are exiting the market, possibly marking the start of the bottom.

Something big to note is that oil such as crude oil and natural oil are rolling over hard right now. Is this possibly marking the peak of inflation? Who knows, but the markets seeing oil rolling over should give a big positive sentiment.

Overall, these indicators are showing a possible rally as the things that put markets in a tight situation (yields, dollar and oil) are starting to roll over and possibly confirm tops of these. If on Tuesday, we see these indicators continue to roll over, I’m going to start to build a call position as I expect a huge short squeeze rally like in March and the last 2 rallies from the 380 level.

The summarize, charts are looking bearish and because of Powell speaking and no rally on quad witching, I’m going to expect Tuesday to be red and then starting from Wednesday/Thursday, I’m going to expect the start of a rally, assuming that the other indicators continue to roll over. Even if we’re in a bear market and a recession, most of these huge bear market rallies start from the 200 MA on the weekly so we should be starting to expect a rally rather than a 50% crash from here.

5 Likes

TLDR: I expect SPY to fill the gap to 402ish before a pullback, but I did expect SPY to make a new low during the Fed meetings before rallying so idk at this point.

So I took a break because SPY was acting weird asf and I just needed a break. Anyways let’s look at my retarded gay tech anal.

Looking at the hourly, we are overbought. But during these short squeeze rallies, we stay in the overbought territory for a day or more so I still think we still might have enough in the tank to fill the gap above before we pullback. MACD is back in positive territory which is bullish and the 8/21 EMA are looking bullish. The big resistance to break is 390 and then 395 before the gap fill to 401-402.

The daily on SPY did have an inverse h&s and it did play out. Friday had the follow through day where we had a huge green day with volume higher than the previous day. This is bullish and showing signs that bulls are back in controls for now. We are still in a downtrend so until we start to make higher highs and higher lows, we should still be looking for dumps. We are above the 21 EMA on the daily which is a great sign because everytime SPY crossed the 21 EMA, we did have at least 1 day going further up. I think this one day will be enough to get to the 395 level to potentially gap fill. Who knows what will happen, but when looking at the price target of the inverse h&s (drawing line from head to the neckline and then the same distance from the neckline above), the predicted target is the 402 area which is the gap fill. Some things to note is that the MACD still hasn’t had the bullish cross and the RSI is still below 50 which is bearish. Overall, looking bullish, for at least 1 more day.

Looking at the weekly, still bearish, very low volume and not at 8 EMA yet. Maybe going towards the 8 EMA before turning back around. Something to note is that the MACD and RSI no longer has a bullish divergence, so maybe we have another dump to form a bullish divergence or just a higher low.

VIX is now testing the yellow triangle, but I doubt it bounces from there. I think it might start to bounce from the bottom yellow uptrend. Overall, VIX is looking bearish, but there are some big uptrend lines that it’s nearing that it could bounce off of.

Yields were up today, which is not good for stocks, but it’s still on the downtrend so it could just be forming a bear flag. Or maybe it spikes up again for whatever reason.

Dollar is still consolidating so nothing to really say other than once it breaks to either side, it should be massive and I would expect it to confirm the SPY direction that way.

PCC shows a lot of calls entering the markets, but not yet at the level where we can expect a top. We’ll see how Monday goes and if it continues to say that more calls are entering the markets, it might be time to start a put position, whether that means we make a lower low or a higher low.

Crude oil is currently dying and forming a bear flag. Oil coming down hard will be bullish for stocks and further signs that inflation might have peaked. We’ll see if oil just decides to retard rally up again. But if oil continues to track down, it could be signs that the next CPI might be really good and time for markets to rally.

Finally, something to note why I think we’ll see some more upside is that the smart money flow is still tracking up. If this was rounding over, I would have said that SPY would go down, but because the smart money flow is still climbing, I’m going to assume that Monday will be further green.

Overall, signs are showing bullish signs for the short term. Looking at the SPY daily, we could retard rally to form the head of the bigger inverse h&s and then track down to form the right shoulder. Where the neckline will be is unknown because it could be a slanted or a horizontal, so it’s just time to wait and see signs of where SPY will start to top. Some good signs are showing, but not super bullish because yields and dollar have stopped their move downwards. Overall, I do expect a rally to at least 430-440 as during bear market rallies, we bounce around the 200 MA on the weekly and go to the 50 MA on the daily. I do think there will be a better buying opportunity so I’m gonna wait for that and maybe regret my life choices of not buying here.

5 Likes