SPY Tech Anal: Santa Rally or is he bringing coal

TLDR: I personally don’t think we’ll see a drastic drop this week and markets are gonna dick around until next Tuesday/ Wednesday for CPI and FOMC

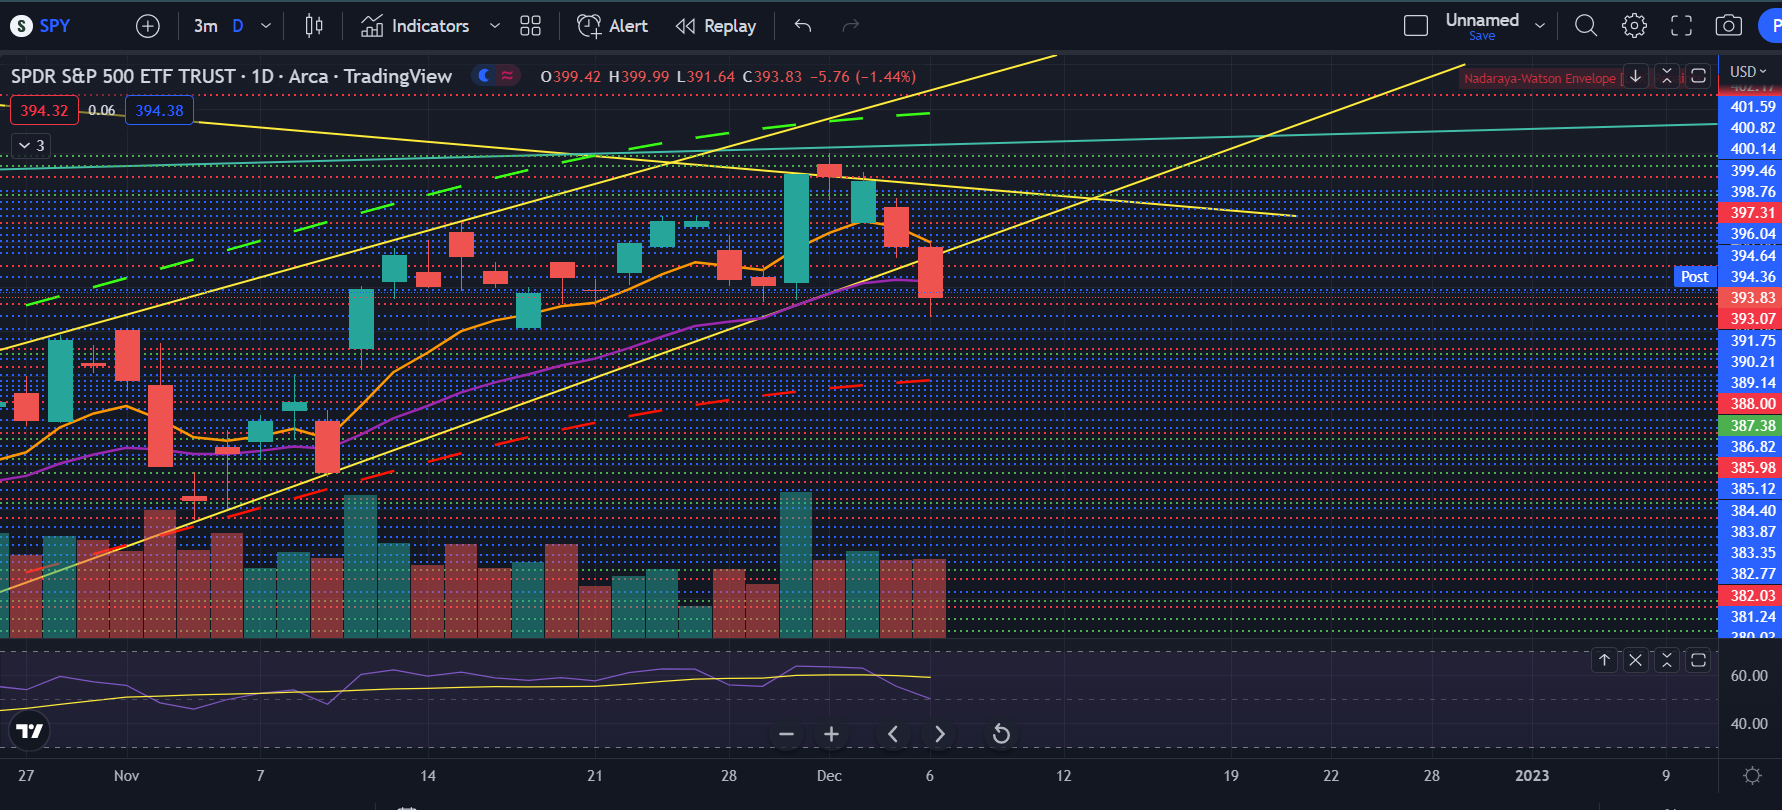
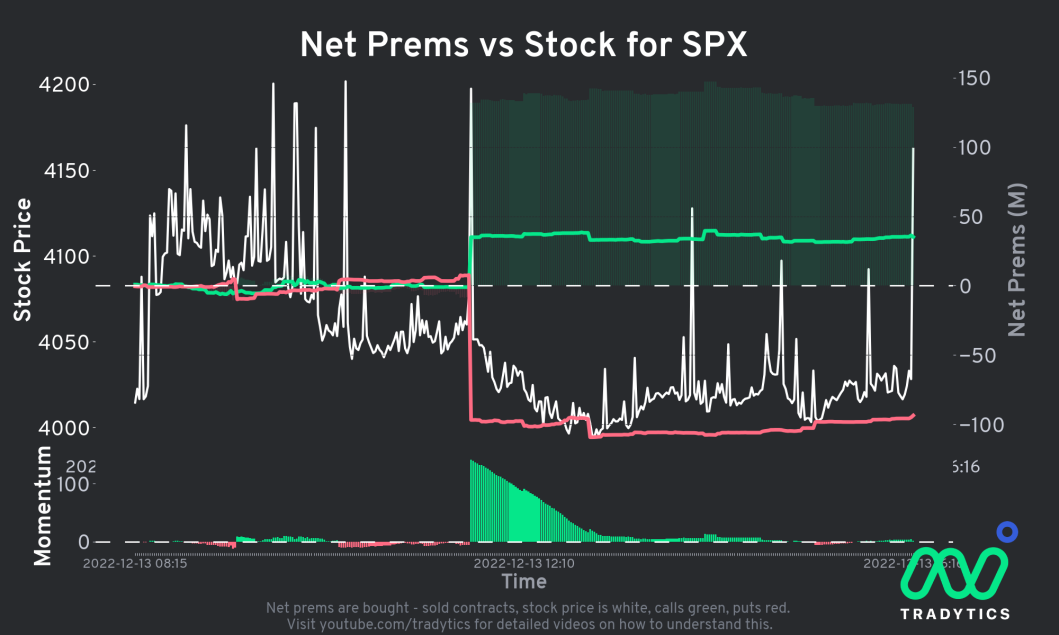
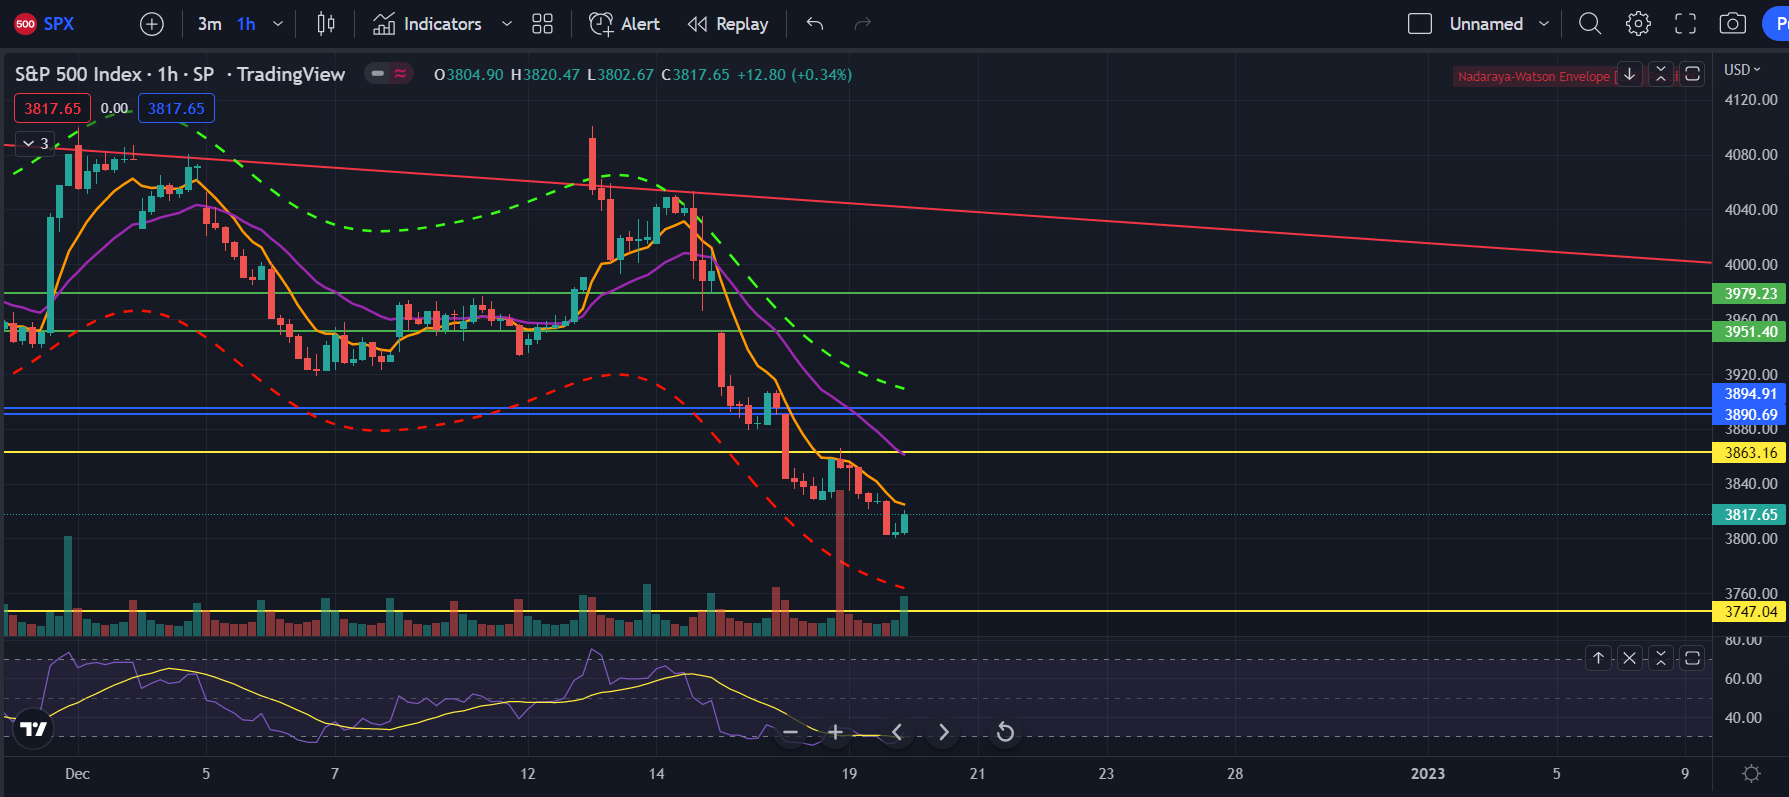
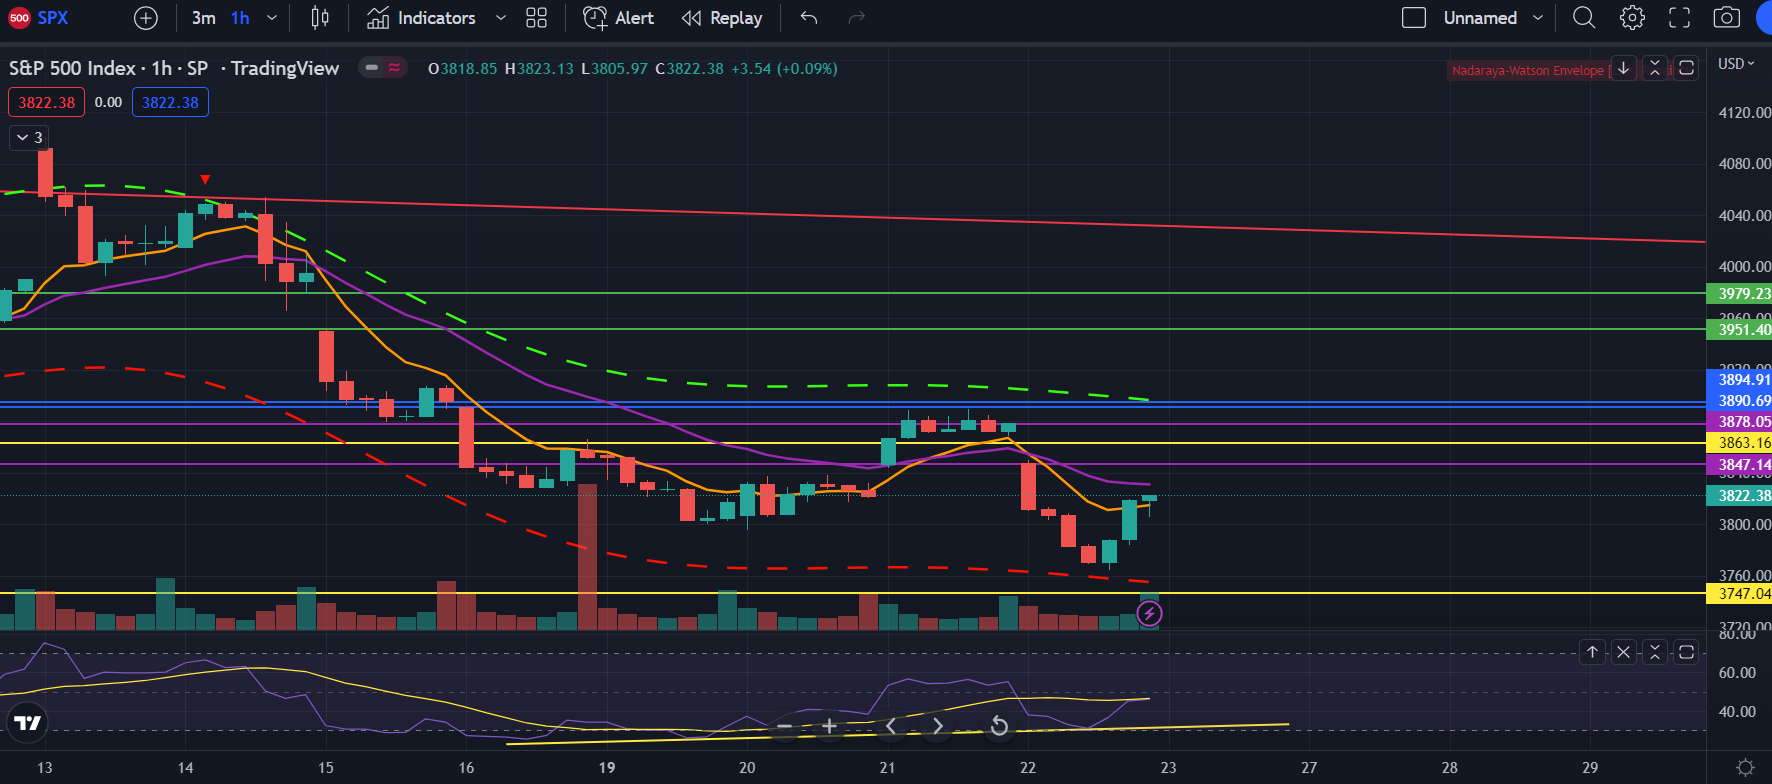
SPY on the hourly broke below the 2 EMA lines and is just drifting lower. We did move up a good amount in AH, maybe just a retracement. I am looking for a bullish divergence to set up on this wedge and dick around in the 398 - 410 range for a bit. Anyways, seems like a change of trend, but we’ll see if this move is with conviction and bust through the wedge.

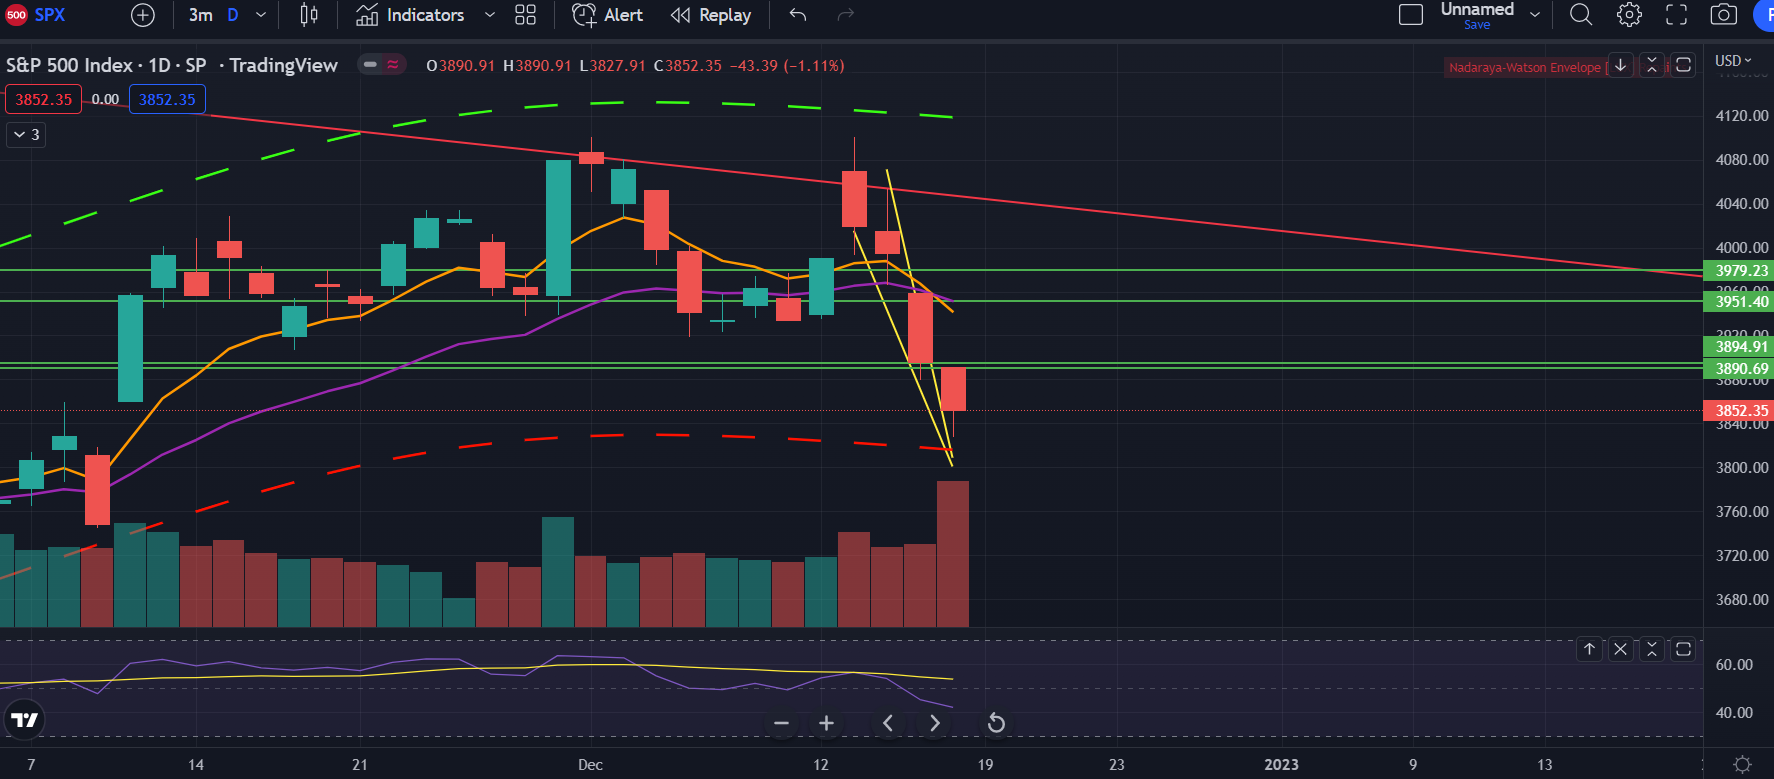
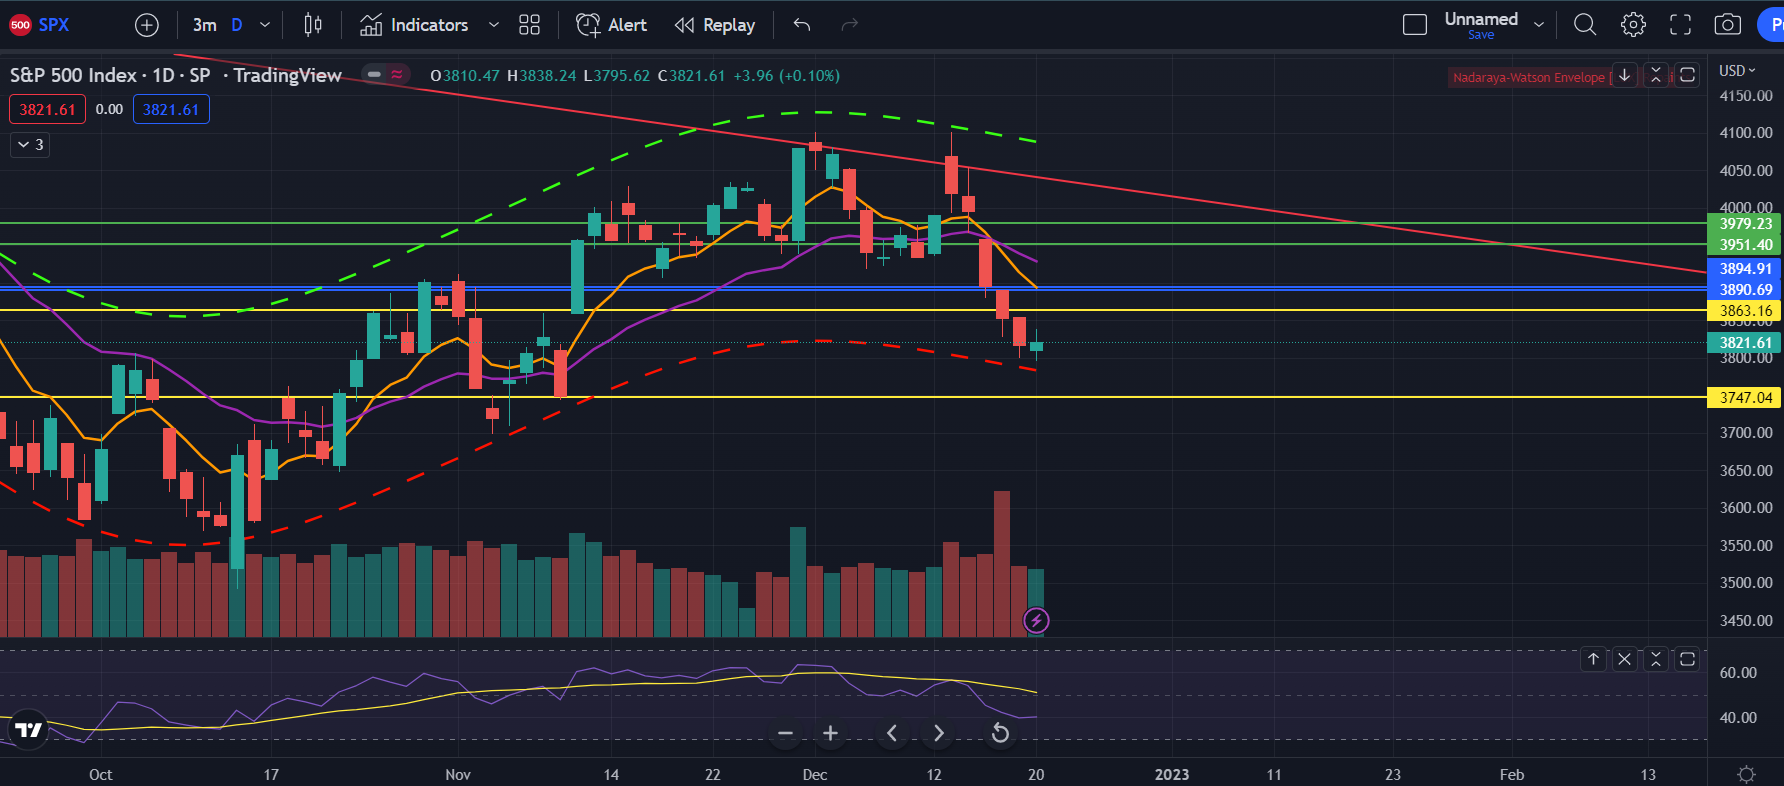
On the daily, we can see the wedge that we’re in right now. One reason that I don’t think we’re gonna go dicks down is because the volume profile. We can see the huge volume point of control right near the bottom of the wedge and the 21 EMA. Good supports there and I think there are buyers lurking in this area as there are good amount of wicks here. I am personally I think that we’ll bounce off near here and then set up a lower high to get dicked down with news but who knows.

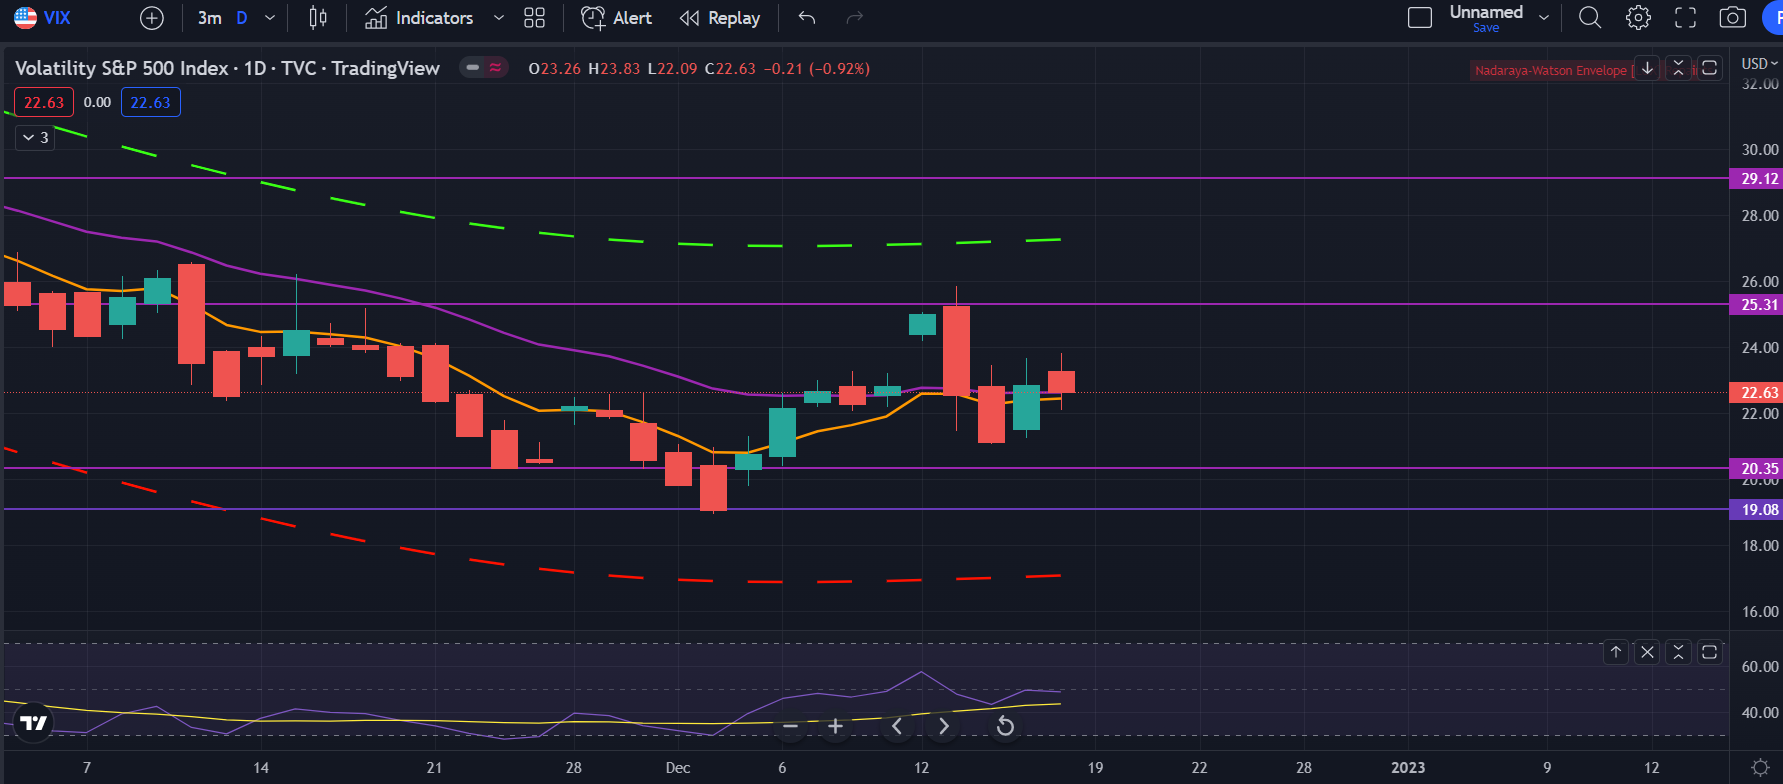
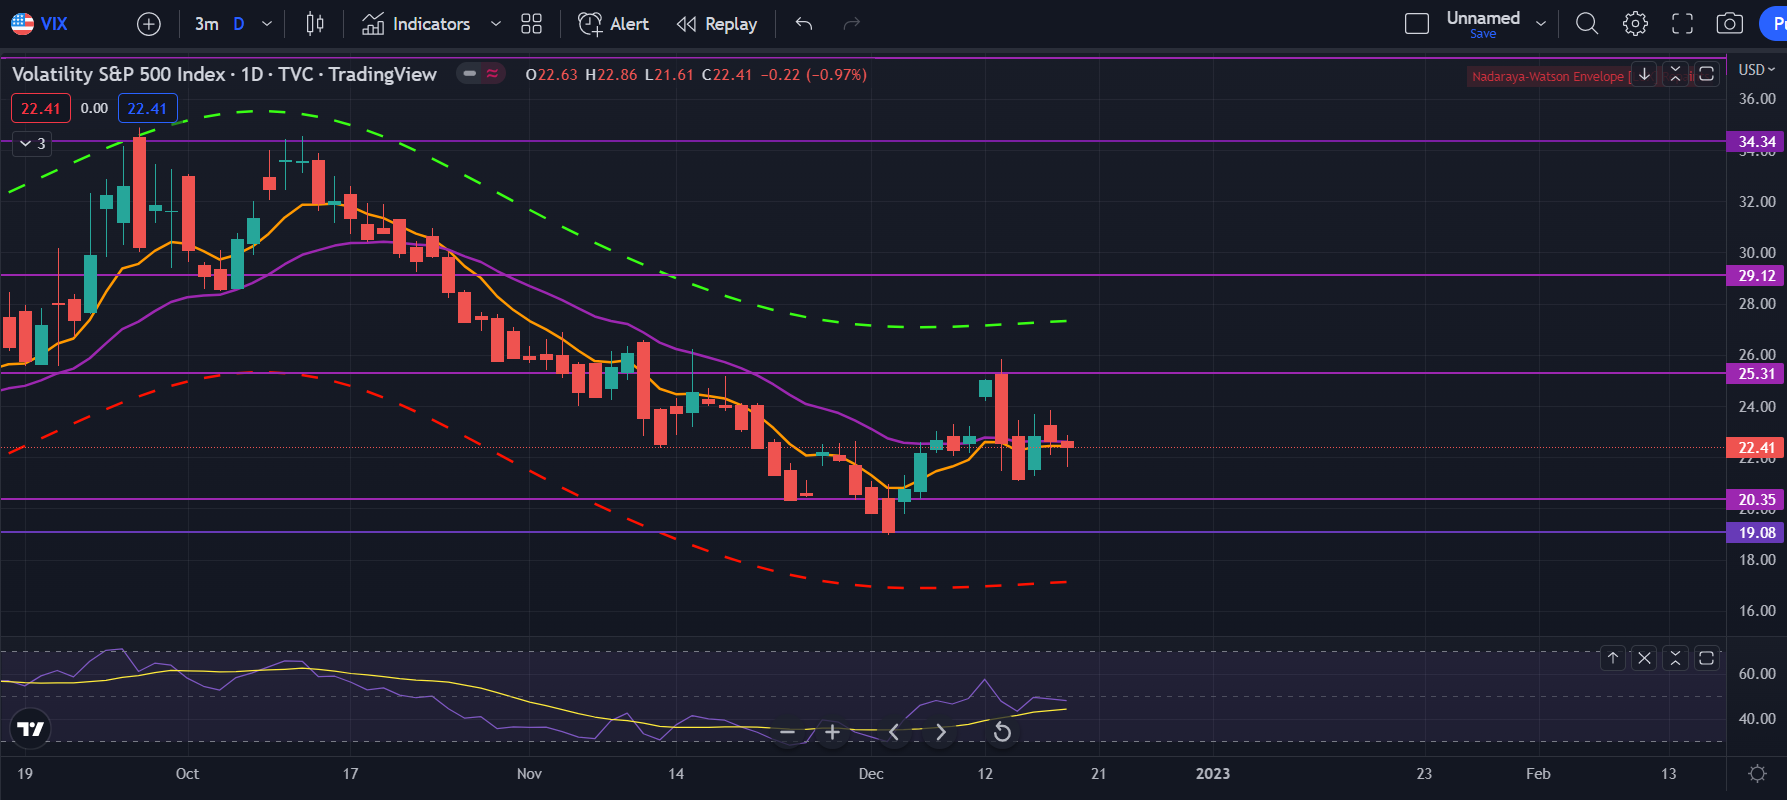
Not much happened in the other indices such as the the 2 year and dollar, but those are looking like they want to turn up while VIX is looking like it wants to turn up too. All bearish signs and I wouldn’t be surprised if we do break down the wedge tomorrow and drill to my asshole, but again, non real strong moves to really warrant that.

Overall, I am bearish, but I am waiting for a lower high to set up in this wedge before breaking down. Good luck all

2 Likes

TLDR: More downside to come, although my dumbass is still waiting for some kind of lower high to set up to re-enter lmfao

So on the hourly, SPY chose coal for december. It’s just been drilling all day. I want to see a retest of the 21 EMA or the downtrend line, which I think might come. Or we might go lower from here to like 390 to set up a bullish divergence to get a lower high. Whatever happens, I expect us to keep heading lower. We broke through large volume levels and doesn’t seem like bulls are entering back anytime soon,

On the daily, it’s another solid volume day of selling. Broke below the uptrend line and the 21 EMA. Looking at the volume profile, volume really starts to come back at like 388, so there’s a chance we don’t get a rally to set up a lower high until 388, which would be another around 2% move down. Either way, seems like it’s looking very bearish for SPY right now.

VIX is looking to break out too. Another day of 1-2% red day would probably confirm this move as us setting up the next leg lower instead of this just being a pullback to the next high. Interesting to see.

Not much else happened in the yields and dollar.

Overall, seems bearish and my dumbass is still waiting for a lower high to set up to enter puts or we’ll just elevator down to hell before I can re-enter. Good luck all.

2 Likes

TLDR: I think we’re gonna go head towards 388 before setting up to make a lower high. If I’m wrong then fuck me. But if I’m right then fuck me.

So on the hourly, we tested the 21 EMA and then got our assholes fucked by bears. What I’m looking for right now is for us to break out of this wedge/ triangle. I personally think that we’ll break to the downside (if you remove the extended hours candles). What I think will happen is us heading towards the 388 level to set up a bullish divergence to have a rally off of into CPI and FOMC. Or we can just dick around and stay flat until then I don’t know. Either way, RSI got rejected at the 50 level and SPY got shot down at the 21 EMA, so I don’t think that we’ve bottomed just yet. I’m looking for us to make a lower low before we do get a good bounce.

Now looking at the daily, we’re in a zone where there isn’t much volume until 388. If this means anything, it should just mean a smooth ride to 388 once we break 392. Volume starts to come back at the 388 level, which is around where I expect us to bottom, maybe a little lower at like 386 where there is more volume. Either way, looks bearish on the daily and for the lower high set up, I’ll have to see how low we go, but I don’t think we’re going to test the downtrend line or the wedge we broke out of.

Not much happened on the VIX, dollar and the yields, they’re just kinda dicking around.

One thing I want to bring attention to is the bond market. For some reason, they’re hulk dicking upwards. Is this a potential sign that CPI is gonna come in cool and start a major reversal rally? Or are the bond markets thinking that the Fed will be more dovish? Who knows, but the bond market’s direction usually has been correct this year, so maybe the markets are actually bear trapping people here. Just something interesting to see.

Overall, I am expecting more downside, but just weirded out by what the bond market is doing. Good luck all

6 Likes

Gamma flows are getting interesting again. SPX is at 3933 and vol trigger is at 4000, which means we are in negative gamma territory where movement is exaggerated. As we can see from the SG profile below, there’s a decent amount of protection building all the way down to the 3600 level, and more will likely be added, especially since vol is still low and puts are relatively cheap.

Until next week’s main events (CPI, FOMC and opex), it is likely that positional flows will play a key role over the next few days, especially in the form of 0DTE options. Once a ton of this gamma comes off next Friday, the market will be free to move strongly based on CPI/FOMC. The movement out of this wedge (drawn end of Nov) of the upward and downward trendline and 200SMA should be glorious.

15 Likes

TLDR: I think there’s still some more downside, but there’s really no point of TA rn since CPI and then FOMC is next Tuesday and Wednesday

On SPY hourly, we’re back to the area of strong bounces beforehand. We’ll see if we continue to break through, which I personally think that we will. We’re not able to hold above the 21 EMA and sell volume is high.

On the daily, there was an uptick of sell volume along with an upwick on the 8/21 EMA. I think this is a sign that Monday might be another risk off day, but we’ll see what happens. I personally think that we make a new low on this downtrend but we’ll see.

Overall, seems like Monday is gonna be another red day, but we’ll see what happens. I’m personally not gonna bother doing TA until CPI and FOMC comes out since those will basically dictate the direction we’ll go. Powell hasn’t really been saying bullish things but markets have been treating them as such. CPI might come in hotter since PPI came in hotter, but we’ll see. Overall, play the news or just stay out of the markets until Thursday

2 Likes

Tl;dr: Vol is elevated, and will likely unwind not after CPI (like the last few times), but after FOMC. Opex-related hedging will cause MMs to contribute to market movement until/unless SPX crosses 4000. Extreme caution is warranted during this time.

Indeed. And boy is it shaping up to be a potentially explosive week.

There are a couple of things that are making for an interesting setup.

First, there’s a monster amount of delta expiring on opex (12/16) - 40% of SPX delta notional, worth 760B. This will have to continue to be hedged over CPI and FOMC, resulting in 10’s of billions of dealer flow, which will impact markets. (The exact amount depends on the gamma hedging needed, which depends on where strike is, DTE etc. so handwaving here a bit.) We’re also in negative gamma territory, so MMs will exacerbate any movement, positive or negative, until SPX 4000.

Second, as expected, SPX options have elevated vol for CPI (12/13) and FOMC (12/14). Barring a really bad CPI report or JPow doing 75bps, this vol will unwind, like a tightly wound coil that got released. Vol unwind is a strong tailwind and will cause markets to rally. (SS from this YT video; worth checking out…)

What makes this time different from other CPI releases is, we have FOMC back right after. So vol is likely to remain high into FOMC. Which means the moves will likely not be as explosive as Nov 10 (Oct CPI release), or Oct 13 (Sep CPI release). Note that on Oct 13, the CPI data brought the markets down but the vol unwind still brought markets right back up. (Using SPY to show PM as SPX doesn’t have that.)

SPY, Nov 10 (Oct CPI release):
image

SPY, Oct 13 (Sep CPI release):
image

This means FOMC will likely see the actual vol unwind event.

Market is pricing all this in - it sees strikes between 3700 to 4200 as almost equally plausible. :sweat_smile:

To tie it all back to opex, whatever the movement is will require MMs to hedge accordingly. Imagine the additional contributions of MMs on top of what has already proven to be very volatile events. Only if SPX goes above 4000 will markets calm down a bit.

This is all to provide additional color to what Yong said above:

There is an incredible amount of uncertainly going into the week, and there is the potential for violent whiplash. These are the conditions that reap great returns or blow up accounts. May the odds be in your favor, if you do decide to front run these upcoming catalysts! :pepepray:

17 Likes

Event vol associated with CPI/FOMC is swelling up.

5 Likes

Not gonna bother posting TA until like Thursday - or maybe until EOW cause CPI and FOMC will determine trend. Also cause I have finals so I am busy

8 Likes

Good luck on finals. Remember every third answer is always B.

5 Likes

I was gonna post something but seems you largely beat me to it!
Only thing as well I’m looking at is the possibility of CPI having a surprisingly cool print. With now almost 9 months of post-march rate hikes I think housing rental rates could certainly show some weakness give us a cool print that the market may have showed it’s expecting with Monday’s movements. This would factor into a further momentum acceleration of the fed getting a far TOO BIG reduction in inflation statistics which signals they raised rates too aggressively. I actually deployed some capital today in case this scenario plays out tomorrow as it would definitely signal a few things:

  1. inflation is losing the fight and the market is seeing the rate hikes from March permeating into the different data sources and the most recent hikes may have further exacerbate the inflation data as most charts show the data was already in the “rolling over” point where a big drop follows.
  2. the fed moved far too quickly and will need to be extremely prudent of further rate hikes and the most important factor: the terminal rate. If we get a sharp drop both of those factors are going to be walked back as fast as humanly possible due to factor 3.
  3. the economy right now is still very strong. Even during all these rate hikes the economy has been reacting surprisingly well. The possibilities of achieving a soft landing are accumulating faster than the possibility of a 2008 level catalyst right now. The closest we’ve gotten was Ukraine and the GILT market meltdown. Neither of which spiraled out of control. The globalization of the worlds economy has created supply chain complexities but it’s also dispersed pressures equally amongst all the players. The Fed’s job is to fight inflation, and their second is to create strong economic conditions. They’re not going to crash the economy in hopes of fighting inflation.

These factors together spell a particularly bullish set of circumstances if CPI prints a cool report (we’re talking like 7.0% or lower on the annual inflation rate). If that happens prepare your calls cause we’ll likely get back to back ballon theory types of news and talking points from a lot of parties. The media will have a field day of running the news cycle that we broke out of the bear cycle and now have “blue skies” even if it’s not true. God speed friends

10 Likes

T;ldr: CPI led to 4% spike, followed by 3% drop. 0DTE flows and SPX 4000 magnet likely played key role. Vol has been reset higher for FOMC tomorrow.

Well, that was interesting. After spiking 4% over yesterday’s close on a light beat of CPI numbers (yes, JPM, you can take a bow), it proceeded to fall 3% from open to close, ending the day up “only” 0.7%. And this, with VIX falling 10%! Weird, right?

Once again, things start making sense when we look at option flows. Vol trigger was around 4000 going into CPI. This means anything over, and MMs are damping market movement. It is likely this played some decent role in the grind down once market opened.

Then, 0DTE effects piled in. As SG notes:

SPX 0DTE volume was ~47% of total…nothing new. But the amount of volume as the 4000 put strike was rather staggering: 94,250 contracts traded. This 4000 level is also the largest gamma strike into 12/16 OPEX.

And as backdrop, we have the monster SPX gamma levels at the 4000 level, which perpetually act as a magnet. Not surprising, then, that SPX tested 4000 twice, today.

Now… this is all well and good as retrospective, but how do we trade on this in real time? The closest thing we have are Tradytics. The SPY flows seem to suggest there was call selling more than put buying. And the SPX flows are super wonky - look at the SPX price spikes.

Does anyone have access to any other platform that can assist with this? UW perhaps?

As for what this means going into FOMC… 0DTE effects aside, SPX vol itself is still elevated. Especially for tomorrow. (Sorry for the ghetto Paint job - don’t have a BB terminal, usually skim from others.)
image

So we’ve kind of rest the clock for tomorrow. Will tomorrow end up being somewhat similar, with a spike into close peraps, and then a reversion to 4000 over Thu and Fri?

I am finding the moves violent and unpredictable, so staying put. Best of luck to everyone who are playing this. :pepepray:

6 Likes

TLDR: I expect some kind of rally to the gaps and then go lower

So on the hourly, we broke out of the downwards wedge which is bullish. The RSI is on the oversold readings and during the huge downturns this year, SPX has usually reached the overextended on the RSI and then had some kind of consolidation days/ little rally up before the next leg down. I expect continued selloff after a couple days of dicking around in a range. The green lines are the gaps formed in the last couple trading sessions. I expect the first gap to be filled and the gap higher up is who knows. I don’t think that there will be enough buyers to bring it up that high, but we’ll see if we get rejected at the gap or fill the gap and then shit lower.

SPX on the daily shows increasing sell volume, not showing good signs for bulls. Also broke all the upwards momentum. Double top, breaking below 8/21 EMA, and the 8/21 EMA crossing over. Seems like we’re going into another downtrend, but we’ll see if this is a bear trap or not.

Now on the weekly, it’s showing a very bearish candle pattern. Huge upwick on the weekly and rising volume on the sell signal on the huge downtrend line. Also turned off the 50 RSI again, which is not good. The entire year, we’ve basically gotten dicked down on the 50 level on the RSI. We’ll see if we get another huge dick down to from a bottom or not. But the weekly is looking very bearish.

VIX is just dicking around which is strange to see. Maybe a sign that this is a bear trap? I would expect the VIX to start surging with this sell off but it’s just dicking around. We’ll see if the VIX starts to surge showing that we’re going to make another leg down.

Now on the junk bonds, it’s making a higher high instead of a lower low like SPX. This is showing a bullish divergence, potentially showing that we’re going to have a bounce soon. This makes sense looking at how the VIX isn’t surging and we’re oversold on the hourly and that has typically been the points where we have a countertrend rally this year.

Overall, I think that we’re going to get some kind of rally to set up a lower high before getting railed to another leg lower. But we’ll see how long it takes for the markets to set up the lower high and then get railed down since this year has been like 1-2 weeks of dicking around, setting up a lower high and then the sudden 3-4 days of hella strong downtrend days. Good luck everyone and don’t get whipsawed around

8 Likes

TLDR: I’m still saying the same shit. I expect some kind of rally unless we keep getting -1% days. Then I’m gonna go to the back of Wendys and start giving out footjobs for $1.99

SPX on the hourly honestly seems like we might go even lower. We’re currently in the gap fill area on the 2 CPI reports ago when we shot up to the moon. Maybe we fill this gap and then start back up, but we’re also at a big support level where we had lots of activity at this level. I don’t really know if we would actually be able to rally up after breaking such a big support, but we’ll see. Not really a bullish divergence either here, so we really could have another -1% day tomorrow to fill the gap. Either way, looking bearish.

On the daily chart, we’re nearing the oversold reading on the LED indicator. Volume did fall off a little, but it’s still pretty high esp for the holiday seasons. Daily looks bearish and the next lower high that I expect to set up is probably to the blue gap fill because I don’t think there are enough buyers here to make SPX rally up much higher than that.

Another reason why I see us rallying soon is because although the markets are selling off, the VIX isn’t rising higher. Not showing strong signs that we’re going to continue on lower in my opinion.

The junk bonds are kinda not showing the bullish divergence, but it’s still not much lower than the previous lows, potentially still showing that we could have a rally soon.

The yields and dollar are kinda just dicking around to the right so not much to see.

Overall, I still see a rally incoming soon and don’t see much more downside on this leg down. Or inverse Yong again and we have a circuit breaker tomorrow.

6 Likes

TLDR: I still see some more upside, but I think that the upside will be very muted than what I expect as the price action today showed that there are like no buyers here and we’re just dicking around.

Now on SPX hourly, we’re not even tapping the 21 EMA and looking like we’re going to get rejected on the 8 EMA. Throughout this entire downtrend, the RSI has turned up to the 50 level before turning back down to another lower low, but not that much lower. When the RSI goes back to the overbought range, we make a significant lower low. Right now, it looks like the buyers aren’t able to take SPX much higher and the RSI is just gonna go tap the 50 level before SPX heads to make a new low. Maybe to fill the rest of the gap left behind on the CPI report. We’ll see what happens though.

SPX on the daily really doesn’t show much here, unless this is one of the first days where we form structure to make the significant push higher or the typical 5-7 trading days of dicking around before the leg down. We’ll see what happens, but right now, it seems like we’re on pace to make a lower low in my opinion. Too many stocks are weak right now, especially Apple. But on the flipside, lots of stocks are oversold right now and we are looking for an oversold bounce around here.

Another reason why some upside is likely is because the VIX is tanking lower. Not a good sign for bears who are looking for more downside right now. It’s interesting to see the VIX be super muted.

Overall, everything today seems like it’s starting to form a structure for a bottom or have us dick around for the next week before we make the significant leg lower. Either way, I expect us to continue on lower, but I’m looking for the next good entry. Good luck all

5 Likes

TLDR: I’m gonna guess more upside from here, but we’ll see what happens.

So on SPX hourly, we basically consolidated for the second half of the day after the big push up. What doesn’t give me a lot of confidence is how we got rejected right at the gap and we weren’t able to fill it. Shows that sellers are strong here and potentially that we’ll get dicked down, although I don’t think the chances of that are too high. This feels more like a consolidation for a breakout. Hourly is starting to turn bullish with the crossing over of the 8/21 EMAs and the RSI holding above the 50 level strongly.

SPY on the daily looks kinda weak, but also need to see the next candle to really confirm or deny the move. We did get rejected at the 8 EMA, gap fill and the 50 level on the RSI. Volume was still there which is good to see, but I’d like to see tomorrow be another strong up day to confirm that we’re going to the next gap fill area which would be 3950-3980 or 394 to 399 on SPY. Honestly just looking for confirmation on SPX here, but leaning towards bullish.

The VIX came down hard again which is good to see for bulls. Only bad thing to see here is that it’s at the 20 level which has been the level where tops formed during the last year. Interesting to see if the VIX starts to turn up here marking the top of this Santa rally or if it heads down lower.

The yields aren’t doing much other than the 10 year spiking up due to Japan saying that they’ll raise rates now. The dollar is on a continuous downtrend, but not a strong one, just bleeding out. Interesting to see what happens.

Overall, I do think there’s more left in the tank for SPX to run up more for better put entries. Good luck all and don’t get blown out

4 Likes

TLDR: I’m bullish on SPX because I believe in Santa and I have been a good boy this year, so no coals.

So on the hourly for SPX, a triple bullish divergence has formed on the RSI and a regular bullish divergence on the MACD. These are some bullish signs, especially seeing the reversal this afternoon. We also managed to fill a gap, but left another gap above. We still haven’t filled the gap fully below, but I don’t think we’ll come back to fill it right now, maybe on the next leg down. Right now, I’m looking at the upside with filling the 2 gaps above and maybe getting to the bigger gap at the 3950. Solid buy volume coming in and some strong green candles which makes me feel bullish.

On the daily, we formed a hammer candle and a bullish divergence on the RSI. Volume ticked up, maybe showing signs that bulls are stepping in to buy here. Either way, we’re in a downtrend and I’m expecting a lower high to set up. I’m looking at the 21 EMA or the green gaps as targets for the lower high before we get the next leg lower.

VIX got a big upwick and shot up at 20. Maybe a good trade would be to take VIX or UVXY calls at the 20 level. But, since the VIX isn’t soaring past 25, I think that there’s a good chance we can have a santa rally.

Additionally, the junk bonds didn’t make a lower low like SPX. This is a bullish divergence and potentially signaling that there’s upside coming soon.

Overall, seems like markets are showing bullish signs with the bullish divergences, but we’ll see if that actually carries out. I’m expecting some kind of bigger Santa rally, but not to the point where we see a higher high coming in

6 Likes

Got this TA on JPM collar from another discord channel. Any thoughts?

TA on JPM collar .pdf (500.7 KB)

He seems smarter than me so we could see a very red Friday and then have a nice ass rally next quarter, but since it does seem like this quarter is diverging from the rest, who knows what’ll happen. Since he’s using mostly just past data and not what the stock is doing itself, I’m personally not gonna put too much weight on it, but still very interesting to note.

Additionally, since we are diverging from the expected quarterly trend, maybe it shows that we’re nearing a massive move? Either a big bottom forming or a massive rally incoming? Who knows, but interesting to read

3 Likes