Tl;dr: SG data sound totally be taken with a grain of salt; their bearishness aligns with bearishness in the market; I add my own dose of bearishness on top of everything; fwiw, they have predicted bullish moves in a timely manner too.
Great points, @swoleappa . SG does tend to have a bearish bias these days, and I think I add a fair bit of my own bearishness to it too. They seem better at explaining what happened after the fact, and that can stink of hindsight bias. And my inference drawn from their data last week was almost exactly wrong, and it is virtually impossible for us to end anywhere close to 3700 by opex.
It is always good to question sources of data and I appreciate you pointing this out.
Nevertheless, I do feel like I can rely on their data for a couple of reasons.
While their explanations appear in hindsight, there is a method to them and they do not seem arbitrary. I wish we could use this information for prediction, but perhaps being able to understand is the next best thing. The explanations seem reliable because data subsequently available lines up well. (If this data was available real time, we could predict with them too.)
Option flows seem to have similar levels of impact on market movement as DXY and VIX. Since I study them almost every week, I can say that I’ve generally found them to be aligned with how the market moves. And their findings are aligned with others who study and trade the option market and volatility - they are just the most accessible.
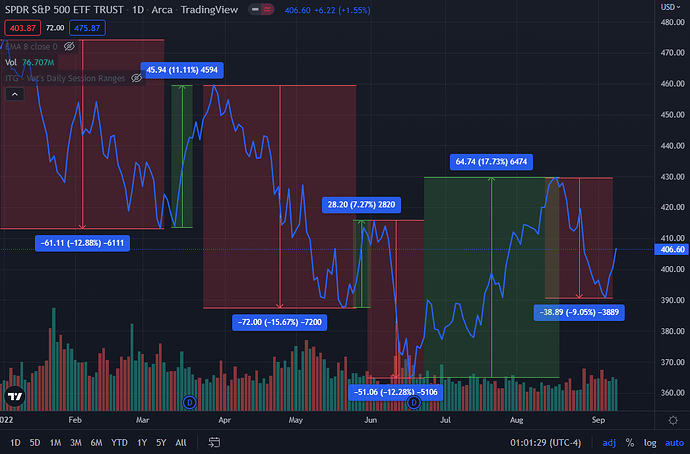
If they sound more bearish overall, perhaps it is because the market has been bearish overall. SPY was down 23% at one point, and are still down 14%. We’ve had more lower highs than higher highs, and the drops have been greater than the rallies.
Now, how do we reconcile this state of affairs with this statement, which we also generally hold to be true:
Here’s the fascinating thing - YTD, SPY had 94 up days, and 79 down days. (My calc.) So you’re right - markets have been up more days than not. Yet, overall, it is down. And that’s because the “down” days have been more pronounced then the “up” days. That SG is able to see the general direction even though more days are against them than not is, I think, admirable.
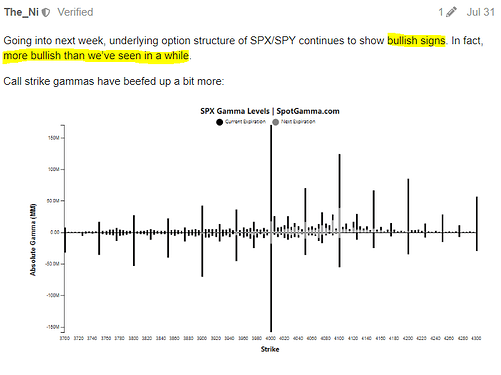
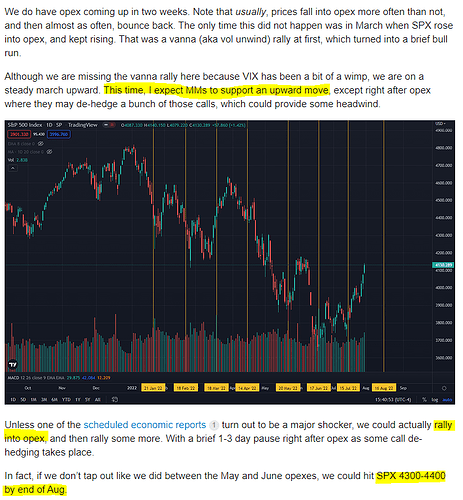
Finally, there are the counterfactuals - they have been bullish at the right times too. We noted at the end of July how the option structure had turned bullish, and I’d estimated a 4300-4400 top by end of Aug. I was off by 2 weeks and we capped off at 4300, but the overall direction was correct for 2 more weeks…
To be fair, as the interpreter of this data, I also contribute to the bearish tone because of my own bearish tendencies in this market. When things don’t quite go as expected, and I go back to the data, I will often realize that my own reading was more bearish than the data was suggesting. It’s been a huge learning process all through, but net-net, it feels like SG is helpful more often than not ![]()


