Shit looks bearish. Actual TA will be done this weekend
5 Likes
TLDR: I think September is going to be a pretty shitty red month.
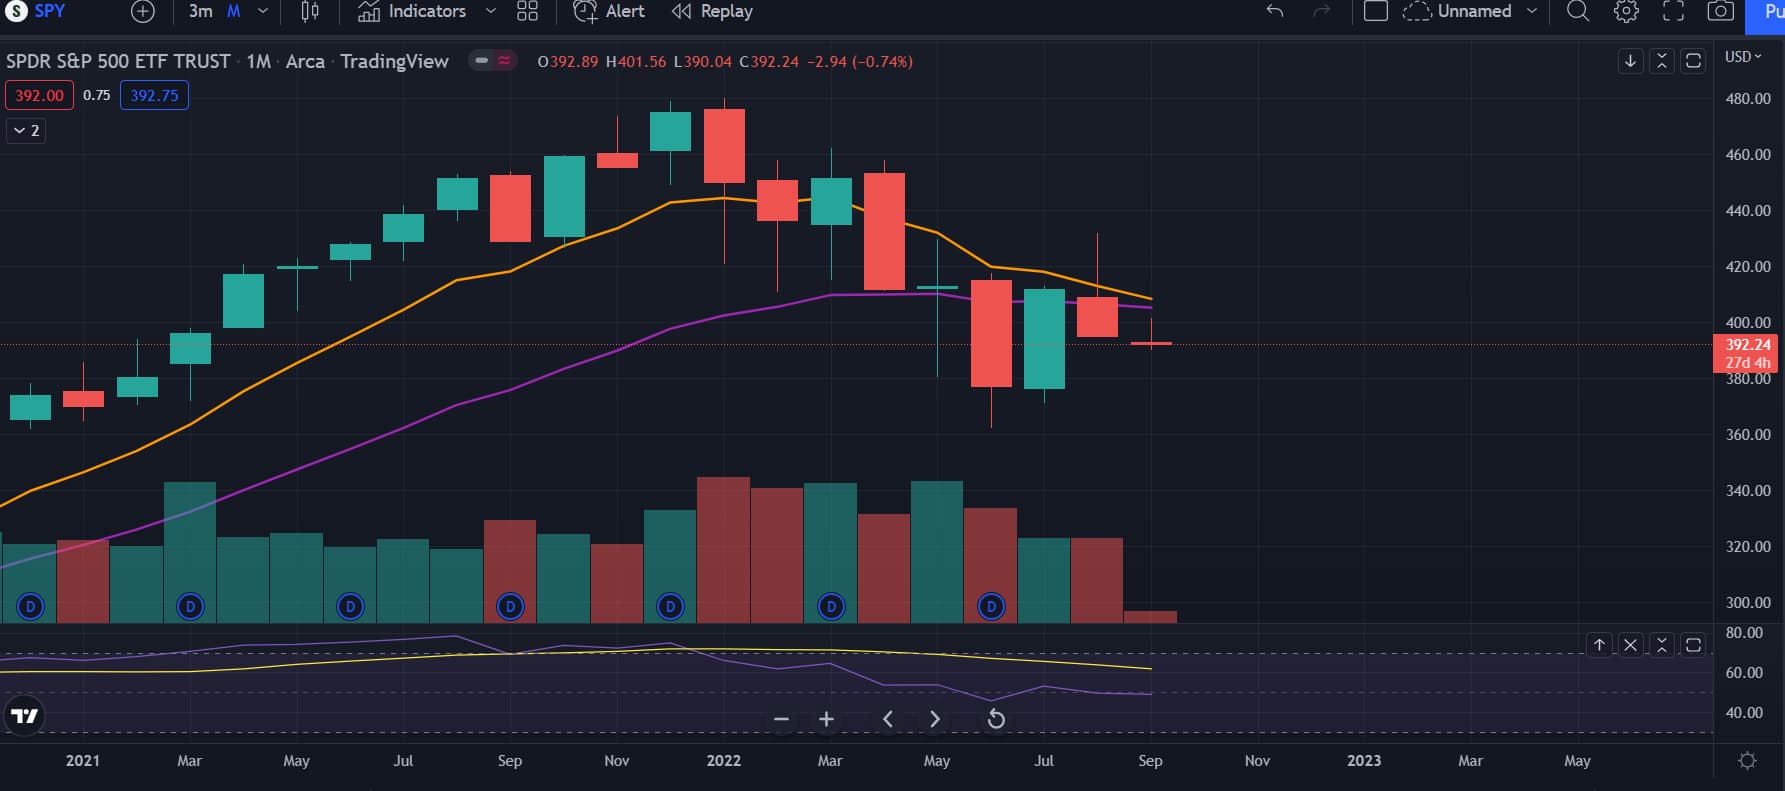
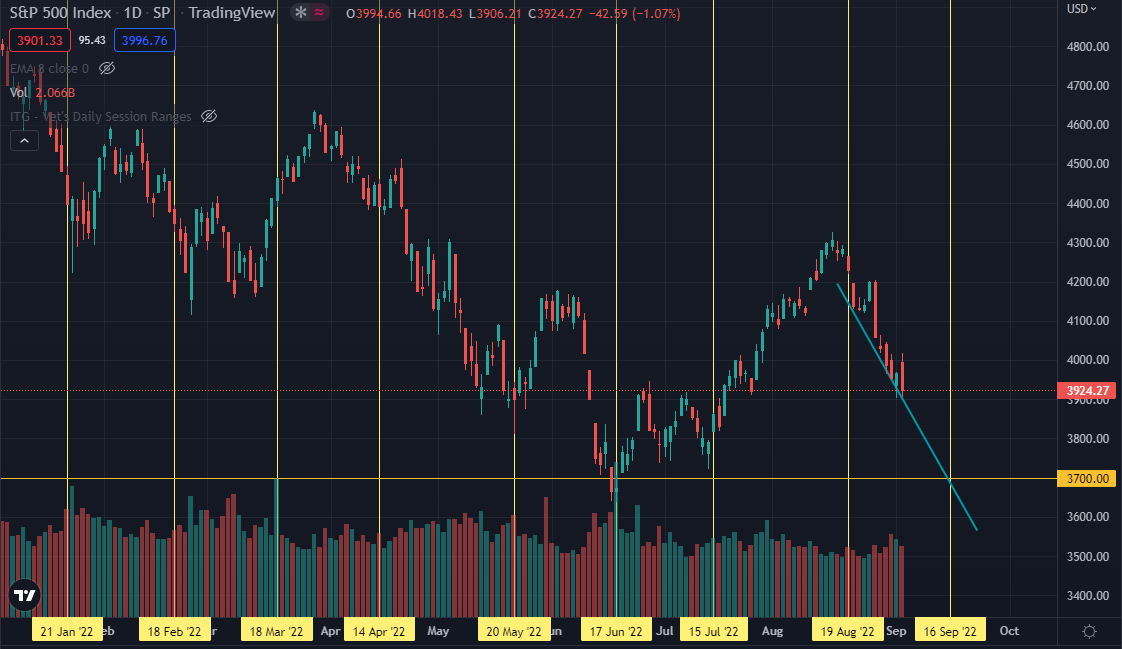
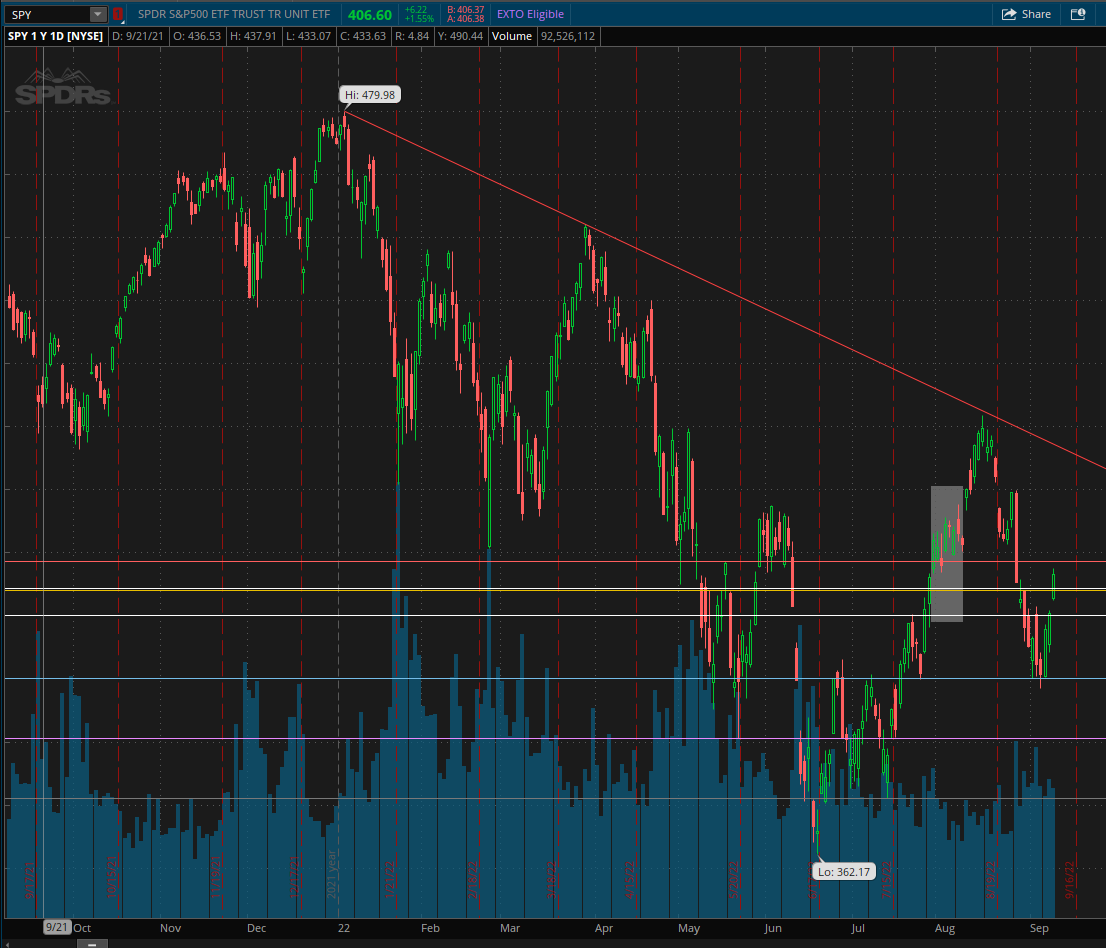
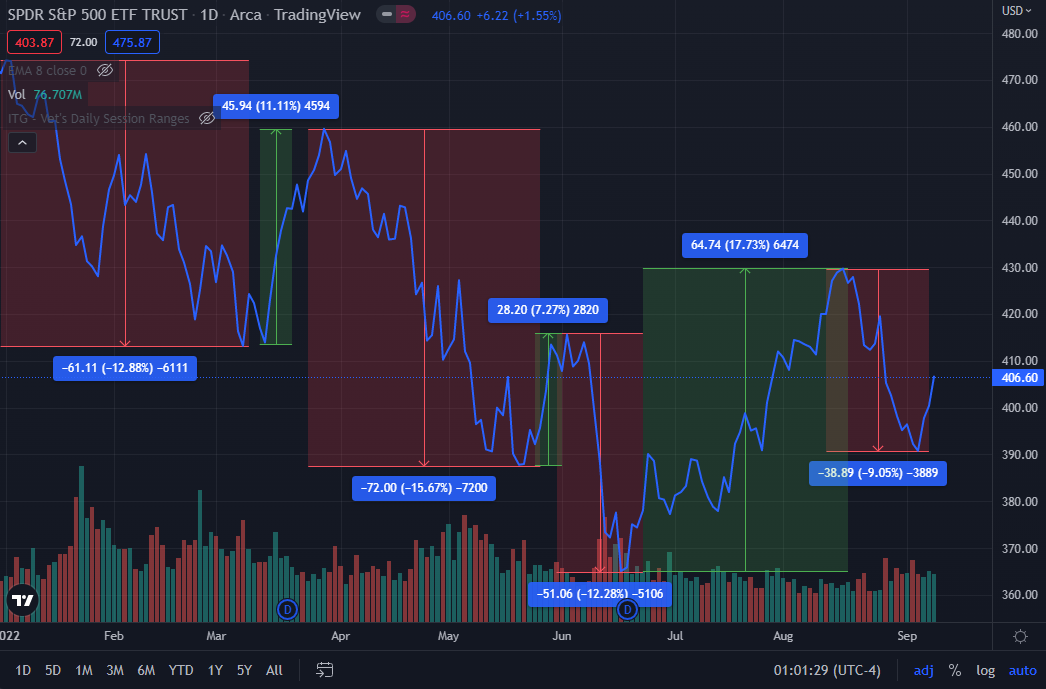
Looking at SPY the monthly chart, shit looks incredibly bearish. We got a strong rejected off the trendline down and got a top wick on the monthly. This pretty much looks like a topping candle on the monthly and looking like there is going to be at least 1 more red candle continuation. So yeah monthly looking like we’re heading in for some pain.
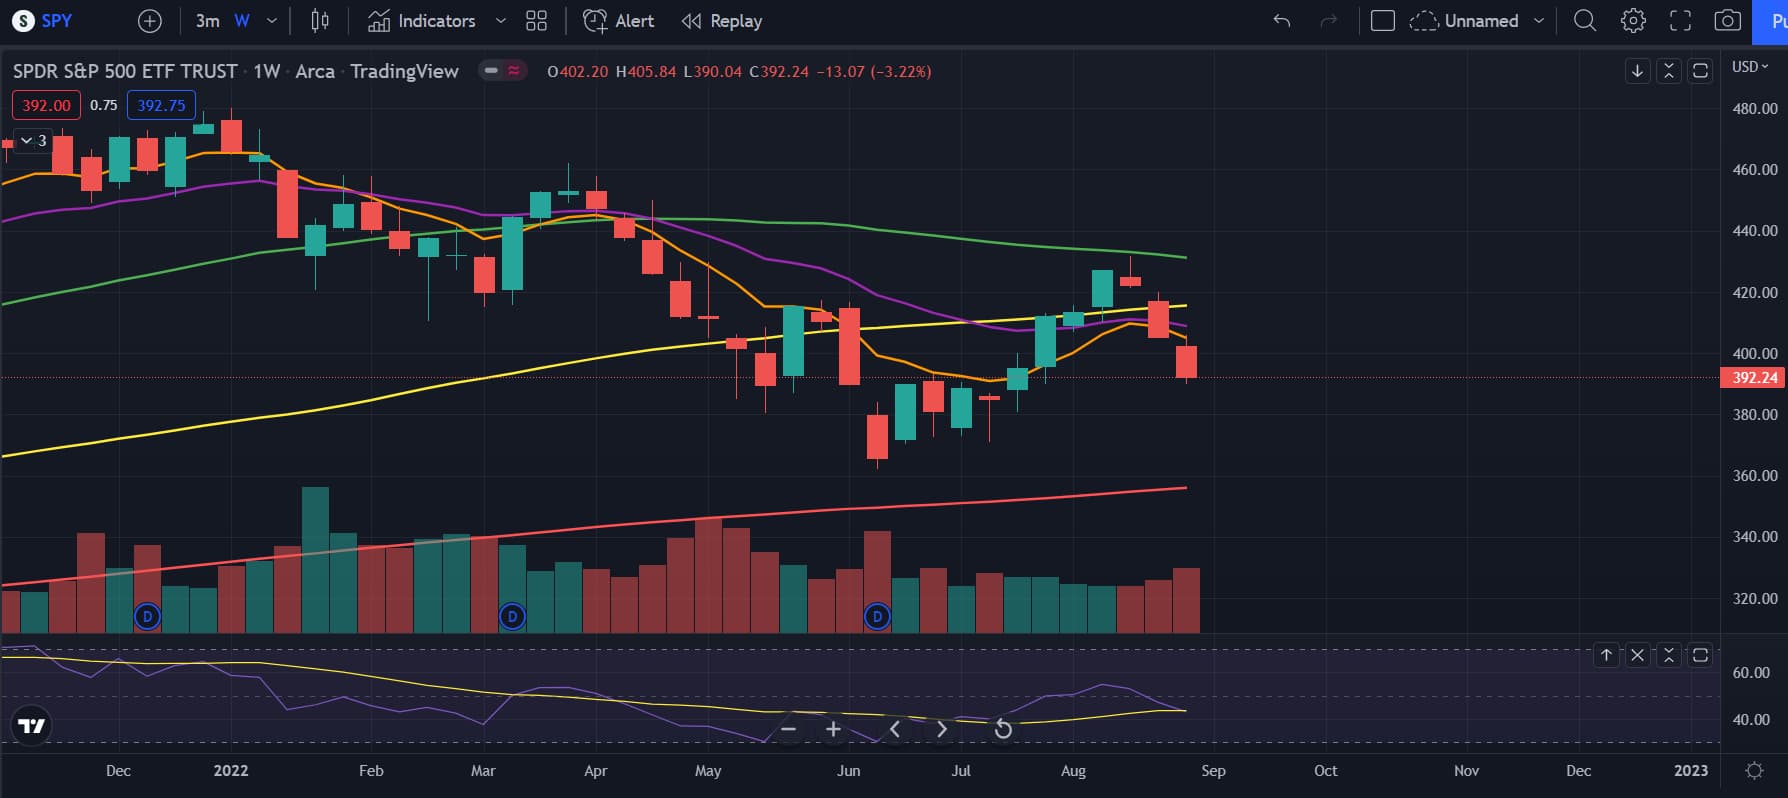
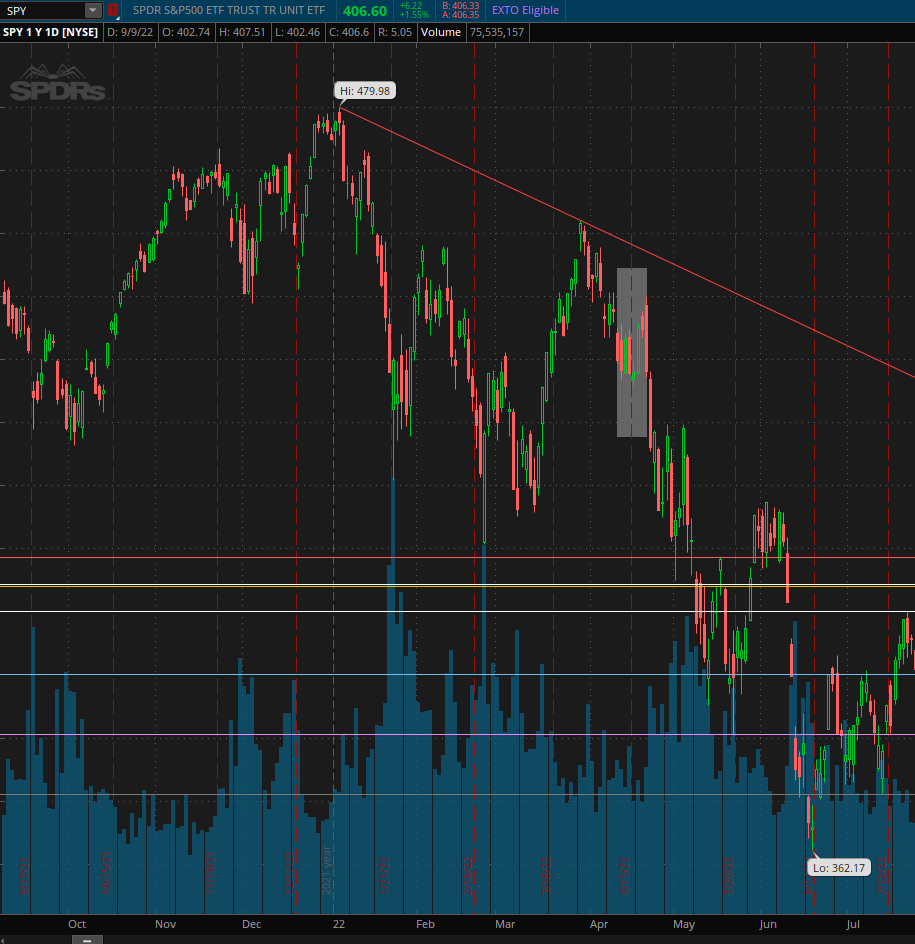
The weekly looks very bearish too. We got rejected straight off the 50 MA which is usually the signal that this bear market is going to continue longer and we’re going to either retest the low or make a new low. The selling volume is increasing every week and we have 3 consecutive weeks of red. I don’t think that’ll stop anytime soon until we actually bottom. RSI couldn’t stay above the 50 level which is also very bearish. Overall, weekly looks bearish and my target is the 200 MA which would be 356.
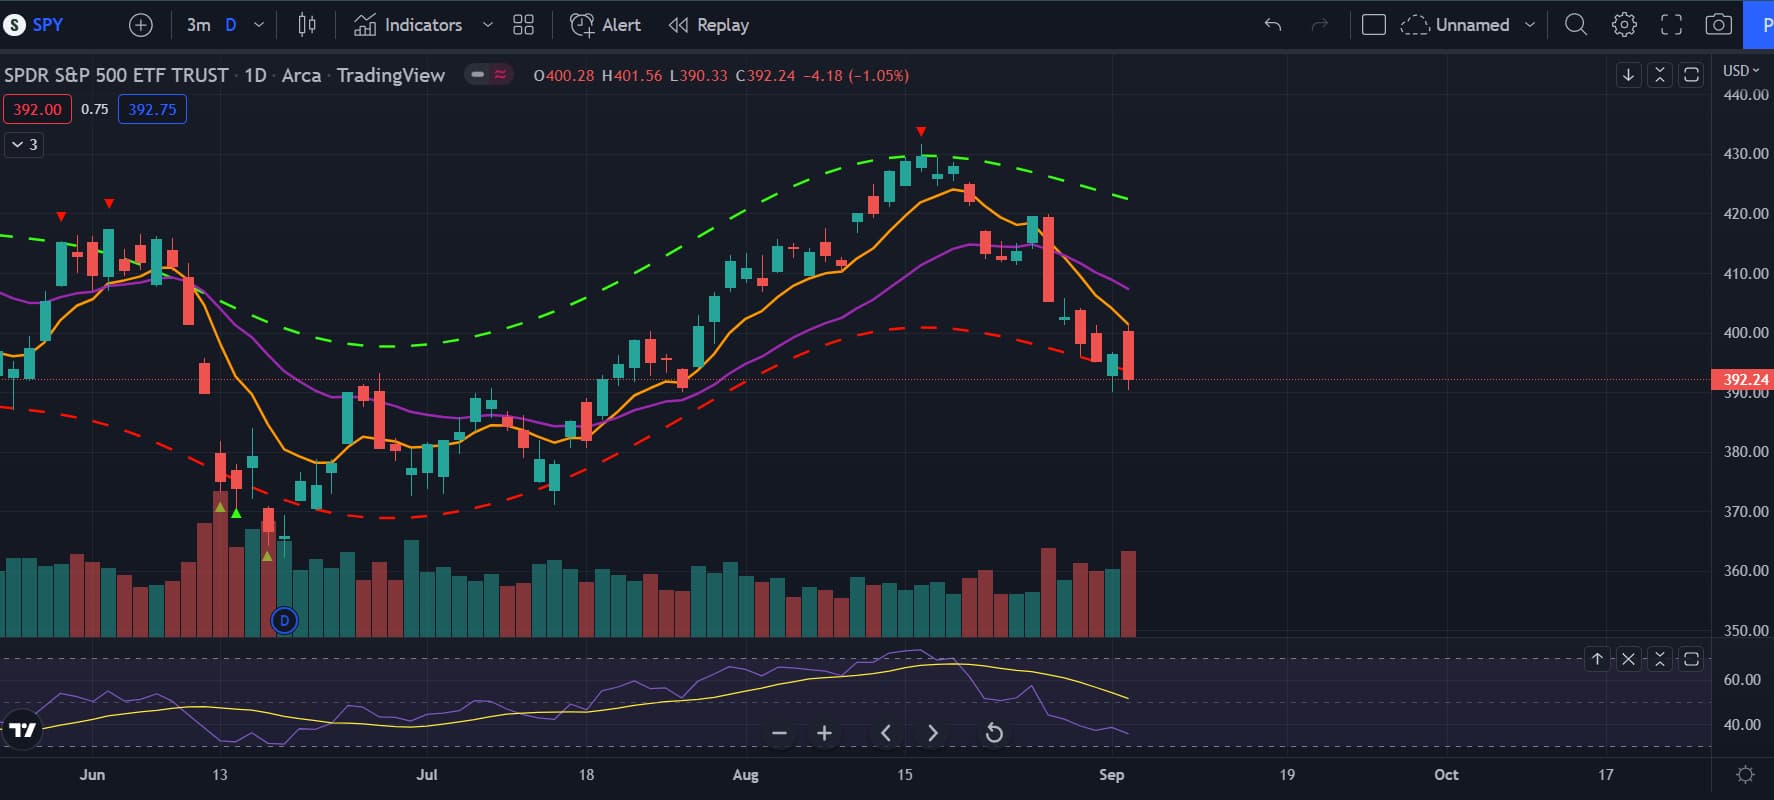
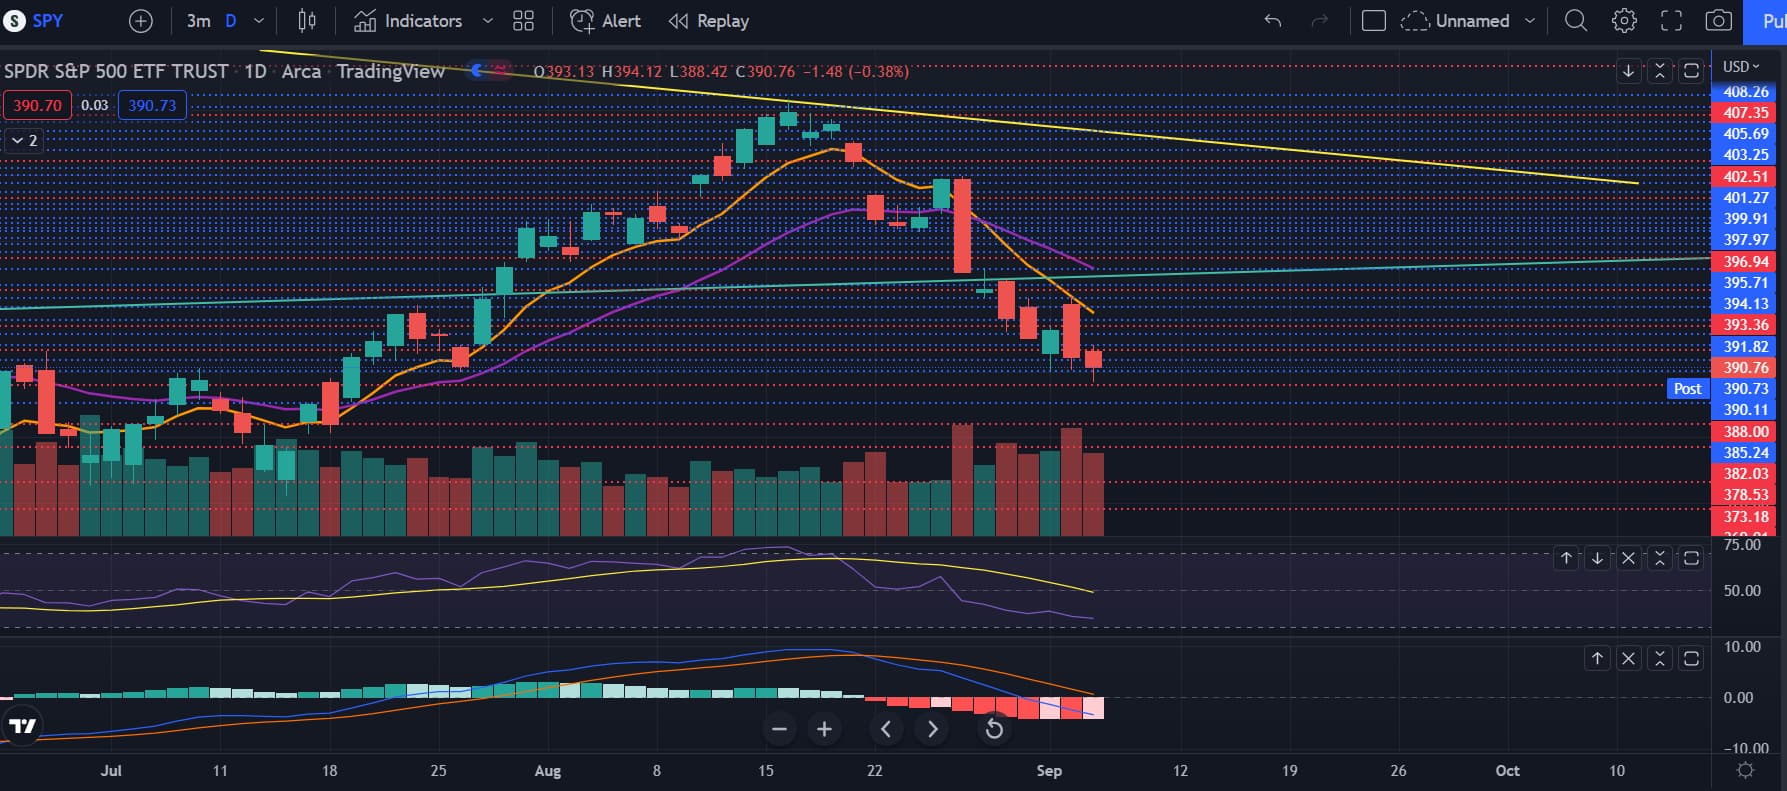
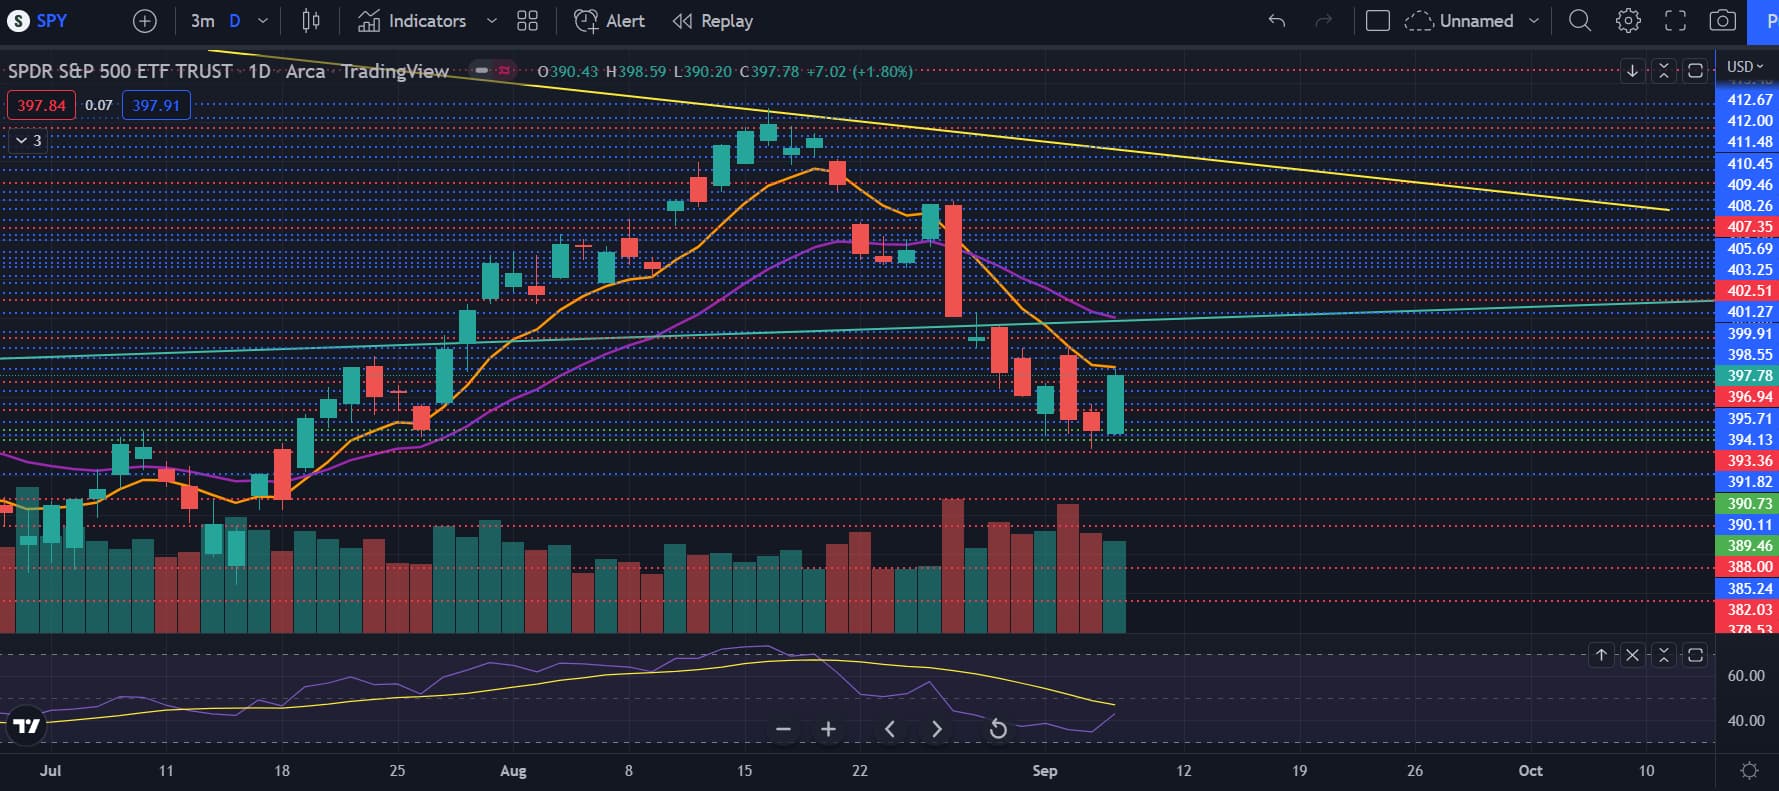
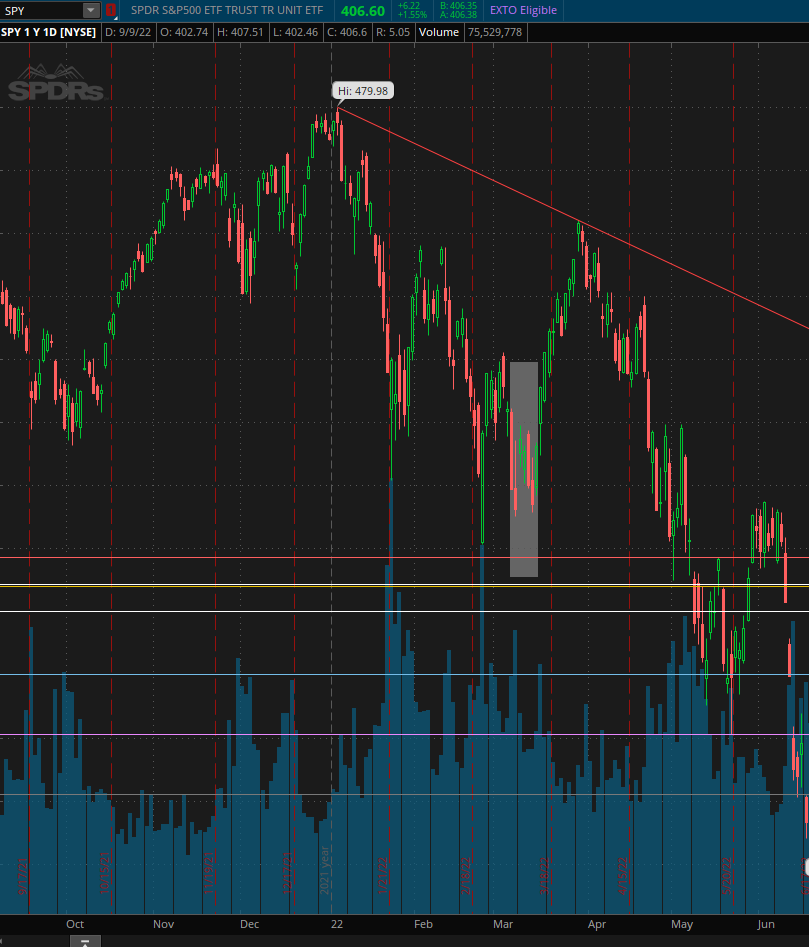
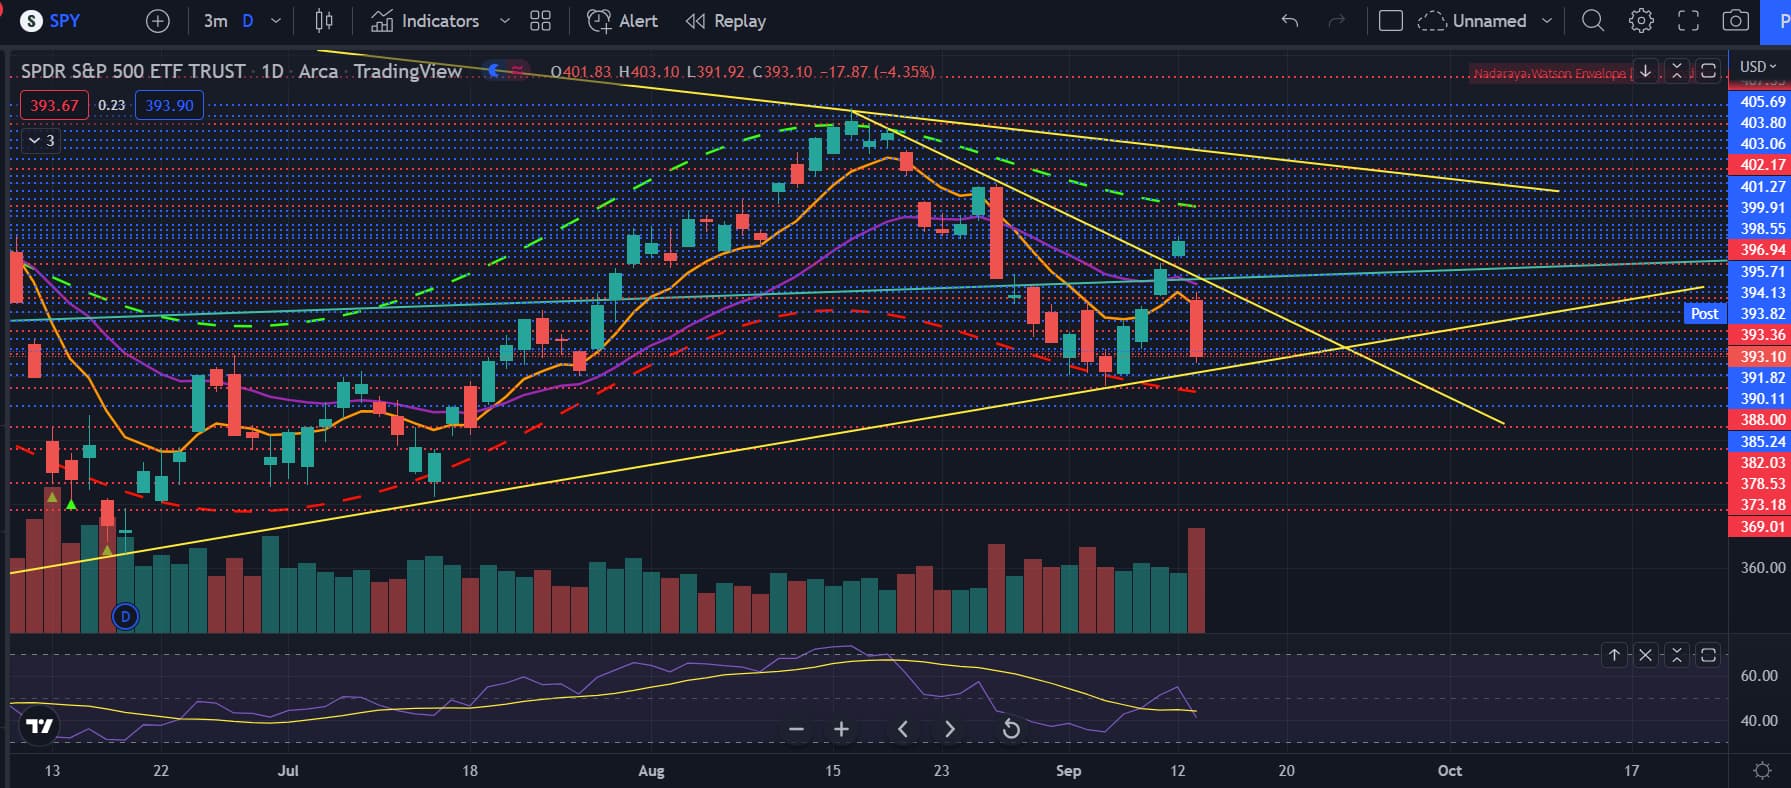
Now on SPY daily, we had a return to average to the 8 EMA and got rejected straight away. I expect that to continue on for a bit longer until we either get a small bounce up or have a bigger countertrend rally for a bigger dump. This doesn’t seem like the end though, as the selling volume is still picking up and not slowing down. BUT one thing to notice is that red and green dotted lines on my chart. This is the Nadaraya-Watson Envelope. Basically like the bollinger bands in terms of marking the extremes. If you look at the chart, when we go below the lines, we get a rally soon after. This makes me believe that this is not a good time to go into swing puts, but this is just my system. I’m personally betting on one more red day before a bounce up to enter puts.
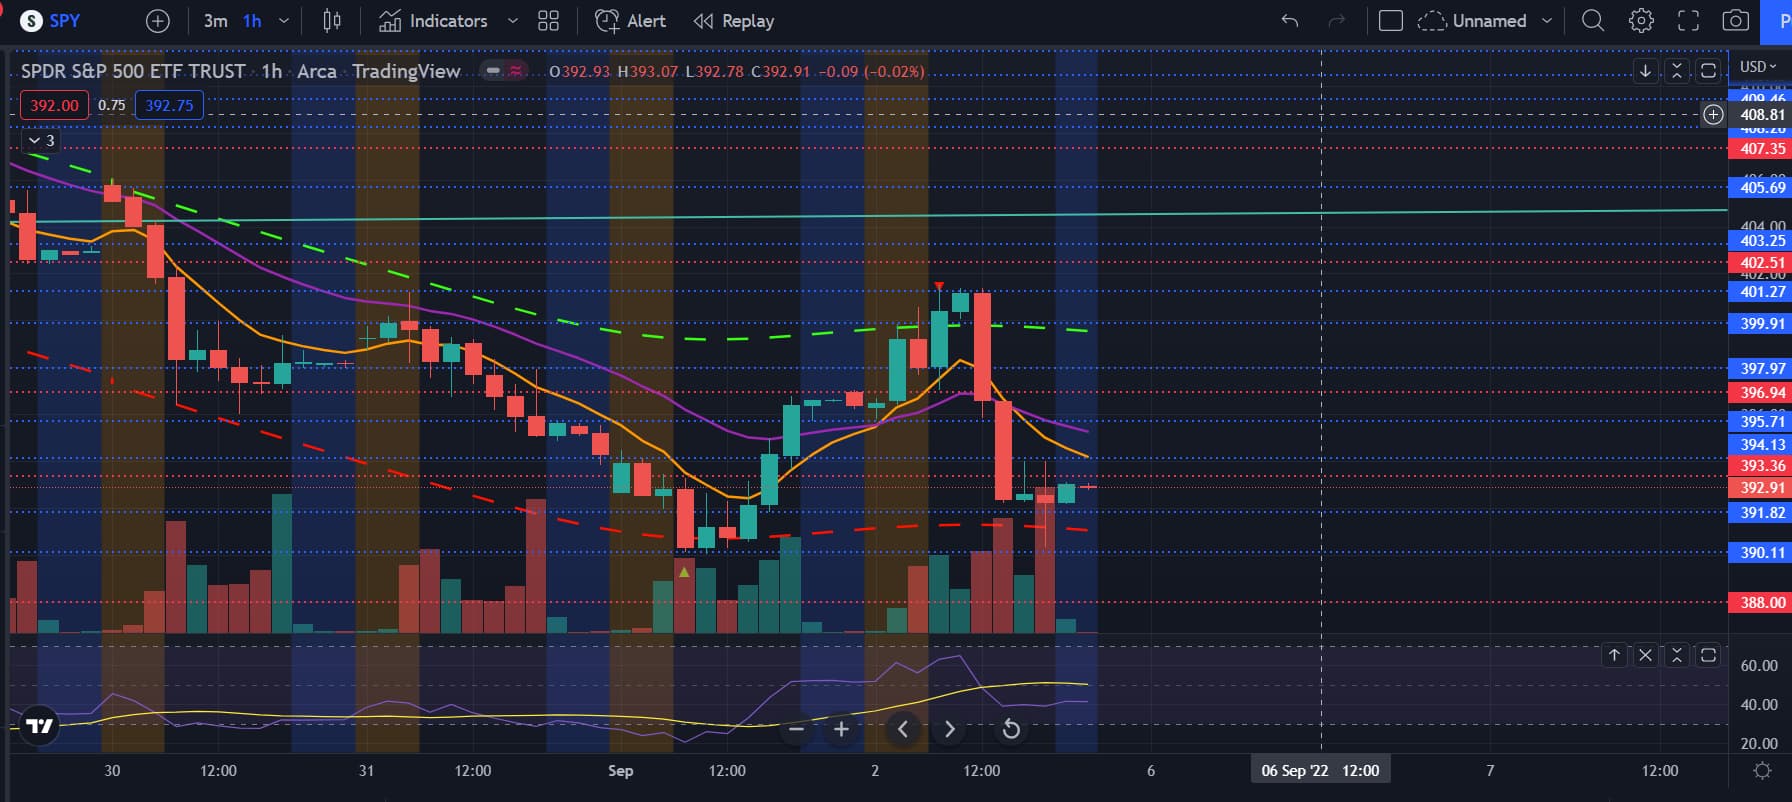
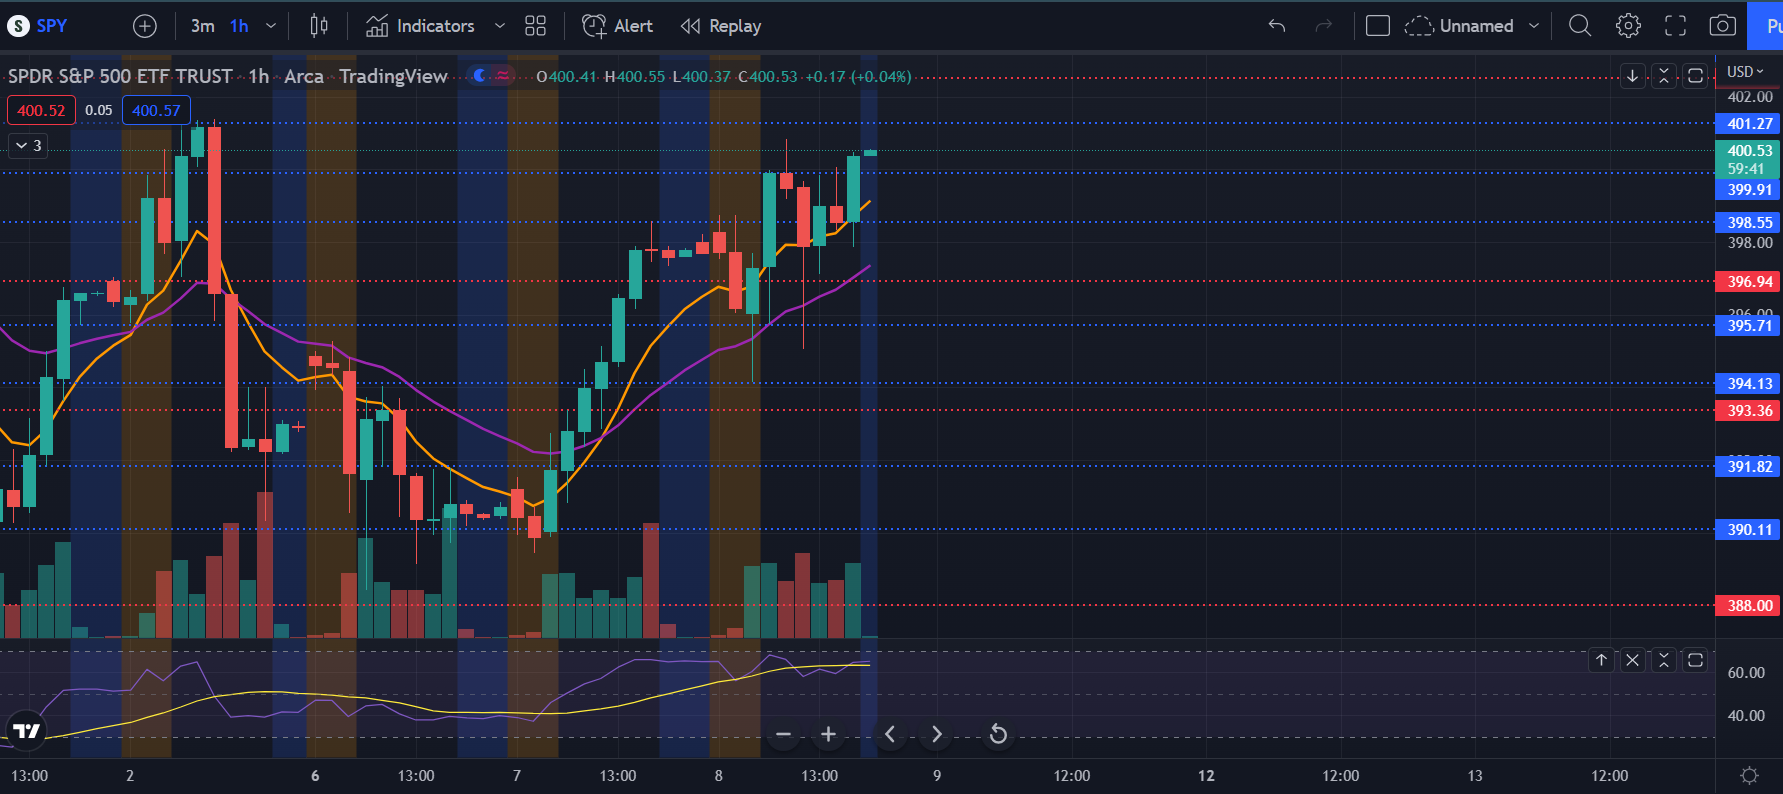
The hourly shows pretty well how the nadaraya indicator works. Almost perfectly timed the bottom and the top on the hourly. Anyways, shit looks bearish on the one hour. We couldn’t hold the uptrend and got a huge bull trap. I would watch out for one more leg down to like 390 - 385 or something and see if we form another bullish divergence to get a countertrend rally to re-enter puts.
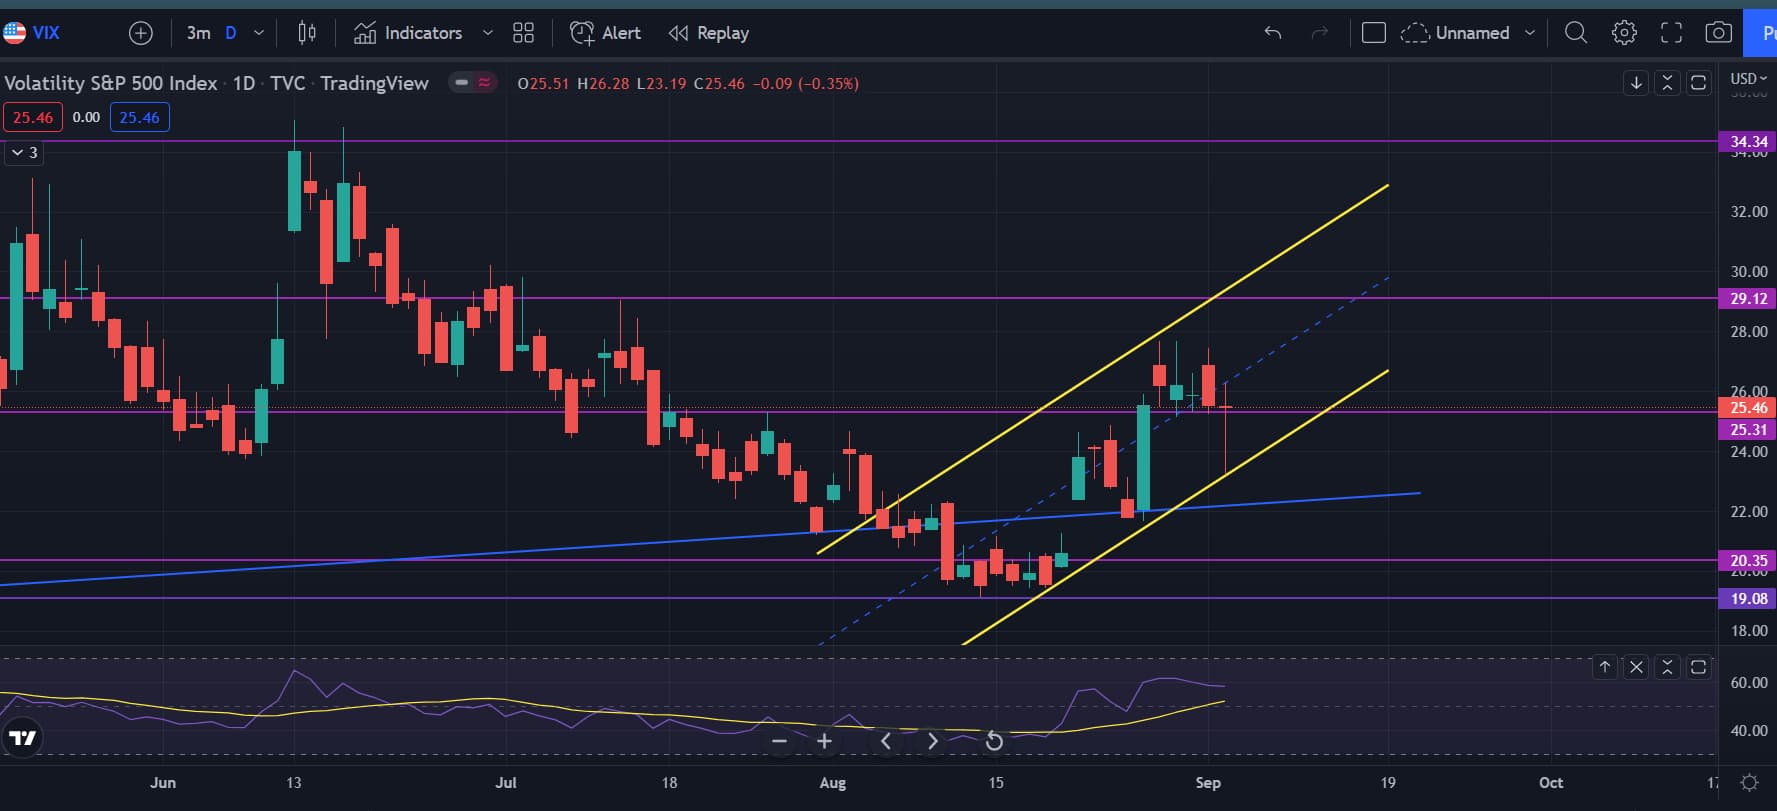
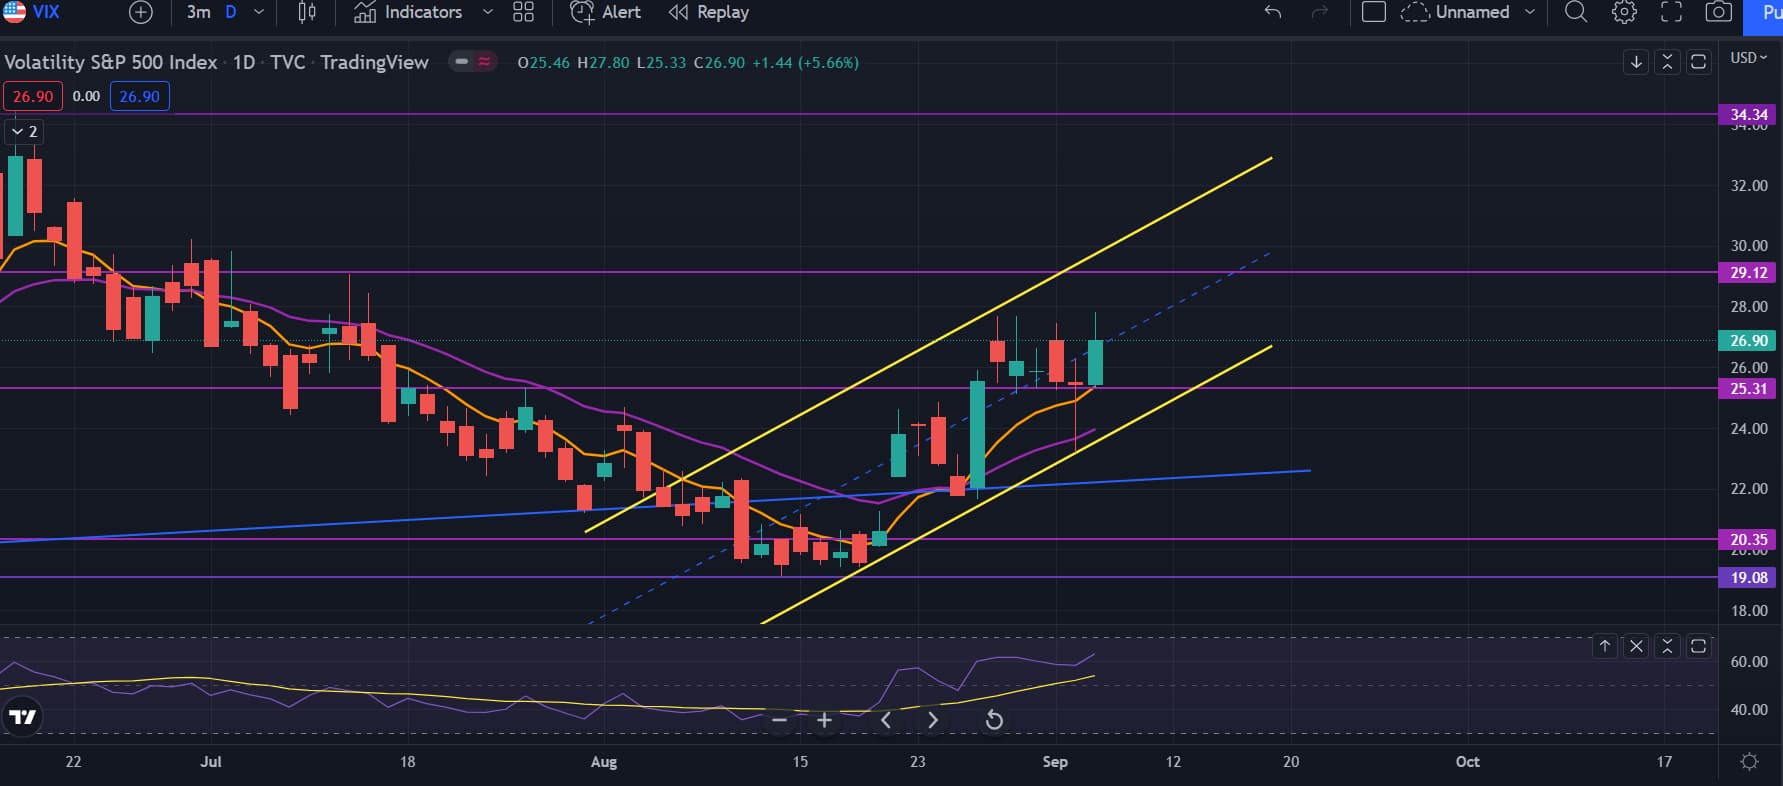
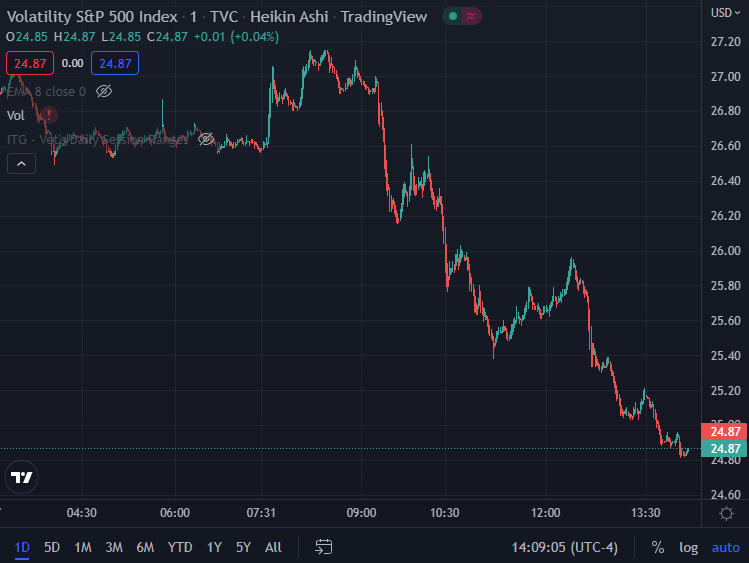
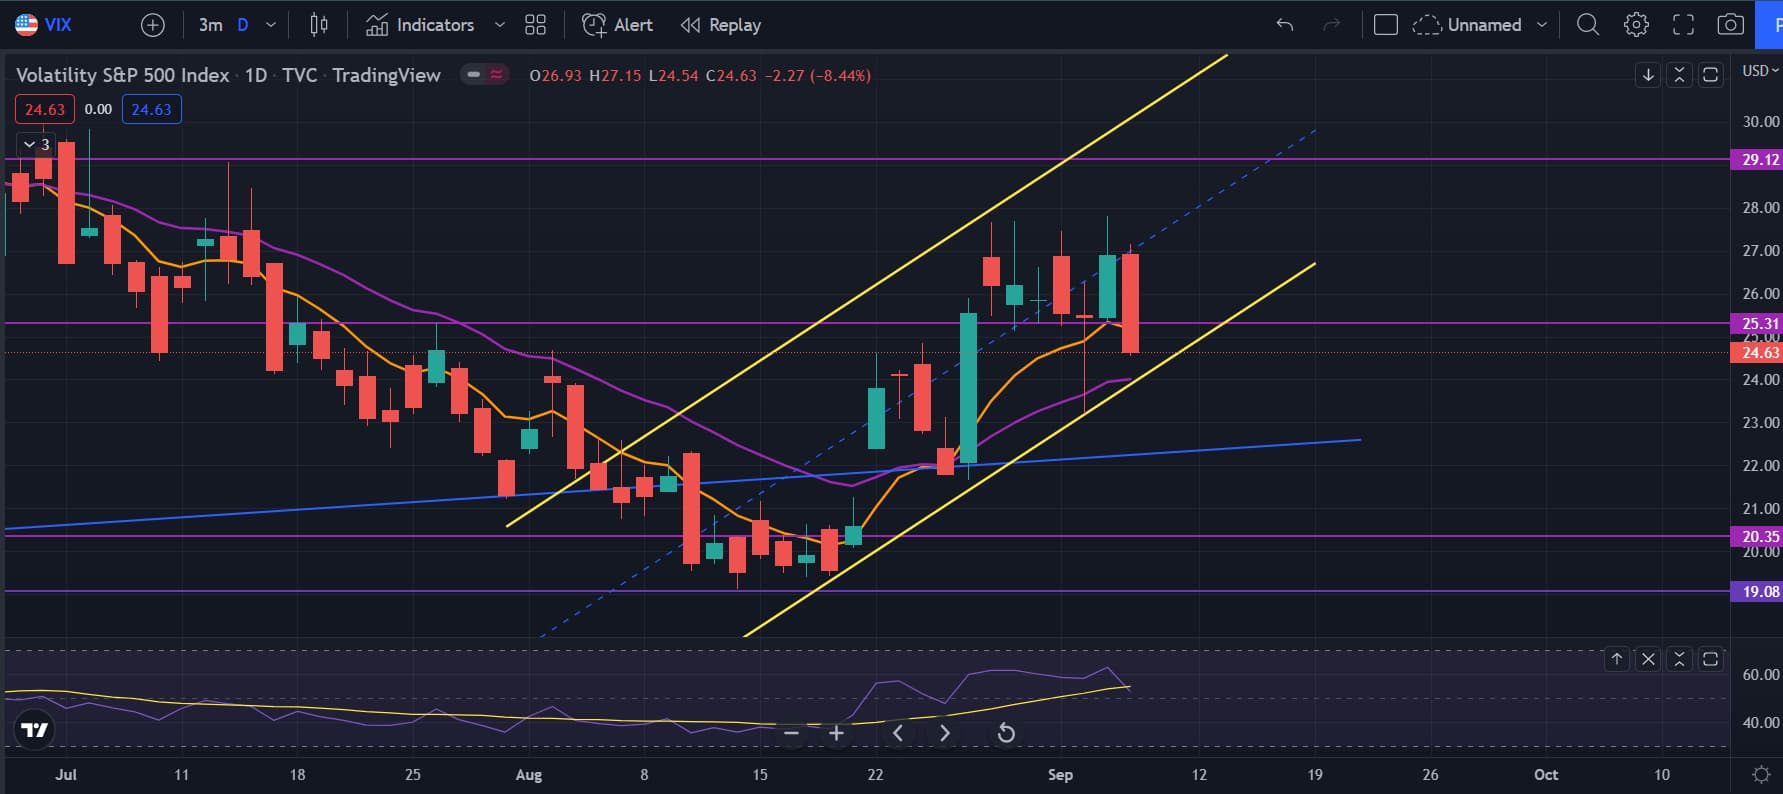
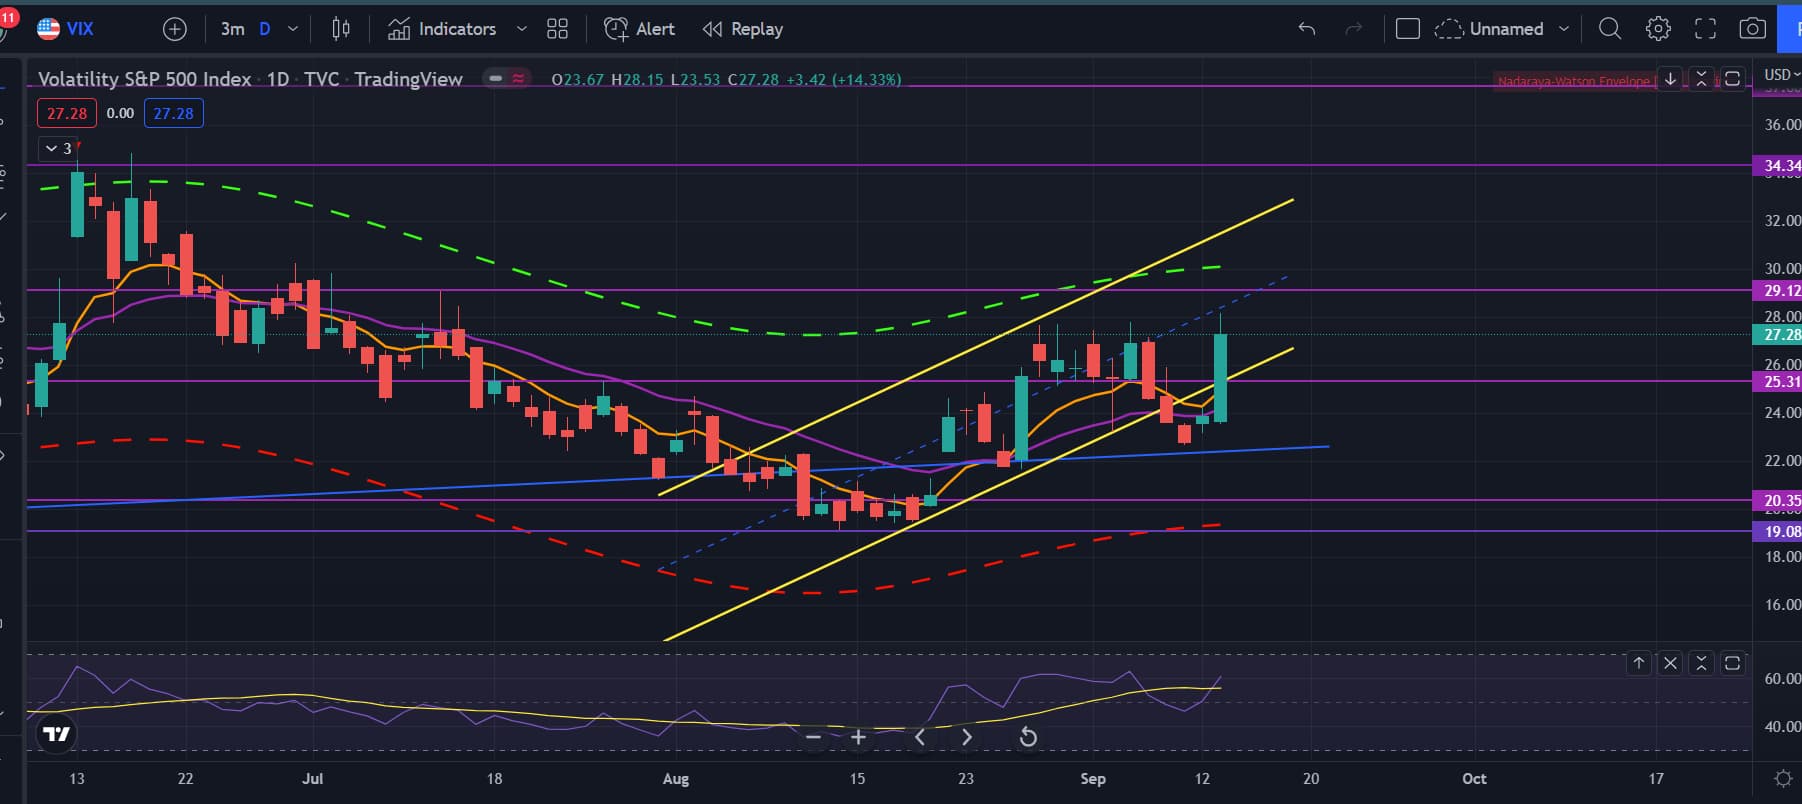
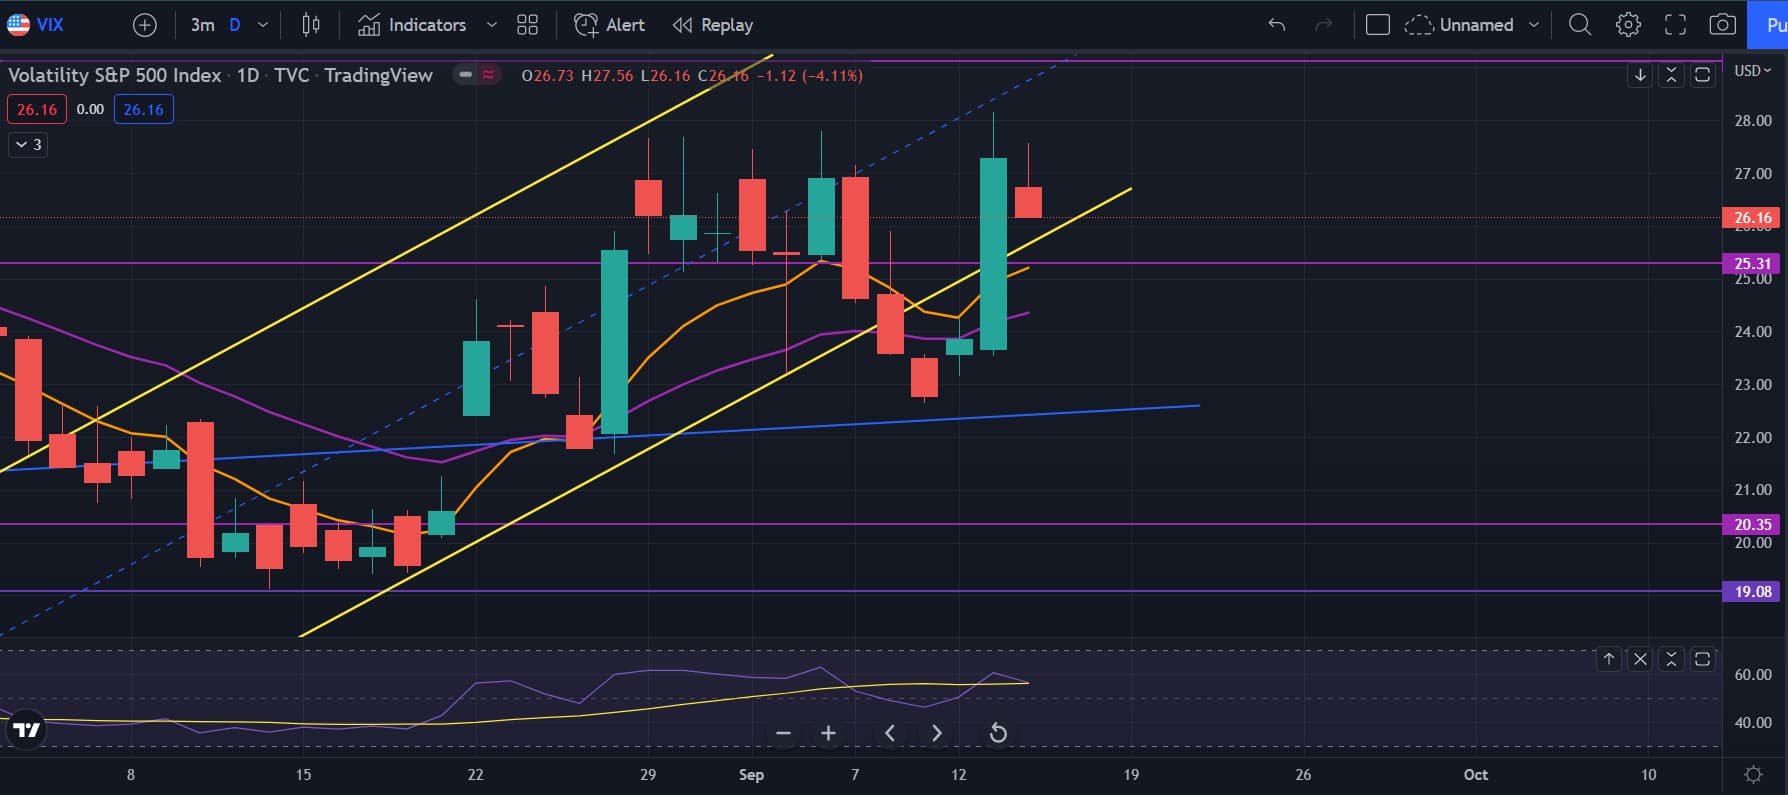
VIX was down strangely for the day. But it is on an uptrend now, possibly in a channel. So just something to look out for and possibly enter VIX/ UVXY calls. VIX is looking like the stocks are gonna be expensive and bearish again so yay.
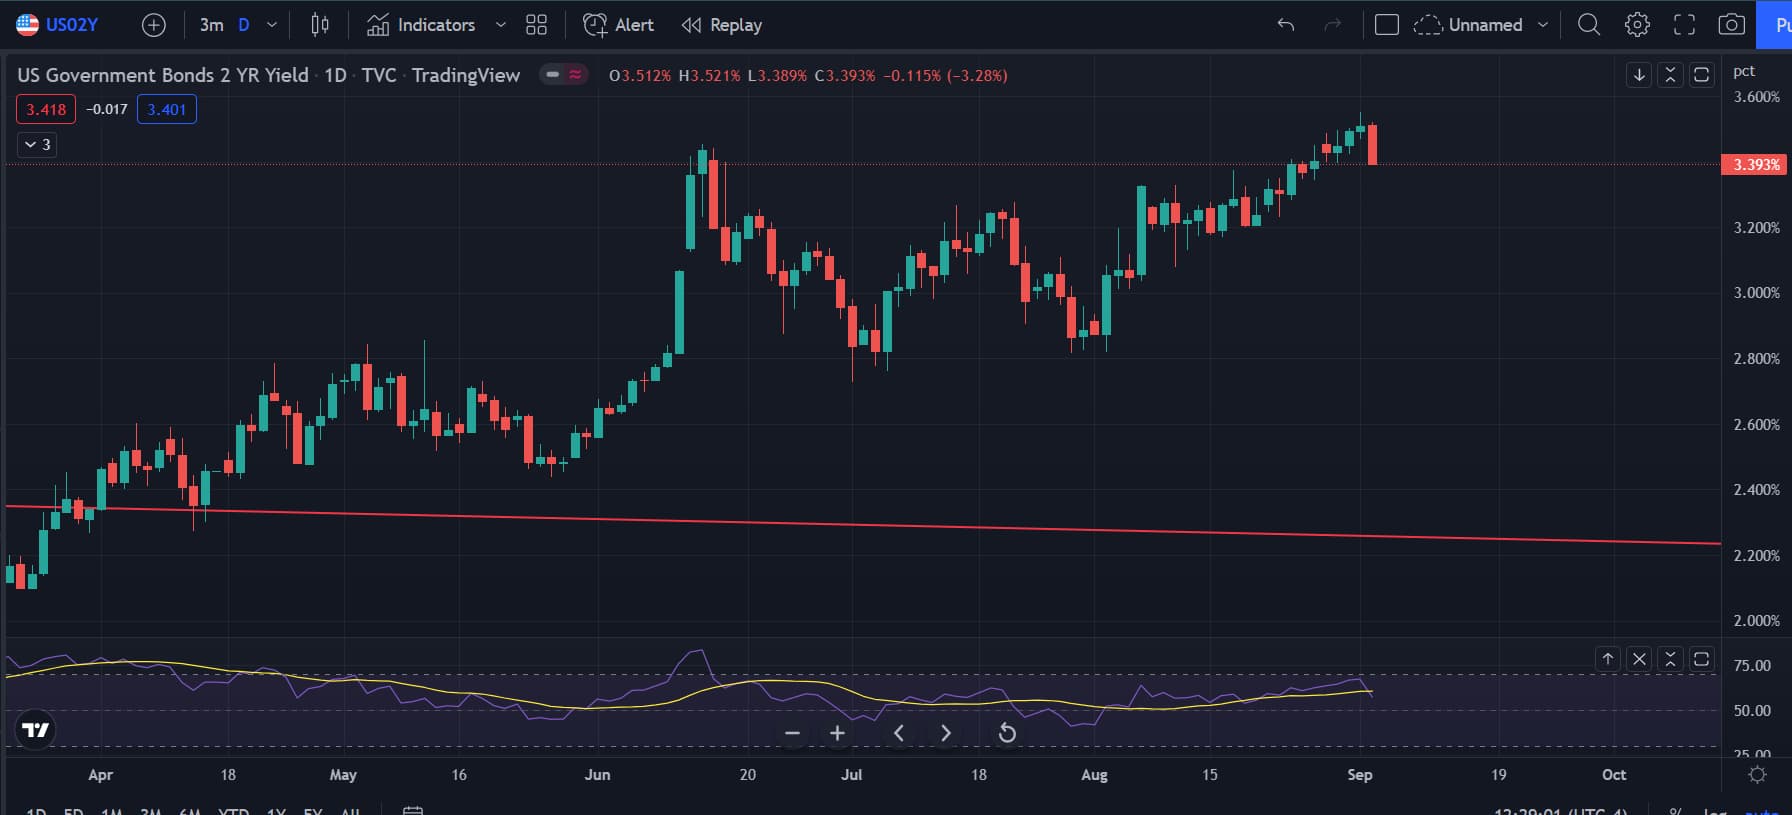
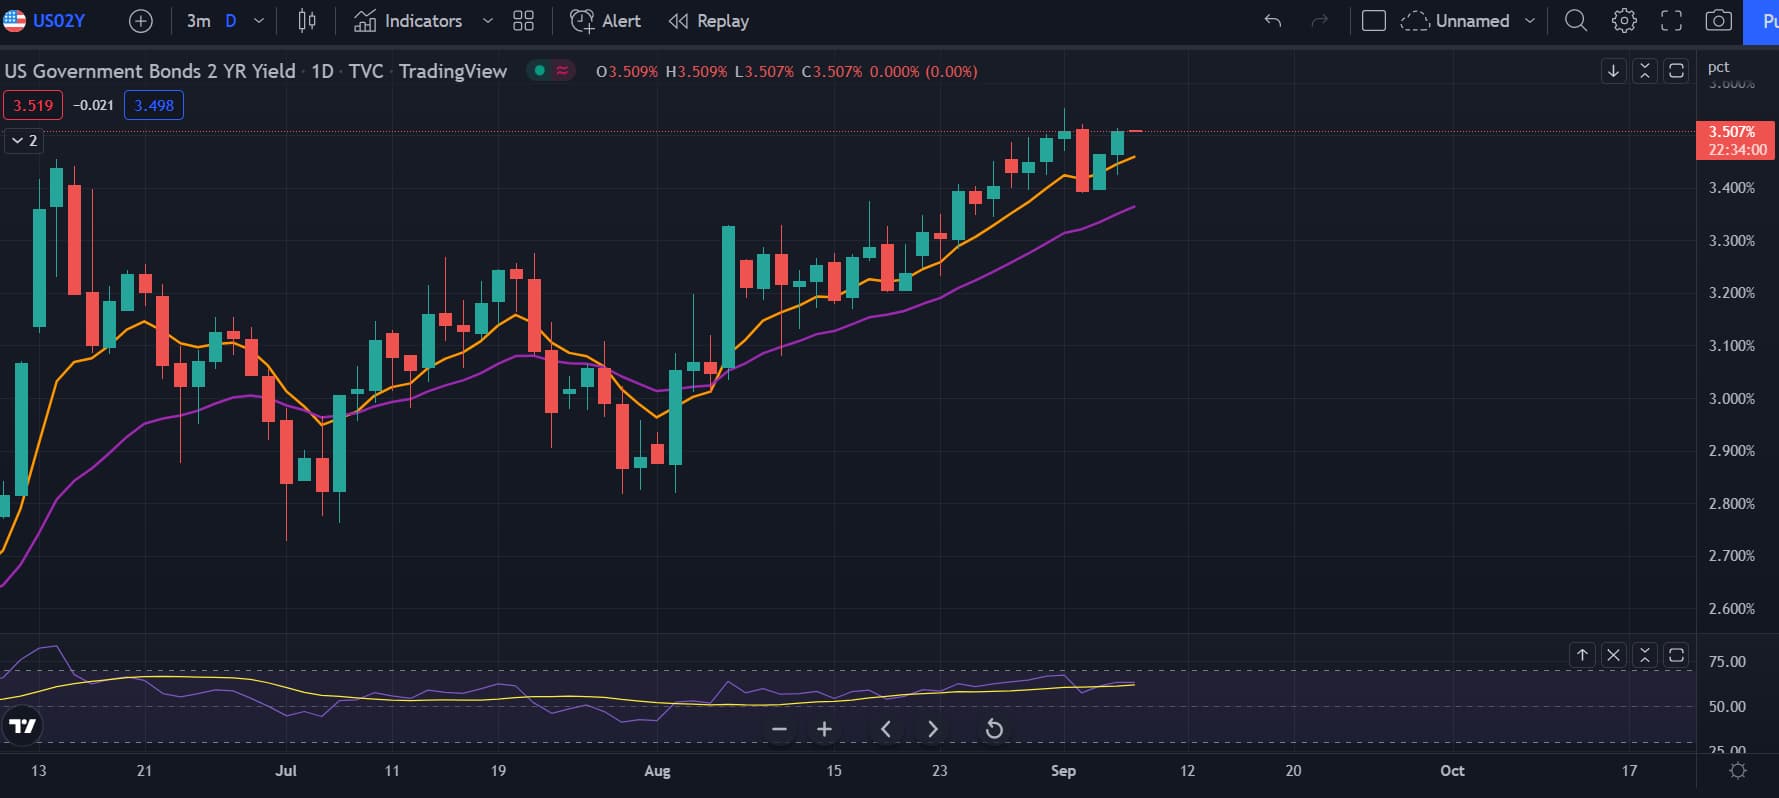
So the 2 year fell on Friday, which I don’t know why. But one thing that does make me optimistic for the stock market is that the 2 year isn’t going ballistic like during the March rally when we had a huge shitter down. This makes me believe that we’re not going into a full on crash just yet, but we’ll see.

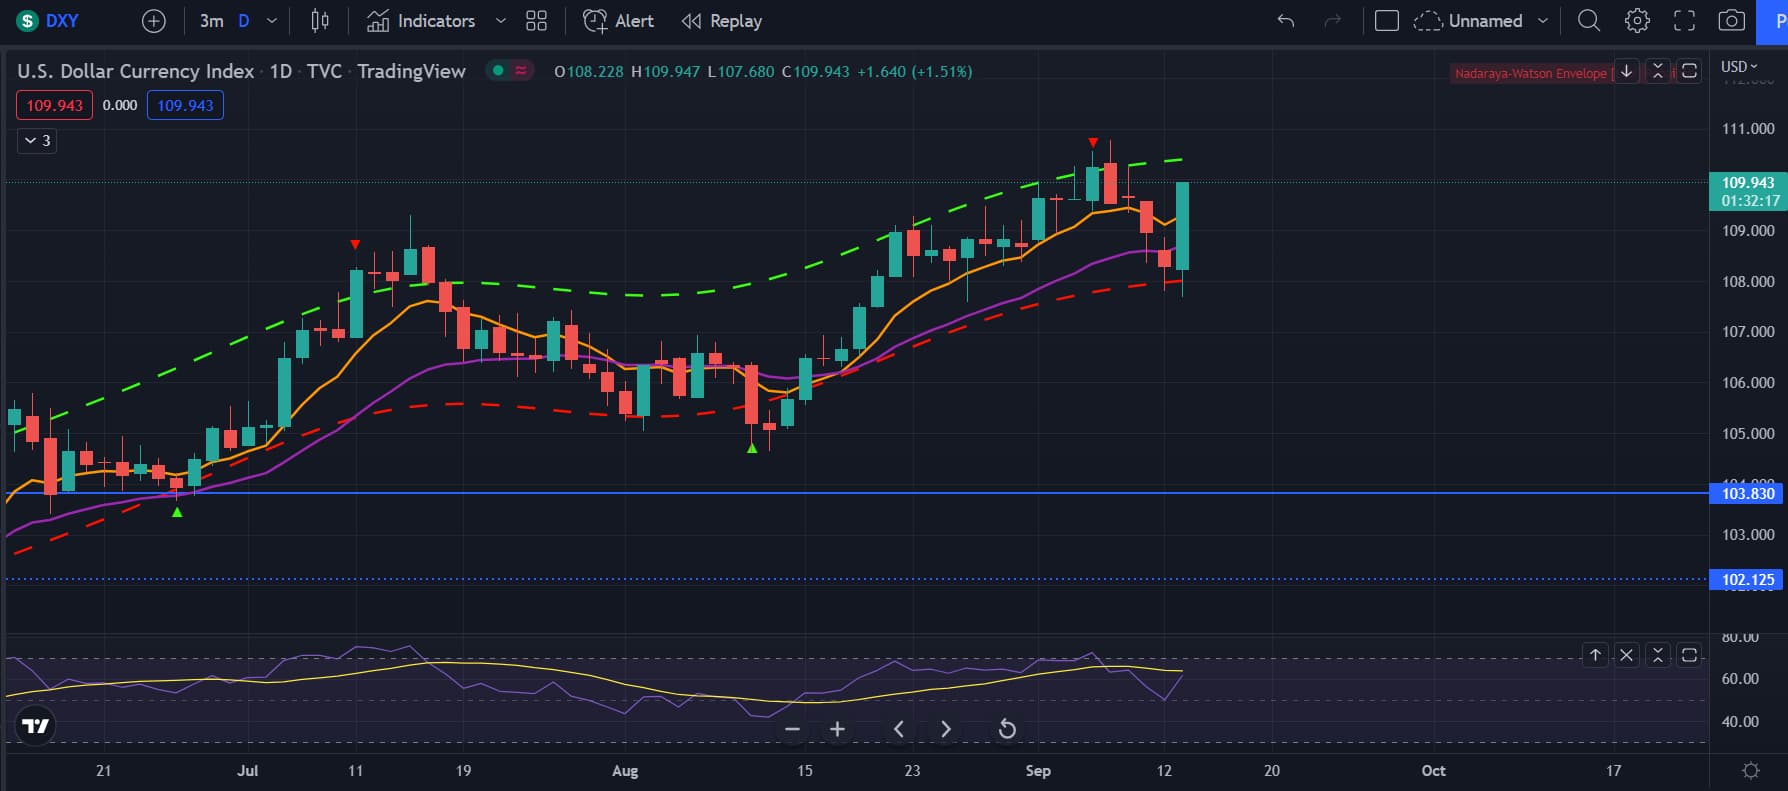
Dollar is still tracking up higher and looking strong. Bearish for stocks, although we are forming some bearish divergences. Who knows, maybe these are signals that we’re going to get a rally soon before the next leg down.
Another thing I’m watching right now is the put/call ratio, but strangely it’s not really going up too high. There’s not a lot of puts like before in the markets which is strange.
Overall, everything is looking bearish for the next few weeks and I believe that we’ll see a retest of the lows again. Be careful everyone and don’t get trapped and fucked up by this market. I still don’t believe that we are in a crash yet because of how unemployment isn’t rising up sky high, but we’ll see if I’m right. I think we’ll still see a very strong rally before we crash like 50-75%.
5 Likes
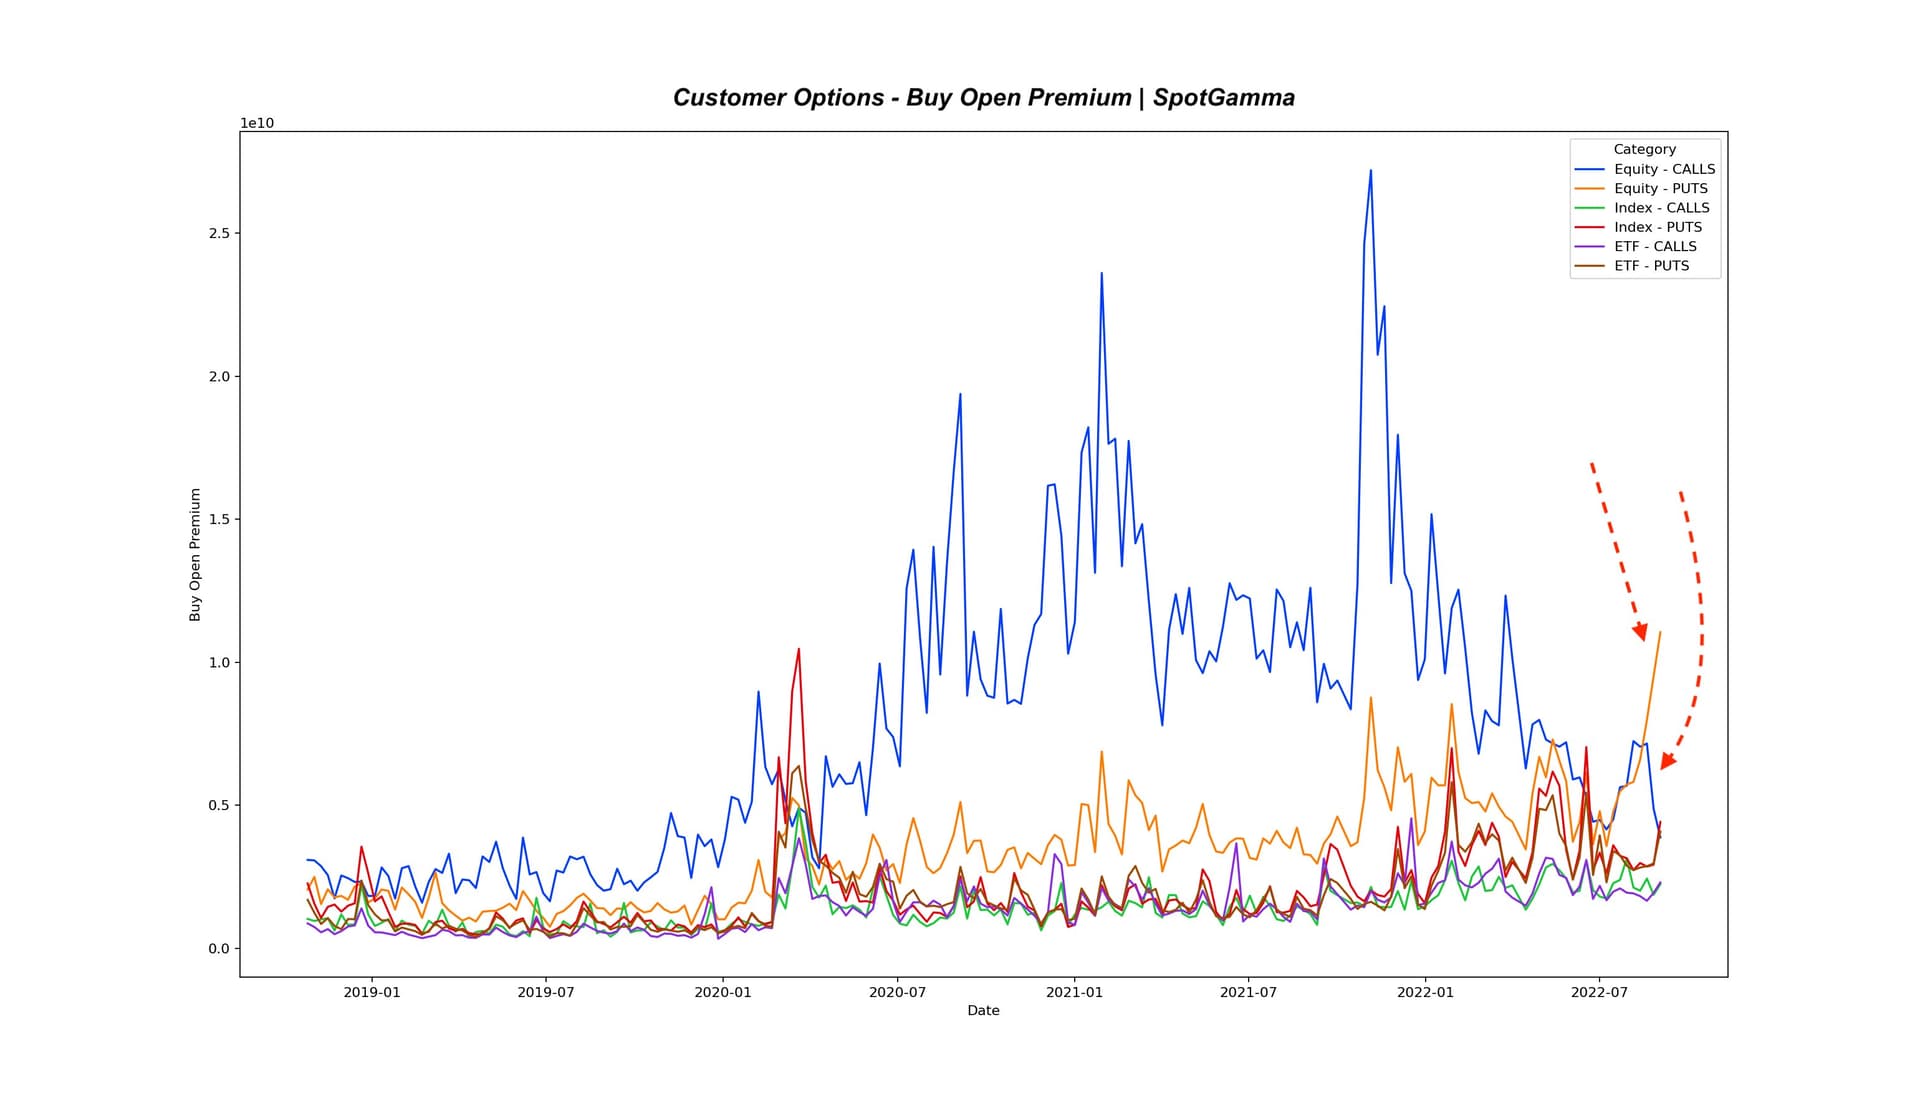
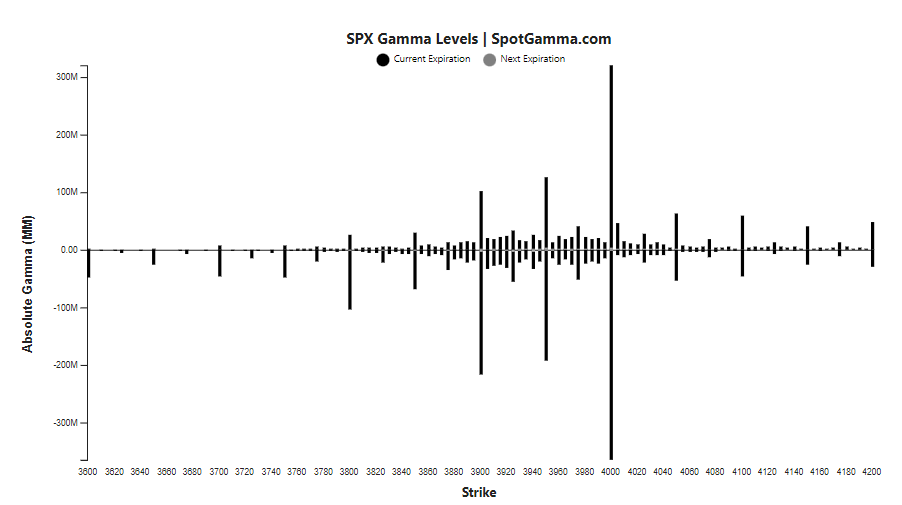
Indeed, SG gamma structure suggests option market structure has now swung to bearish mode again, like a few months ago. We are also in deep negative gamma territory, so we can expect volatility (exaggerated moves) next week.
Sep quarterly opex is quite sizeable, and only two weeks away. Historically speaking, markets tend to fall into opex. It is possible we see 3700 in 2 weeks.
6 Likes
Upcoming possible market-moving events that can throw wrenches into any options-driven movements:
- Tuesday, September 6, 9:45 AM EST: S&P PMI (final)
- Wednesday, September 7, 2:00 PM EST: Fed Beige Book
- Thursday, September 8, 9:10 AM EST: JPow speaks
- Tuesday, September 13, 8:30 AM EST: CPI
- Wednesday, September 14, 8:30 AM EST: PPI
- Thursday, September 15, 8:30 AM EST: Retail sales
- Friday, September 16, 10:00 AM EST: UMich consumer sentiment index
As well as various Fed speakers from September 6 to September 9, but we have seen that fed comments do not move markets anymore, aside from JPow of course.
It’s awkward because right now, good numbers means the fed can be more hawkish. Bad numbers would mean the fed can be more dovish, but it also means recession. So in a sense, any surprises to upside or downside is bad news. However, I think the market is more likely to go up in the face of bad numbers since the market cares much more about JPow dovishness vs hawkishness rather than recession risks.
That being said, perhaps the best case scenario on a macro level is for numbers to come out as close as possible to consensus, because this means no surprises/shocks, data being “priced in”, and that the economy is moving along as projected in a predictable way.
4 Likes
4 Likes
TLDR: It seems like the sell off is weakening and we might have a bounce incoming soon, although I still believe that there’s more downside to 385 at least. But we’ll see - powell speech this week too.

So on the hourly, we are still on a strong downtrend. We tested the 21 EMA then failed and rode the 8 EMA down. One thing to notice is that the RSI and the MACD are forming some triple bullish divergences. Whether this plays out and we rally from here will be seen, but it’s something to note and that this selloff is starting to weaken.
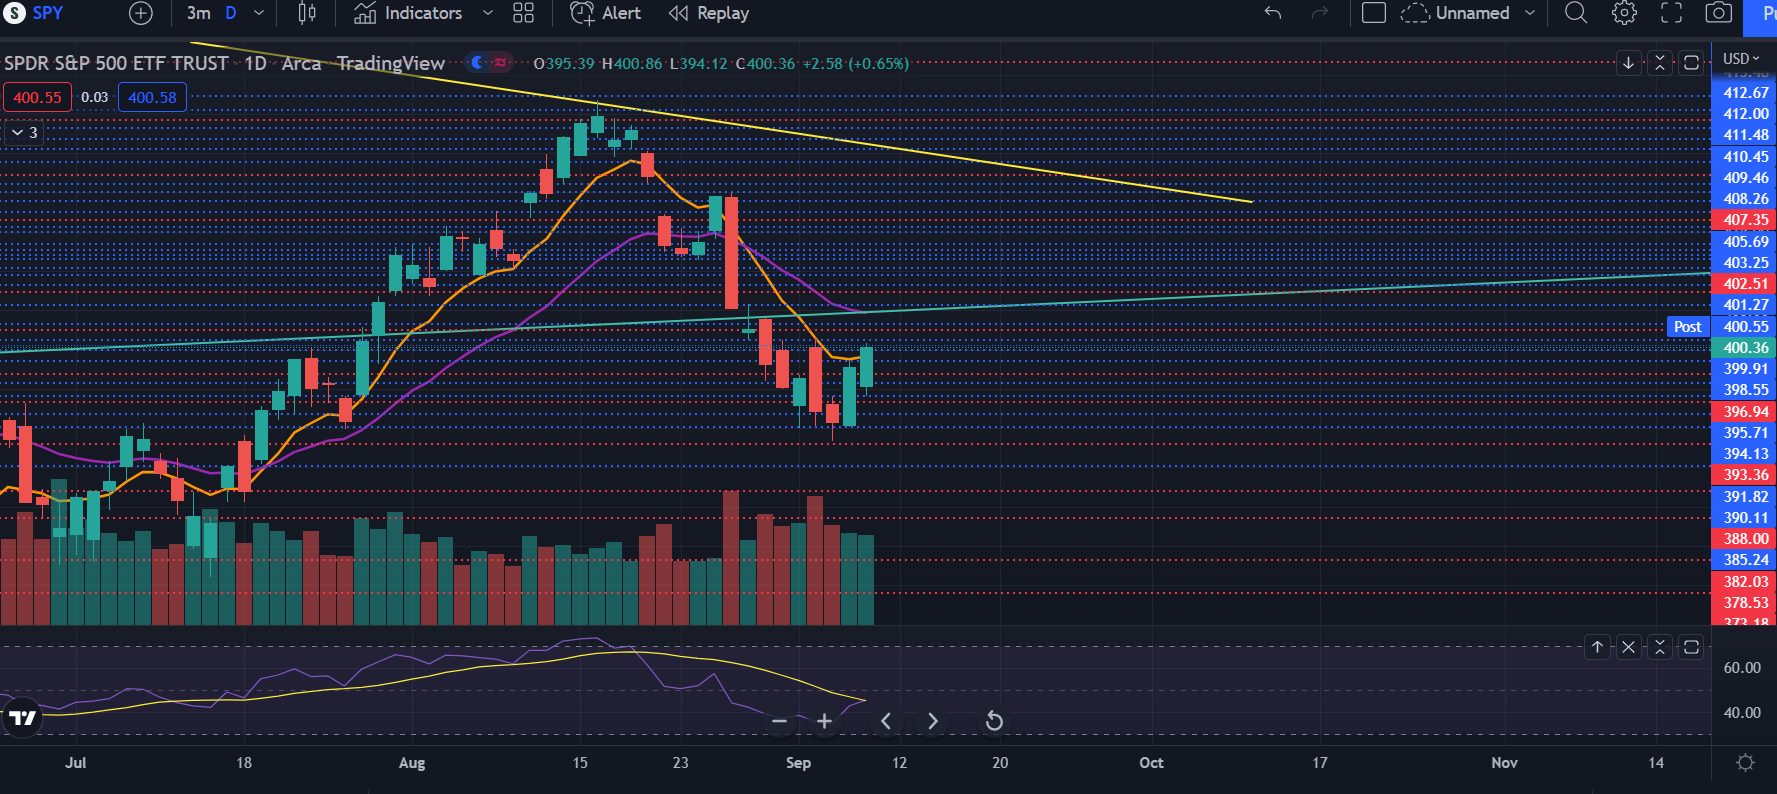
Another reason why I think this sell off is coming to an end soon is because of the bottom wicks starting to form the past few days. It seems like this level between 394 and 388 is being defended strongly and bulls are not willing to give it up just yet. Also the selling volume has decreased, possibly sellers getting weaker. We’ll see if this hammer candle on the daily starts to produce a rally. On another one of my indicators, we’ve been on the extreme bottom and due for a short term oversold rally at least so that’s another reason why I’m leaning towards this selloff ending soon. Also looking at the MACD, it’s at the 0 level, where stocks can typically bounce off that level. We’ll see what happens, but I’m still leaning towards a bigger overall downtrend for the month.
VIX is holding strong and just bouncing around this level. This can possibly be a good trade the next time SPY rallies up. Maybe take VIX/ UVXY calls on the 25 level or the yellow uptrend because I think that September will be red.
The yields are continuing to track up which is putting more pressure on stocks. We’ll see how much higher it tracks up, but this isn’t a good sign folks. If you’re a longer term bull, you want to see the yields roll over.
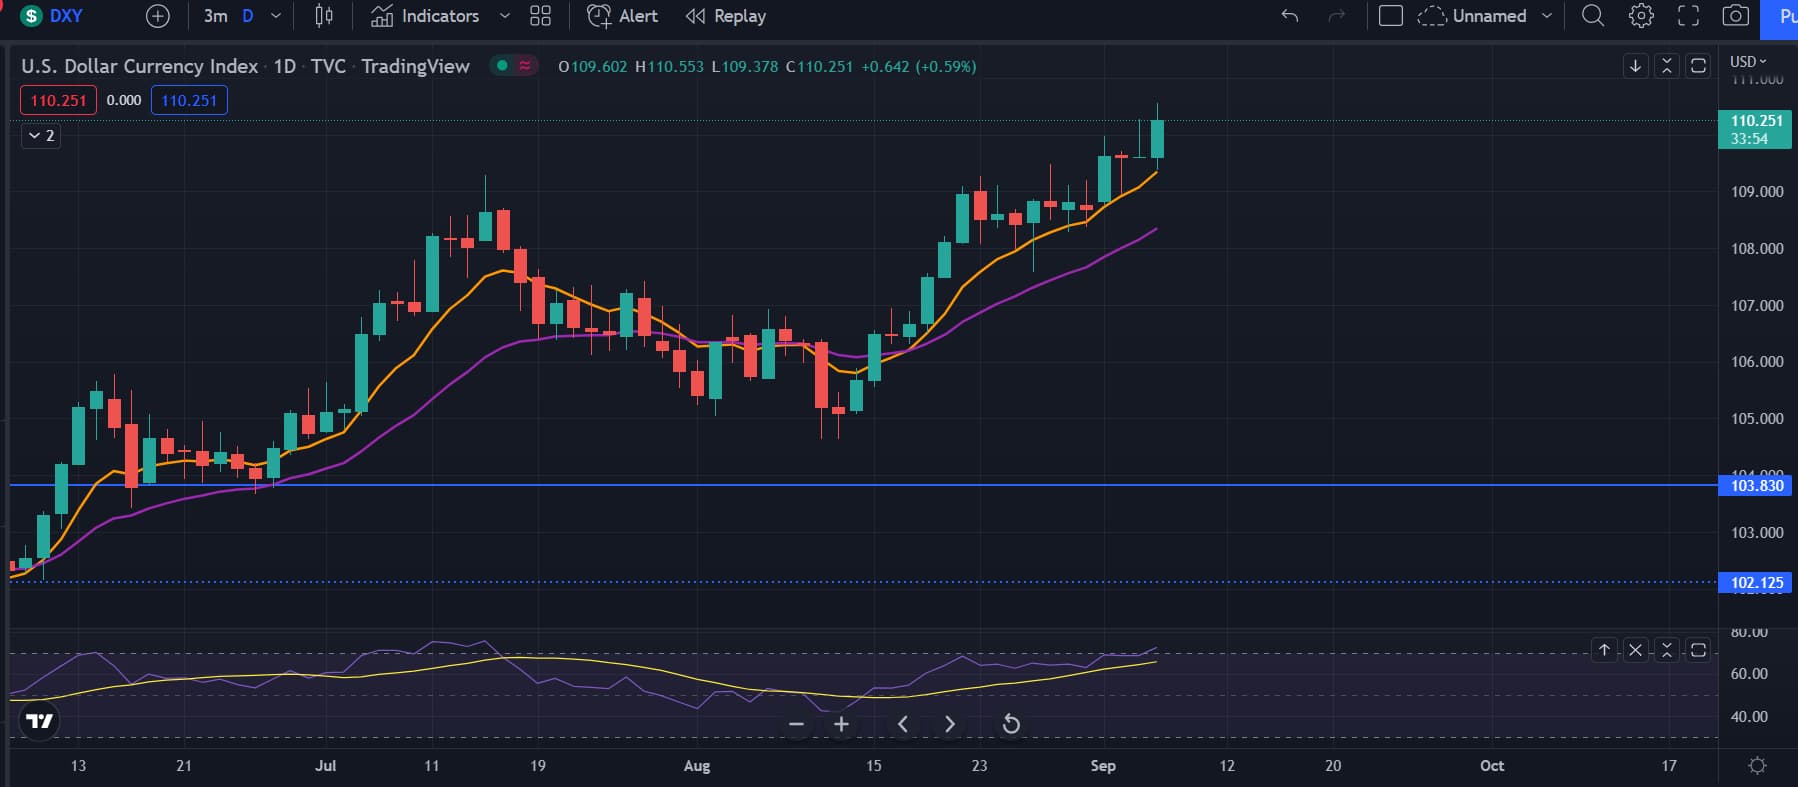
The dollar is back to making ATH and beasting up. Not a good sign for stocks, esp when there’s no bearish divergence. Possibly means that dollar is going to continue to track up and stocks are gonna fall lower.
Overall, I think that the sell off is ending soon and we’ll have a better entry for puts. But who knows if that’ll actually play out so there’s no reason to start to hop into calls right now. Be careful everyone and stay green.
4 Likes
A major factor moving markets higher today is likely the leak from the usual suspect that the Fed will hike by 75 bps.
This has caused VIX to fall 7.5%, as uncertainty around that event was removed.
When VIX goes down, markets go up. And here we are, up 1.5% for the day.
Two corollary thoughts:
- It would be nice to make these connections earlier in the day…
- Europe and CPI release next week could continue to provide vol for the markets, so today could be relief rally more than anything else
3 Likes
TLDR: Jpow speaks tomorrow at 9:10am so I’m gonna keep the TA short since Jpow will most likely move the markets.
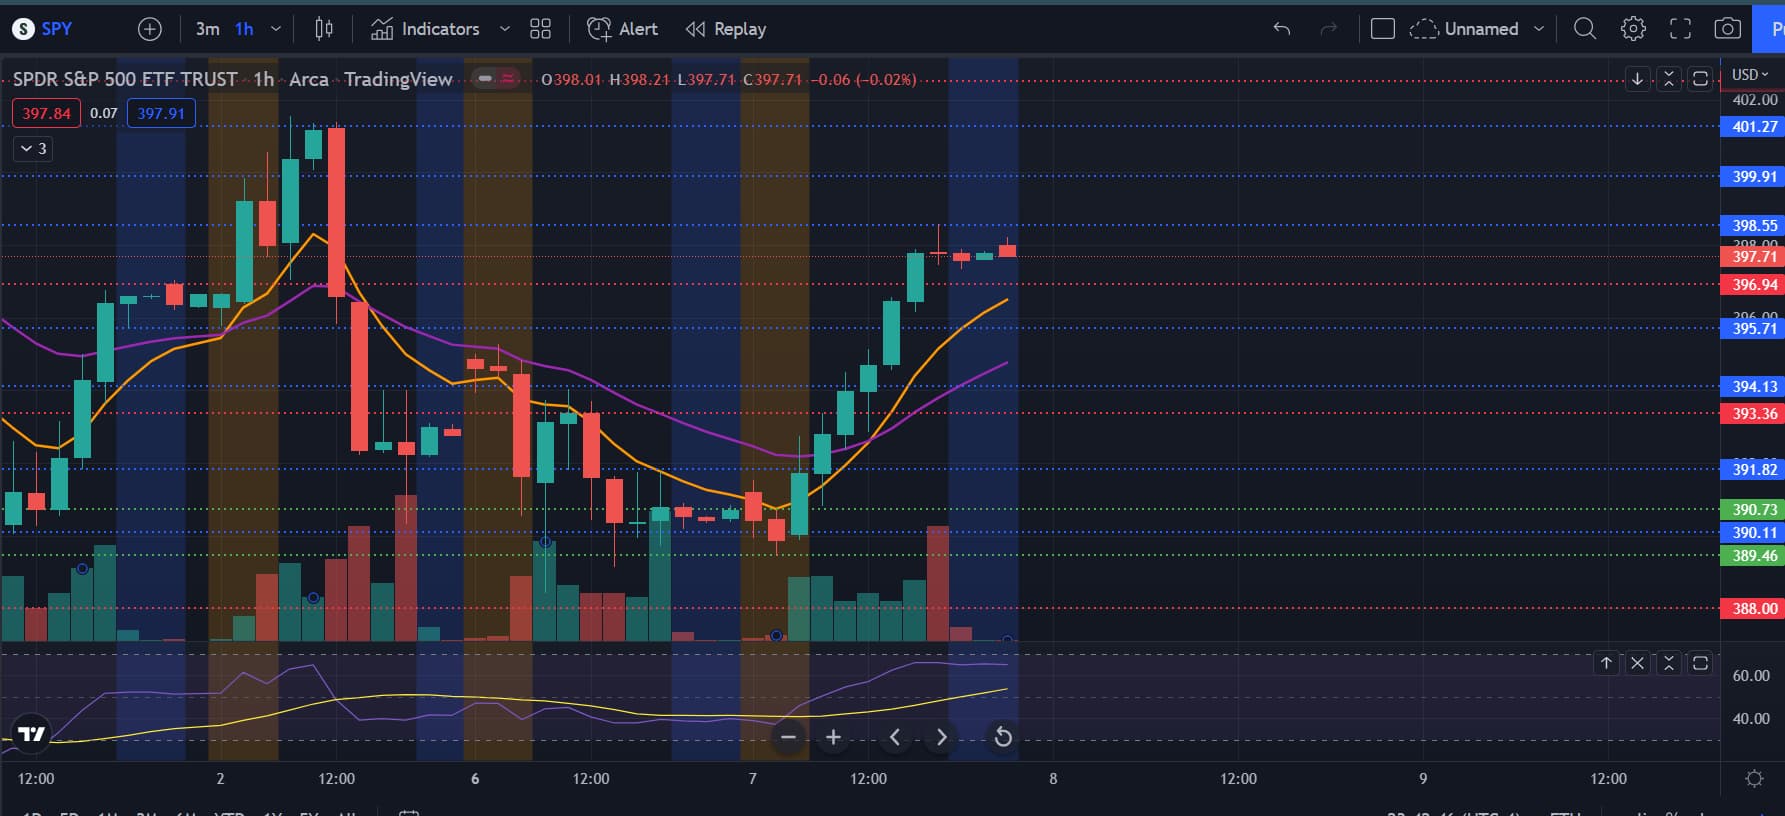
So the hourly looks like it wants to change the trend as it’s above the EMAs and above the 50 level on the RSI. It is stalling near 388 resistance and maybe has topped, but we’ll see. I am betting on more downside, but it really depends on Jpow. Overall, chart looks like it wants to change trend, but until we make a higher high than 401, it’s still just a downtrend.
The daily looks like we’ve topped as we’re back to the 8 EMA and we usually ride the 8 EMA down. The volume wasn’t convincing either for a reversal. Overall, daily is still bearish, but cautious at what will happen.
VIX died. Maybe an entry for calls near the uptrend line, but we’ll see. This does look good for bulls though.
Overall, seems like market might be reversing the trend, but we’ll have to see the confirmation that we will push through. But just listen to what Powell says and play the trend tomorrow. Really no reason to TA today since news will most likely choose the trend.
1 Like
Based on this link, it appears that the dialogue with JPow will be going on for 40 minutes from 9:10 to 9:50 AM EST.

TLDR: I personally think that we’re going to make a lower high before we go test 380 or lower. I’m looking at this rally to top at 408, but if it breaks past, I’ll start to reconsider and see if calls are the move.
So SPY on the hourly was all over the place, but it seems like it wants to go bullish. It’s repeatedly knocking at the 400 resistance and looking to go higher. Something to watch out for is that the RSI is near the overbought area, so this rally might fizzle out soon. But hourly does look bullish.
SPY on the daily cleared the first bullish level of the 8 EMA and the 400 level, closing slightly above. The volume is increasing on this green day, so that’s a good sign that this rally has some juice. But I’ll be watching at the 405 level since that’s where the 21 EMA is and the green trendline which goes back to the start of the 2009 bull market. Big resistance there so I’ll see if SPY fizzles out there. Another thing to watch out for is that SPY RSI daily is reaching the 50 level. If this selloff will continue, most likely we’ll get rejected soon. If we have another green day and end above 405, I’ll be looking at swing calls.
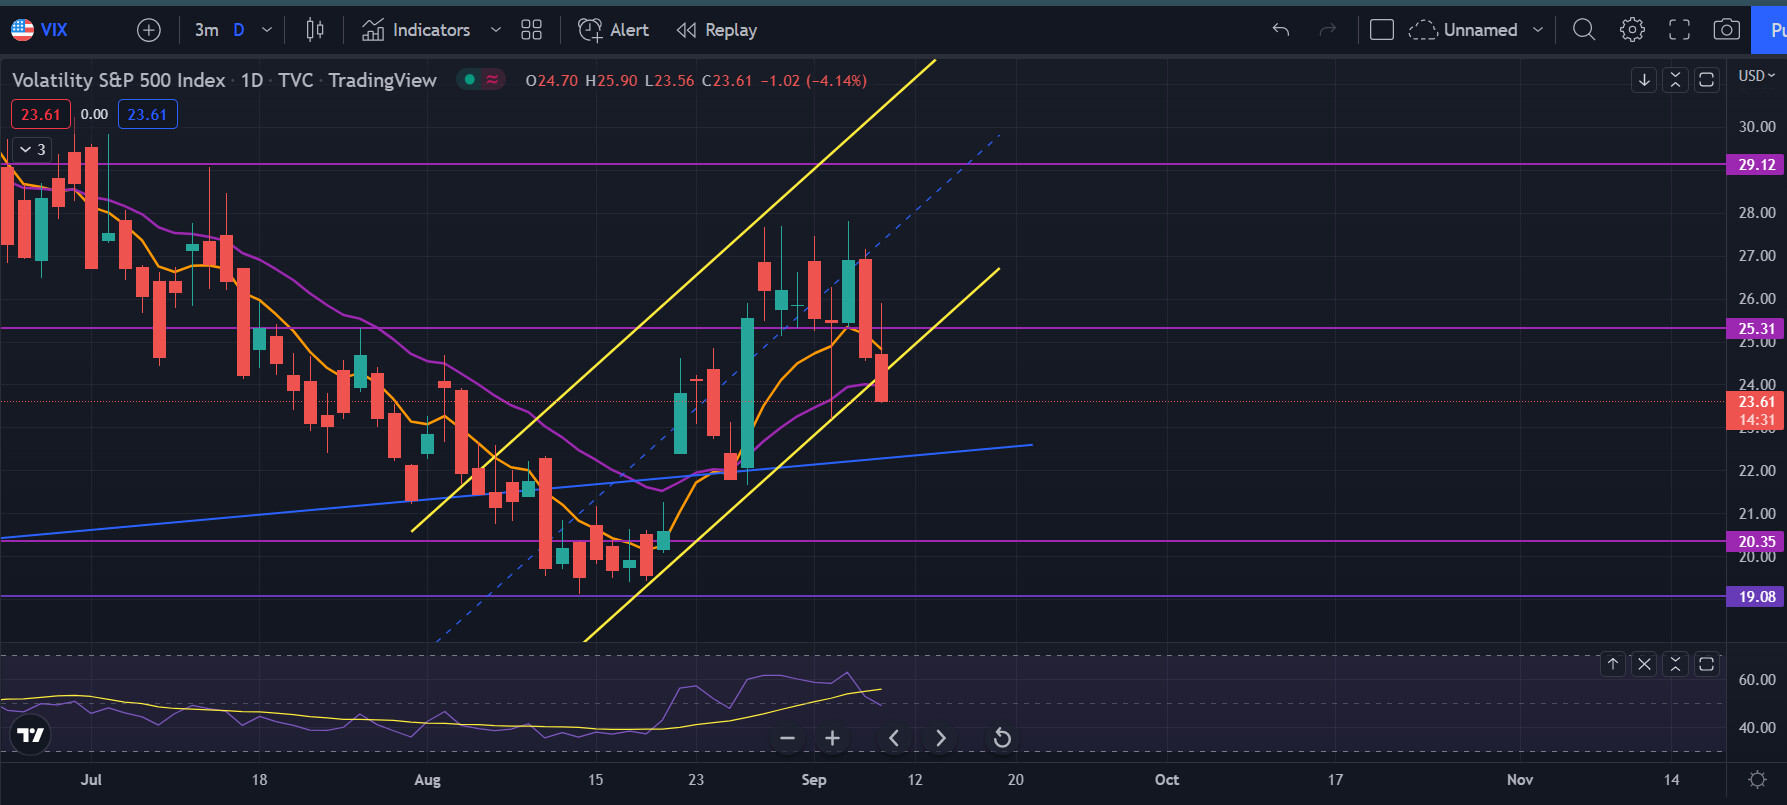
VIX died again today. Just blew past the trendlines. Interesting to see. I’ll be watching the blue uptrend line now. Overall, seems like markets want to turn bullish and is fighting hard for it.
Something to note is that the dollar did not die and is flat and the yields rose today. I’m taking this as an warning sign that this rally will fizzle out soon. Although anything can happen and this disconnection can continue for a while longer.
Overall, markets might be starting to change the trend so be careful for the next upcoming days if you’re fighting against the green trend right now.
3 Likes
Want to throw this in here to get some confirmation bias or just some feedback.
Ive been starring at the spy daily a lot lately and something started to stand out.
SPY’s 8 days of consolidation.
When SPY has a strong push into a resistance or support. We tend to get a small period of consolidating of roughly a $10 range before the next big move. Some of these are continuations and some are influx points. My thoughts are if we have the Macro correct we could make a good judgement on swing trades. Also most of this seems to be in the middle of the daily channel not at its high or low point.
12/7 - 12/16 (9 days)
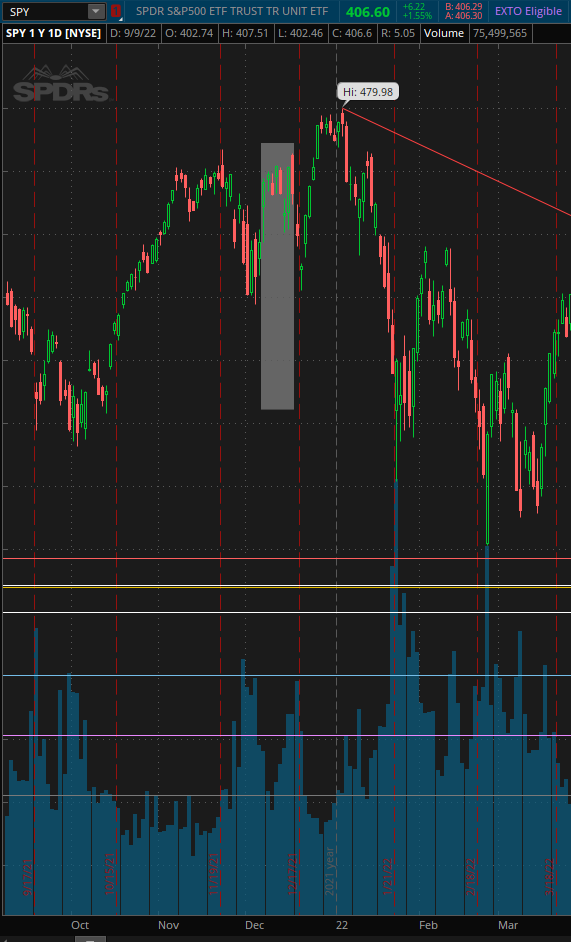
12/27 - 1/4 (7 Days)
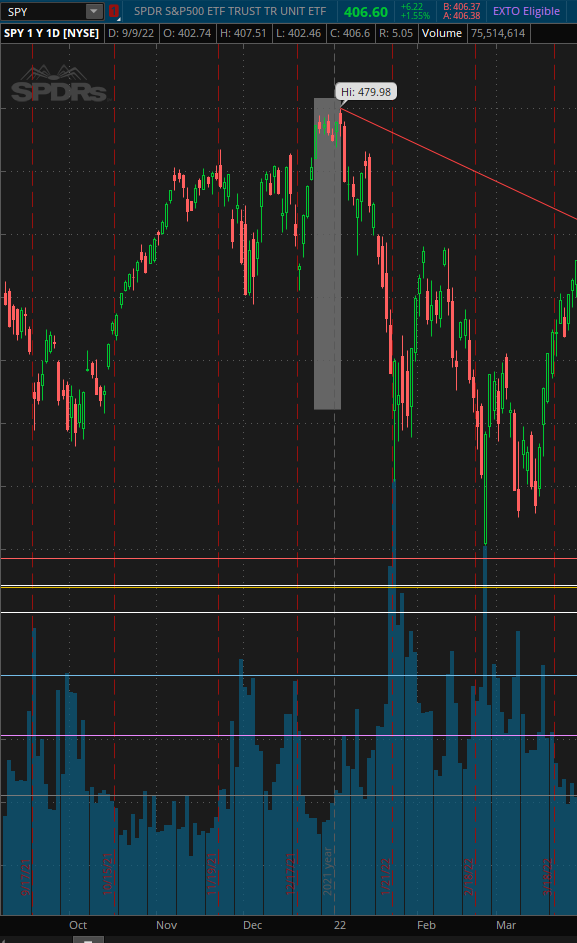
2/1 - 2/10 (8 Days)
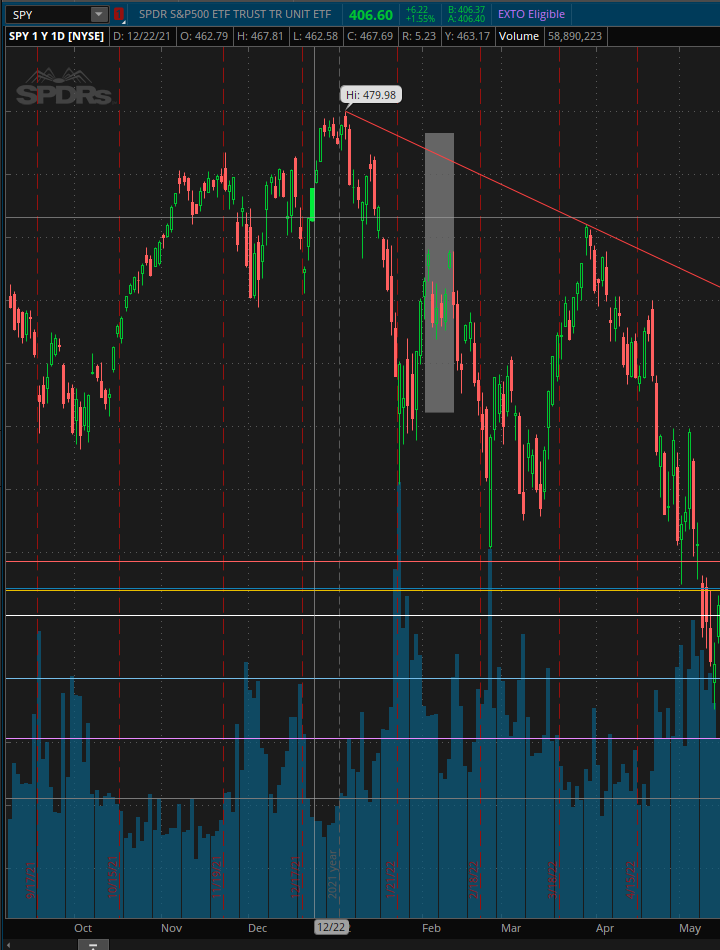
3/6 - 3/15 (8 Days)
4/11 - 4/21 (8 Days)
5/27 - 6/8 (8 Days)

7/29 - 8/9 (8 Days)
Not sure if this is the correct spot to put this but @Yong is the TA master and i wanted him to see it.
Part of this as well is i cant stare at the charts all day so id like to swing the larger movement over a few days. So im trying to identify opportunities to do that.
5 Likes
Brent from SpotGamma makes the case that some of the opex-related rally got front run in this episode of the Market Huddle.
This was the delta notional going into last week.
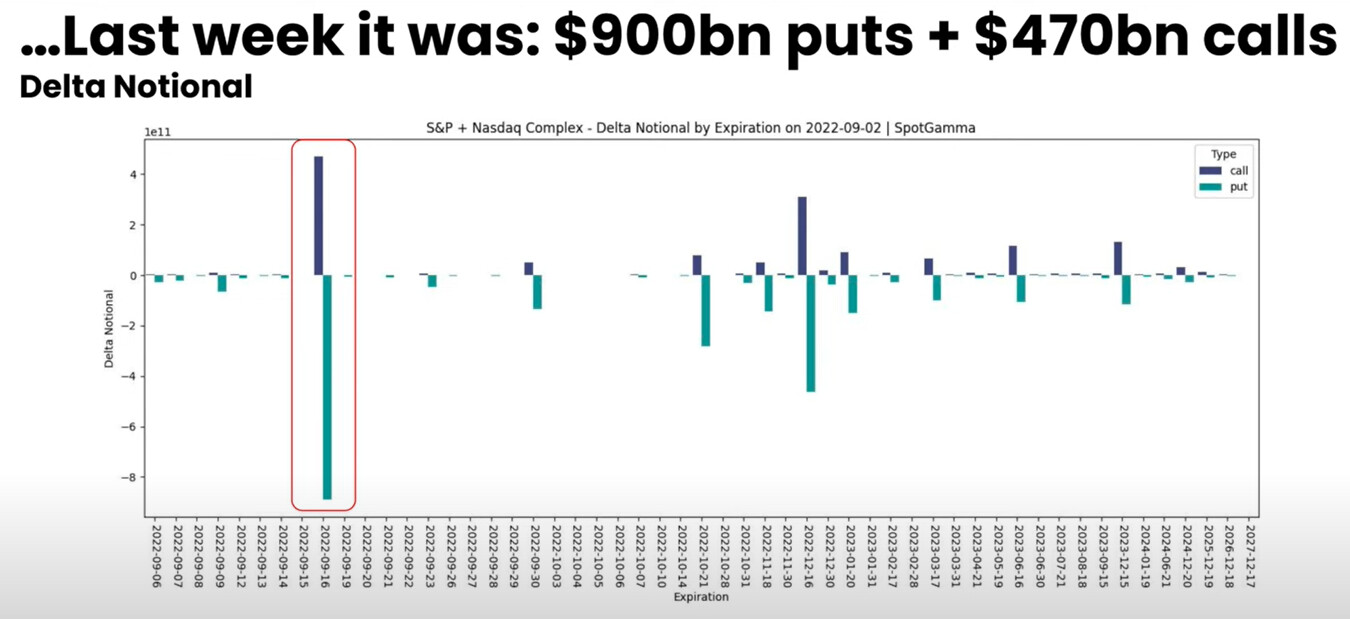
A reduction in vol and upward movement also set off the feedback loop of MMs dehedging puts, resulting in this being the current delta notional position:
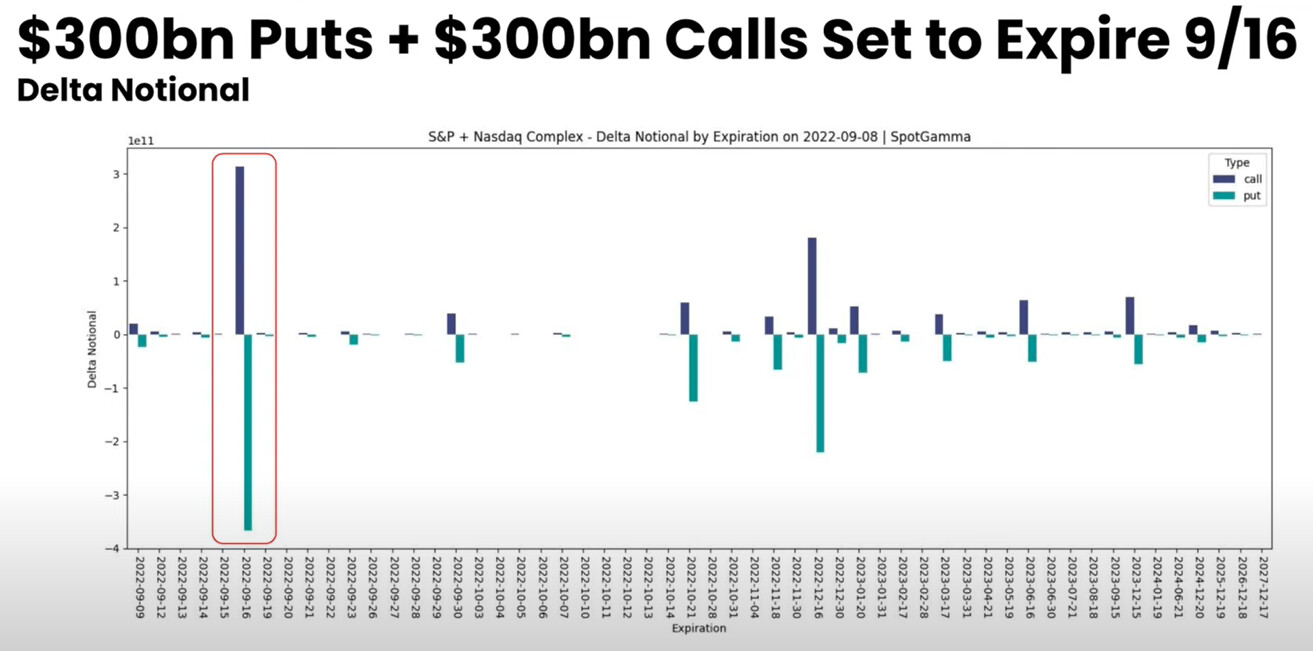
That is a rather huge amount of puts that MMs do not have to hedge for by going short, providing very nice rally fuel. If we believe that the rally is positional, then it is unlikely to sustain itself.
@SuckyMayor would you have the daily delta notional amounts for puts and calls over the last week or two? Would be interesting to see if we can see this correlation on the daily level.
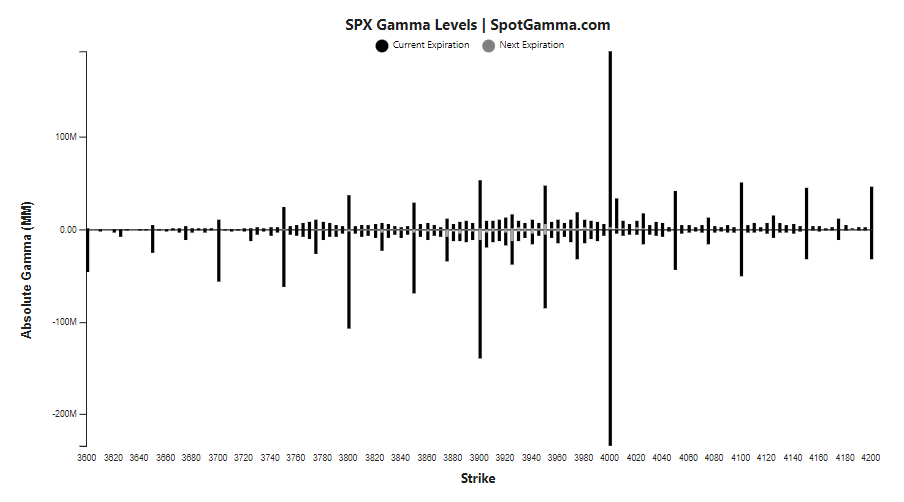
Going into next week, this is what the option gamma complex looks like now:
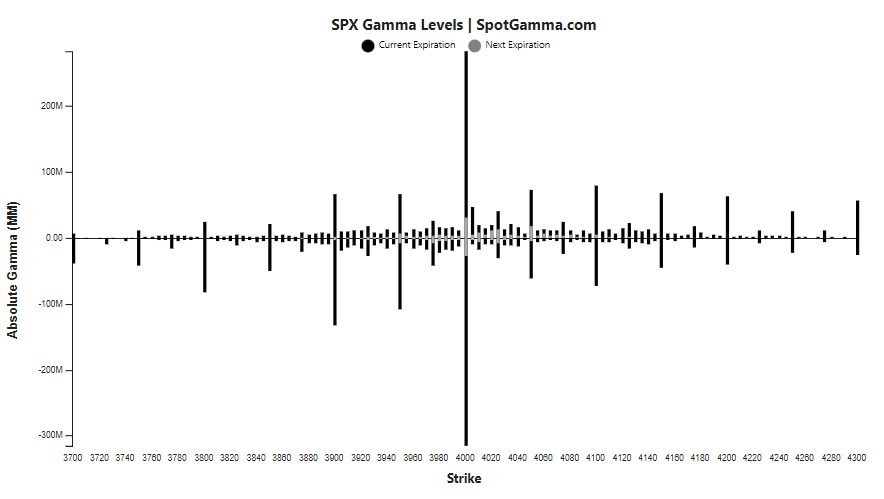
Thus, very little support in either direction.
If the rally fuel was positional and is exhausted, then we should drift back down to the 4000 level up to CPI. And then fly away from 4000 rather vigorously after.
1 Like
Appreciate you sharing this Ni.
If I’m being blunt, much of SG’s callouts have been leaning bearish + finding greek reasons as to rallies vs general market sentiment. I do like using it as a data point, but it seems like day in day out they’re of the camp that markets should just be dying everyday and rallies aren’t driven by anything but options hedging/de-hedging.
I do see and understand the case as this rally being a front-runner, but more in the sense market is already pricing in a lower than expected CPI.
Call me ignorant, but if CPI does come in lower than expected, I don’t see a world where the market trends down on a good print, regardless of certain sectors of inflation showing signs of maintaining (most notably services and rent). This was the case last print, and considering the levels markets are at around this CPI print, it’s unlikely to be any different.
Markets are generally supposed to go up, and without a catalyst for it to go down, it’ll be the case until the end of time. I don’t think it’ll be hulk dildos day after day but looking at the market from a higher level vs a scope of options greeks will provide us better fluidness in playing it correctly.
All this to say CPI will be the main drivers for how markets run rest of the week, and considering it’s Tuesday morning, I’d be hard pressed to see it ‘drift’ down 75 basis points just based on SG’s findings.
We’ll see how things shake up Monday but I’m personally grabbing calls as I’m expecting a lower print.
3 Likes
Tl;dr: SG data sound totally be taken with a grain of salt; their bearishness aligns with bearishness in the market; I add my own dose of bearishness on top of everything; fwiw, they have predicted bullish moves in a timely manner too.
Great points, @swoleappa . SG does tend to have a bearish bias these days, and I think I add a fair bit of my own bearishness to it too. They seem better at explaining what happened after the fact, and that can stink of hindsight bias. And my inference drawn from their data last week was almost exactly wrong, and it is virtually impossible for us to end anywhere close to 3700 by opex.
It is always good to question sources of data and I appreciate you pointing this out.
Nevertheless, I do feel like I can rely on their data for a couple of reasons.
While their explanations appear in hindsight, there is a method to them and they do not seem arbitrary. I wish we could use this information for prediction, but perhaps being able to understand is the next best thing. The explanations seem reliable because data subsequently available lines up well. (If this data was available real time, we could predict with them too.)
Option flows seem to have similar levels of impact on market movement as DXY and VIX. Since I study them almost every week, I can say that I’ve generally found them to be aligned with how the market moves. And their findings are aligned with others who study and trade the option market and volatility - they are just the most accessible.
If they sound more bearish overall, perhaps it is because the market has been bearish overall. SPY was down 23% at one point, and are still down 14%. We’ve had more lower highs than higher highs, and the drops have been greater than the rallies.
Now, how do we reconcile this state of affairs with this statement, which we also generally hold to be true:
Here’s the fascinating thing - YTD, SPY had 94 up days, and 79 down days. (My calc.) So you’re right - markets have been up more days than not. Yet, overall, it is down. And that’s because the “down” days have been more pronounced then the “up” days. That SG is able to see the general direction even though more days are against them than not is, I think, admirable.
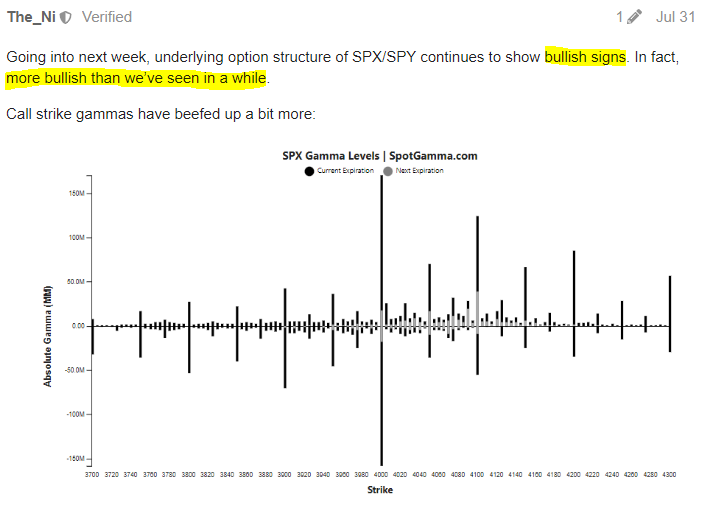
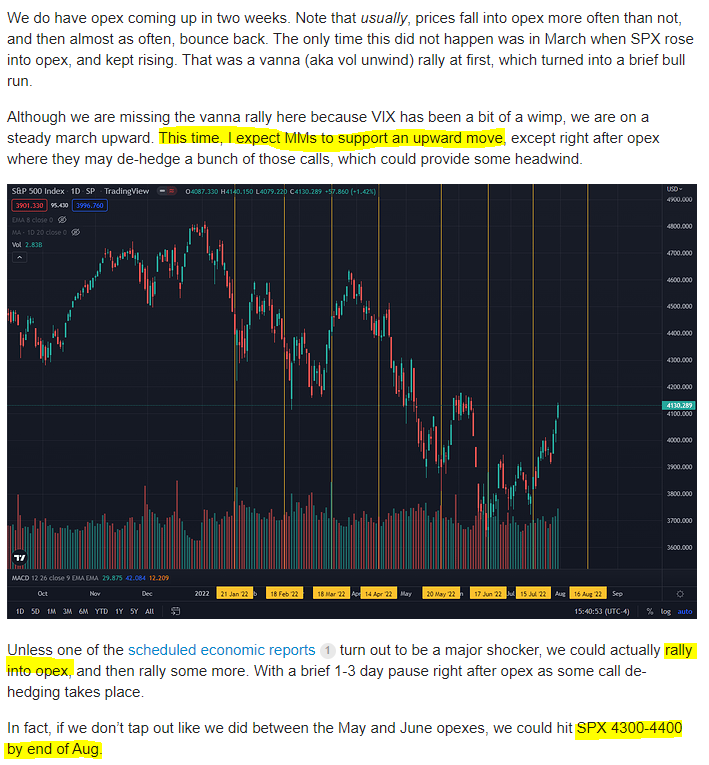
Finally, there are the counterfactuals - they have been bullish at the right times too. We noted at the end of July how the option structure had turned bullish, and I’d estimated a 4300-4400 top by end of Aug. I was off by 2 weeks and we capped off at 4300, but the overall direction was correct for 2 more weeks…
To be fair, as the interpreter of this data, I also contribute to the bearish tone because of my own bearish tendencies in this market. When things don’t quite go as expected, and I go back to the data, I will often realize that my own reading was more bearish than the data was suggesting. It’s been a huge learning process all through, but net-net, it feels like SG is helpful more often than not ![]()
17 Likes
TLDR: The trend seems bullish right now. I wouldn’t bet against the trend for now, at least until the CPI reading. And if the CPI reading next week comes in better than expected, expect a huge short squeeze to happen.
So SPY on the hourly is looking very bullish. Just blowing past all resistances and tracking up. No bearish divergences either which is good. One thing that does worry me is that the RSI is becoming very overextended. I’m looking for a pullback before the next leg up. For me, that would be near the 403-404 area since that’s where the 21 EMA is on the hourly. Overall, hourly looks bullish, but I’m waiting for a pullback to enter into swing calls.
On the daily, it’s also looking very bullish. Blew past the big 21 EMA and the green trendline. Couple of things to note though is t=what @SoFarOTM mentioned above. SPY has its consolidation days which we are approaching right now. That would be in the 407 to 417 range. We could potentially just trade sideways from here for a bit, which would make sense honestly. We’re nearing a downtrend line, overextended on shorter timeframes, RSI on the daily is at the 50 level to turn bullish and the MACD is looking to get back above the 0 line on the daily. Lots of resistances for SPY here, so I wouldn’t be surprised at a consolidation week. But one thing that makes me hesitant to say that is that CPI is next week and that could just mean that we don’t consolidate. Overall though, the daily does look bullish and I would look for one more day of follow through bullishness to confirm the trend since there are still some resistances above.

Further adding onto the consolidation theory is that the weekly chart is at resistance too. The 21 EMA acts as a strong support and resistance on the weekly chart, which we are at right now. With all these resistances above, we could be accumulating buyers here. One thing to note is that we do have a bullish engulfing candle on the weekly. That is a bullish sign and potentially a sign that there will be more bullish momentum incoming, although again, CPI could change all of that.
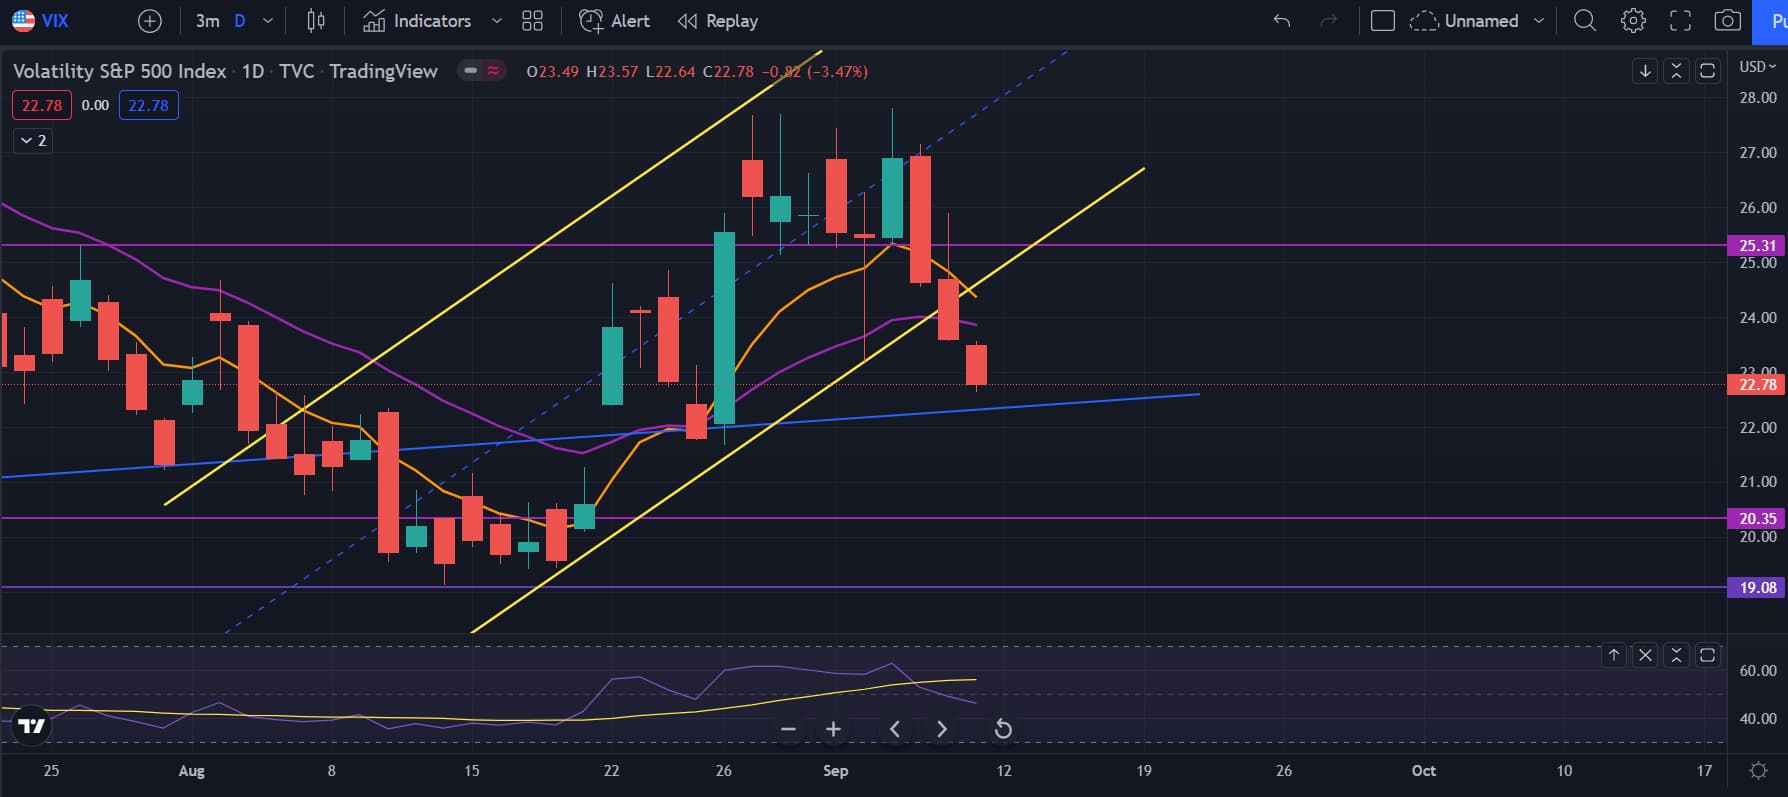
Yeah VIX died again. Moving on.
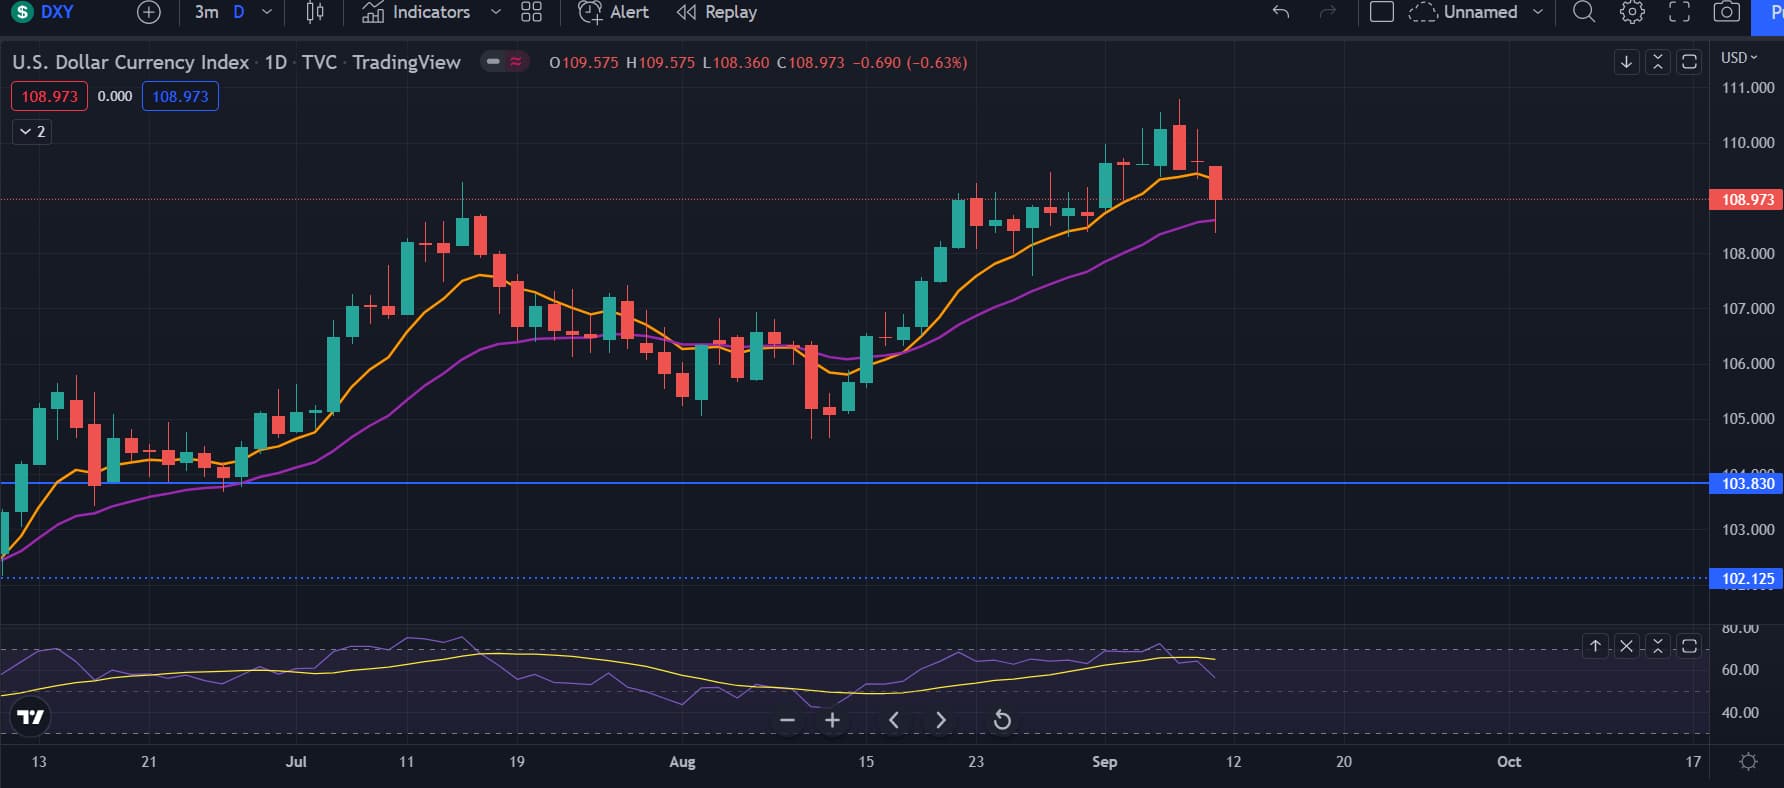
The good sign for stocks right now is that the dollar seems to have made a local top right now. If the dollar continues to track down, this is a great sign that we will have more upside instead of this just being a bull trap leading into some huge red days. Also looking at the weekly chart for the dollar, DXY did form a topping candle so we’ll see if that means further dollar weakness next week. This would line up well with the stock market pushing up higher.
Overall, lots of resistances above that could cause consolidation weeks before the next leg up or down. Charts are all looking bullish, but since CPI is next Tuesday, I wouldn’t go long or short in anything right now unless you want to gamble. Who knows when we’ll consolidate, but it seems like we’re nearing the zone where we do tend to consolidate so don’t get whipsawed around folks.
5 Likes
TLDR: CPI is tomorrow so market will move depending on that, not TA. Just watch the news and wait for the trend.
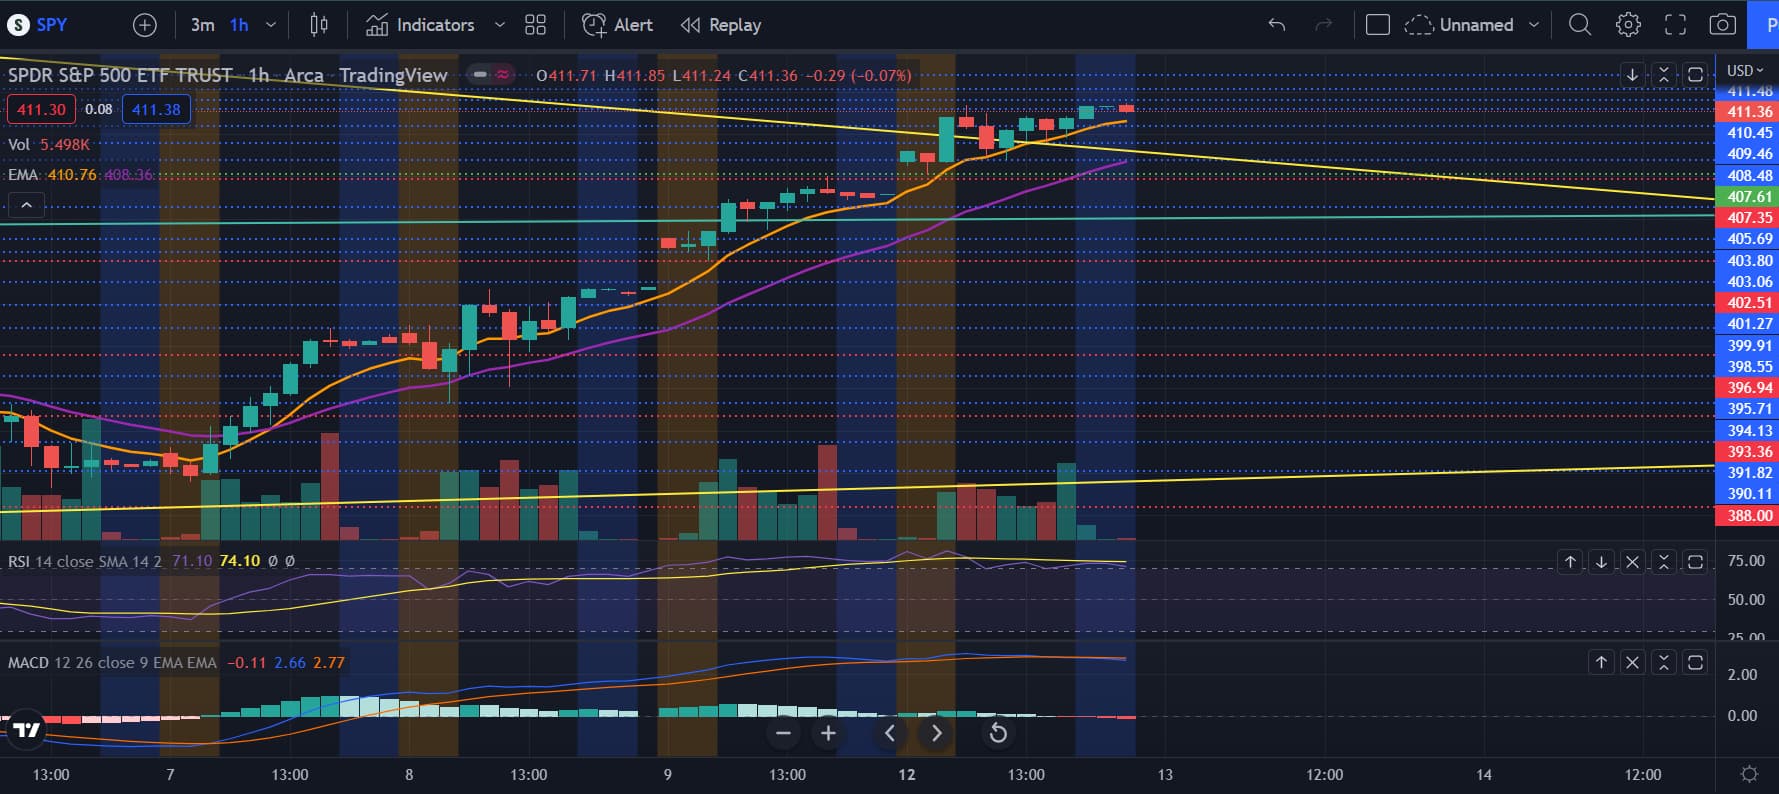
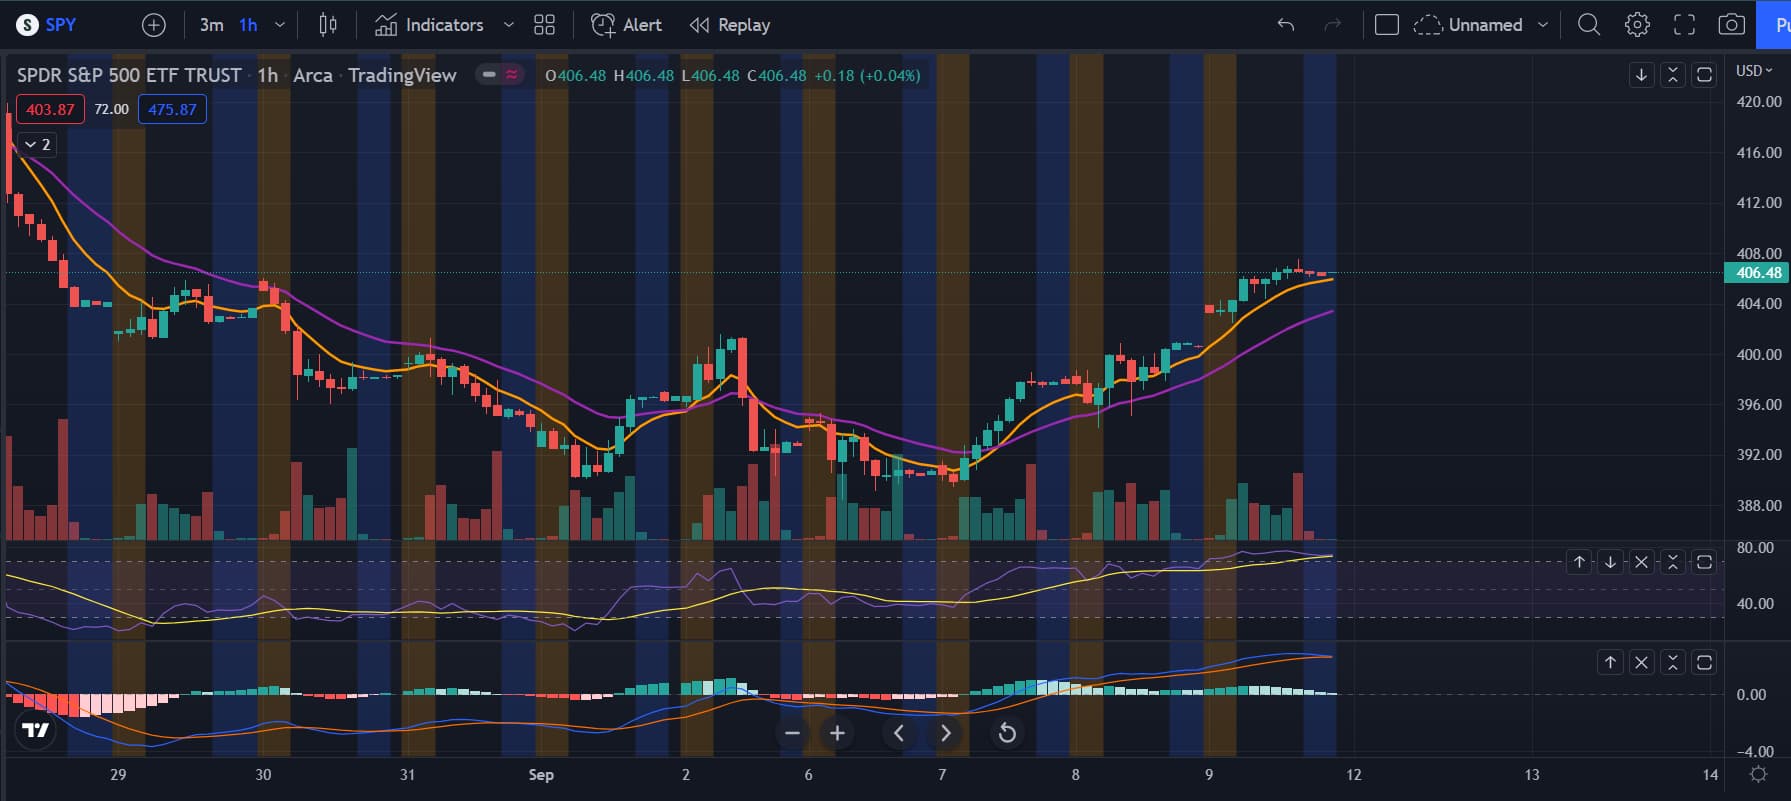
The hourly chart on SPY looks very bullish, although it is overextended and looking like it wants to pullback a little. Either way though, it’s tracking up along the 8 EMA and I probably will take a call at the 21 EMA if the CPI is good. RSI is overextended, but on big bear market rallies, we have tended to stay in this area so not too worried as long as news is good. MACD is slightly bearish but it’s a shitty indicator so idc. Overall, very bullish on the hourly and waiting for a better entry.
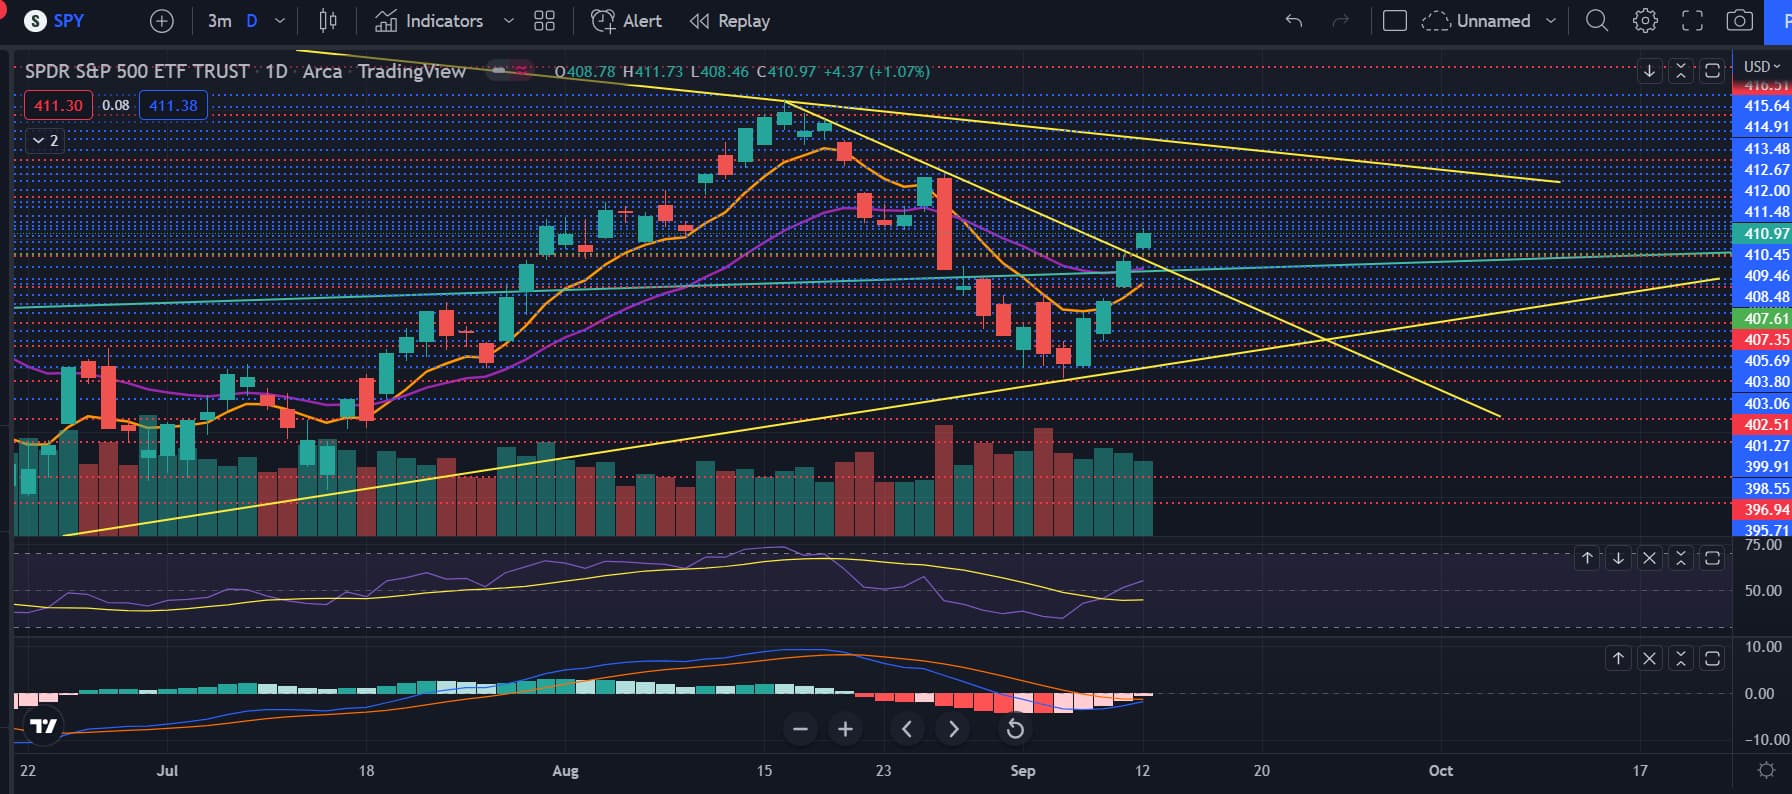
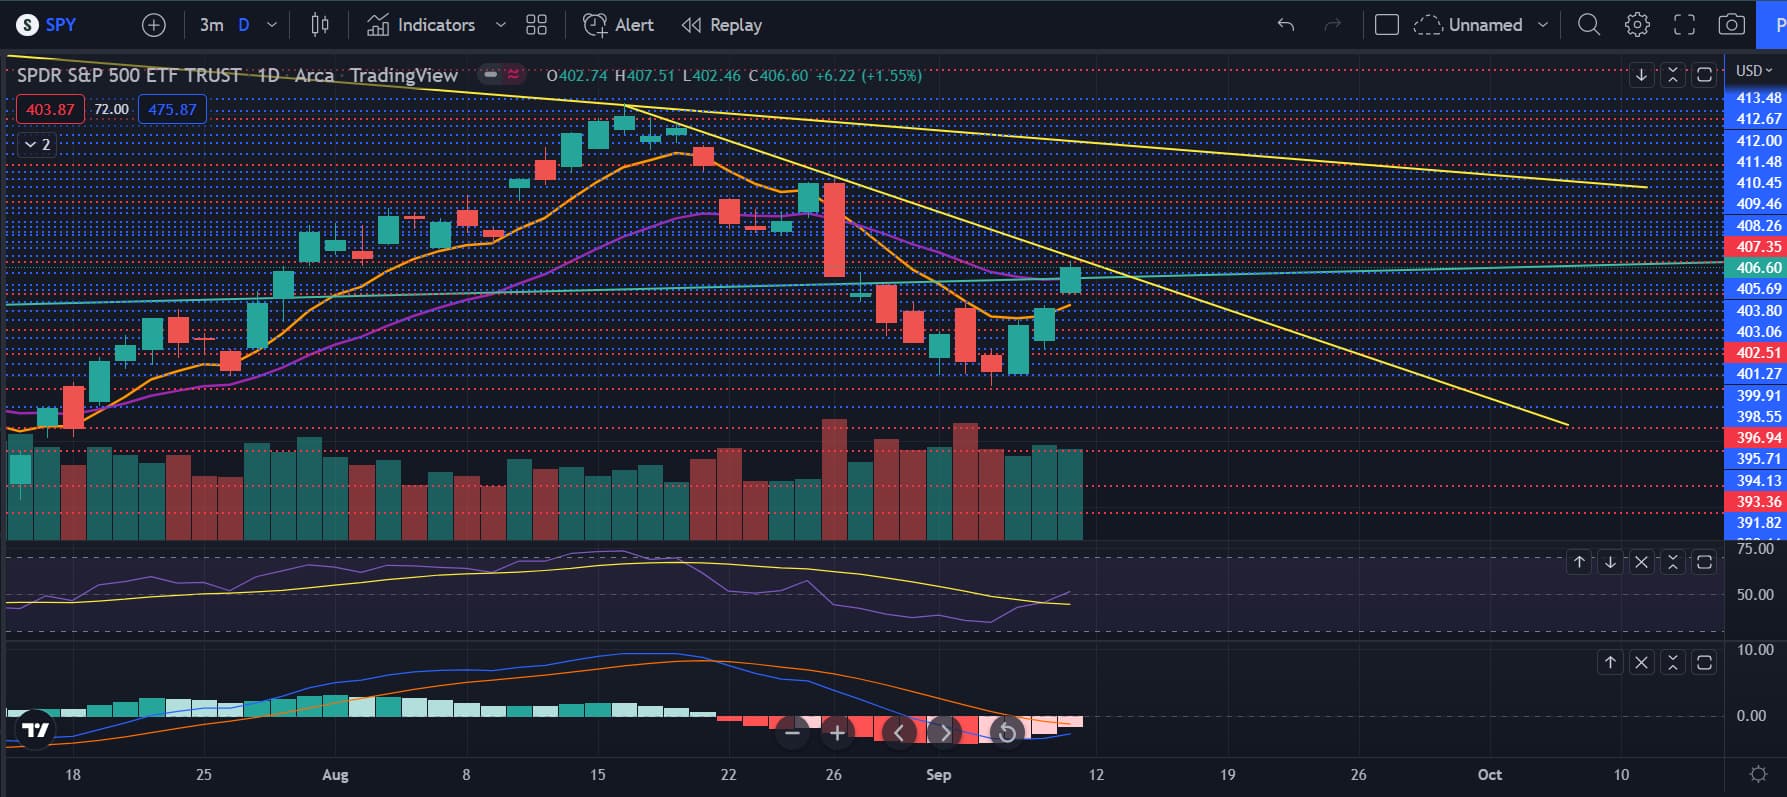
The daily is also very bullish. Broke out of a downtrend line with good volume and just continuing to track up. This is a confirmed bull trend for me, RSI above 50, MACD is firming up and about to turn green and the volume is there for the rally. The next place the rally will probably halt is there the bigger downtrend line, but again CPI has to come in good for that. One thing that does worry me is the decreasing volume on the green days, but we’ll see if that picks up again after the news comes out.
Overall, charts and TA are all screaming bullish. Dollar is falling down, yields aren’t spiking, VIX is low and things are blowing past resistances right now. The TA is bullish, but CPI can change all of that. Just be careful out there.
Just to conclude, markets are looking bullish, but CPI will confirm that fully. Don’t be retarded and trade the way you want markets to move. Trade what the market is doing.
3 Likes
TLDR: Just a little bearish day, nothing crazy other than a 4.35% drop on SPY. Seems like we’re going to be a little bearish for the next upcoming days.
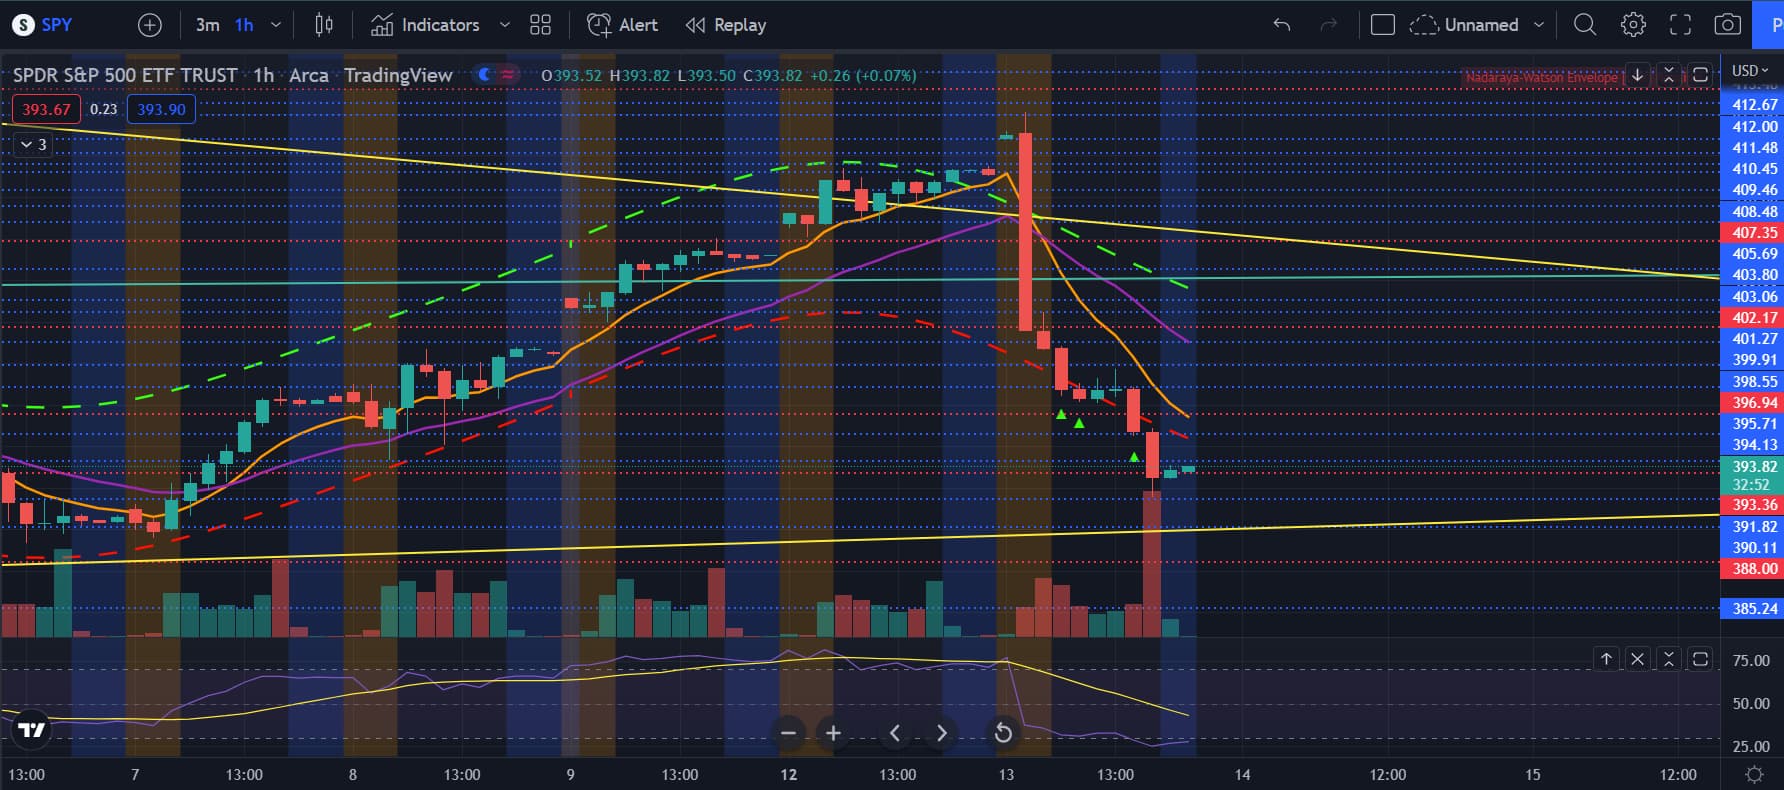
So SPY hourly looks fucking dead. No buyers, just straight down. We are oversold on the RSI, but on these red days and red trend (no buyers), we stay in this oversold zone for around a day or more, so it doesn’t mean that we’re due for a rally or anything. One thing I am looking at is the lower zone of my indicator. The red dotted line acts as like a bollinger band or whatever - just tells the extremes. Right now, we are very overextended so we could have another little push up before falling lower, but nothing that you want to bet on right now. But yeah, SPY is very bearish and I wouldn’t look for support until like 390-388.
SPY daily does look very bearish too - big volume and blew past all supports. One thing that makes me say that we should watch out for the 390-388 support is because the uptrend line from the June bottoms to the other bottoms recently is at 390. Another reason why I also say 388 is because that’s my strong support level based on volume and where the overextension line is. But yeah, overall, bearish as fuck.
Even though everything does look bearish, I am actually going to enter some calls tomorrow if we do reach the 390-388 zone. The reason is because VIX is up over 10% today. I did a couple TA on this before, but when this happens, there is like a 80%+ that we’ll have a big green day in the next 2 days. But that doesn’t mean that the downtrend will be over, just a rally for better entries on longer dated puts.

Yields skyrocketed as people are expecting the fed to be hawkish for a longer time. Not good for stocks and it seems like we’re on pace to retest or break the June low. So just be careful. Just the yields start to actually roll over, we are still in a downtrend and all rallies are bull traps.
The dollar spiked up high again. If anyone has an ETF for the dollar, that would be appreciated because I think the dollar still has room to run higher. Anyways, dollar is running which means the stock market should continue to go down.
Overall, markets seem shitty and on pace to break the June low. I am not entering longer dated puts here because I am betting on some kind of rebound in the upcoming days based on the VIX probability. I don’t know how much of a bad PPI print is priced in, but there is a good chance that the market goes lower just based strictly on fear. Be careful everyone and good luck.
9 Likes
Check out UUP, USDU for bullish and UDN for bearish
2 Likes
TLDR: We might have another push to 397, but I’m honestly betting on another leg lower now.

So the VIX being up 10% correlating to a rally turned out to be true, we were up 0.38% today. Typically, the day after VIX being up 10% in a day turns out to be very volatile with a wide range today. Then afterwards, it’s pretty 50/50 on having a huge green or red day. So I think we’ll get a trend day tomorrow, although I do think that we are going to get another leg lower soon - whether tomorrow is green or not.
Anyways, SPY on the hourly is still bearish, hasn’t crossed over the 21 EMA and the RSI is still below the 50 level. Nothing to be bullish about here, especially when we haven’t broke above any critical resistance such as the 400 level. So yeah, this could just be consolidation before the next leg down.
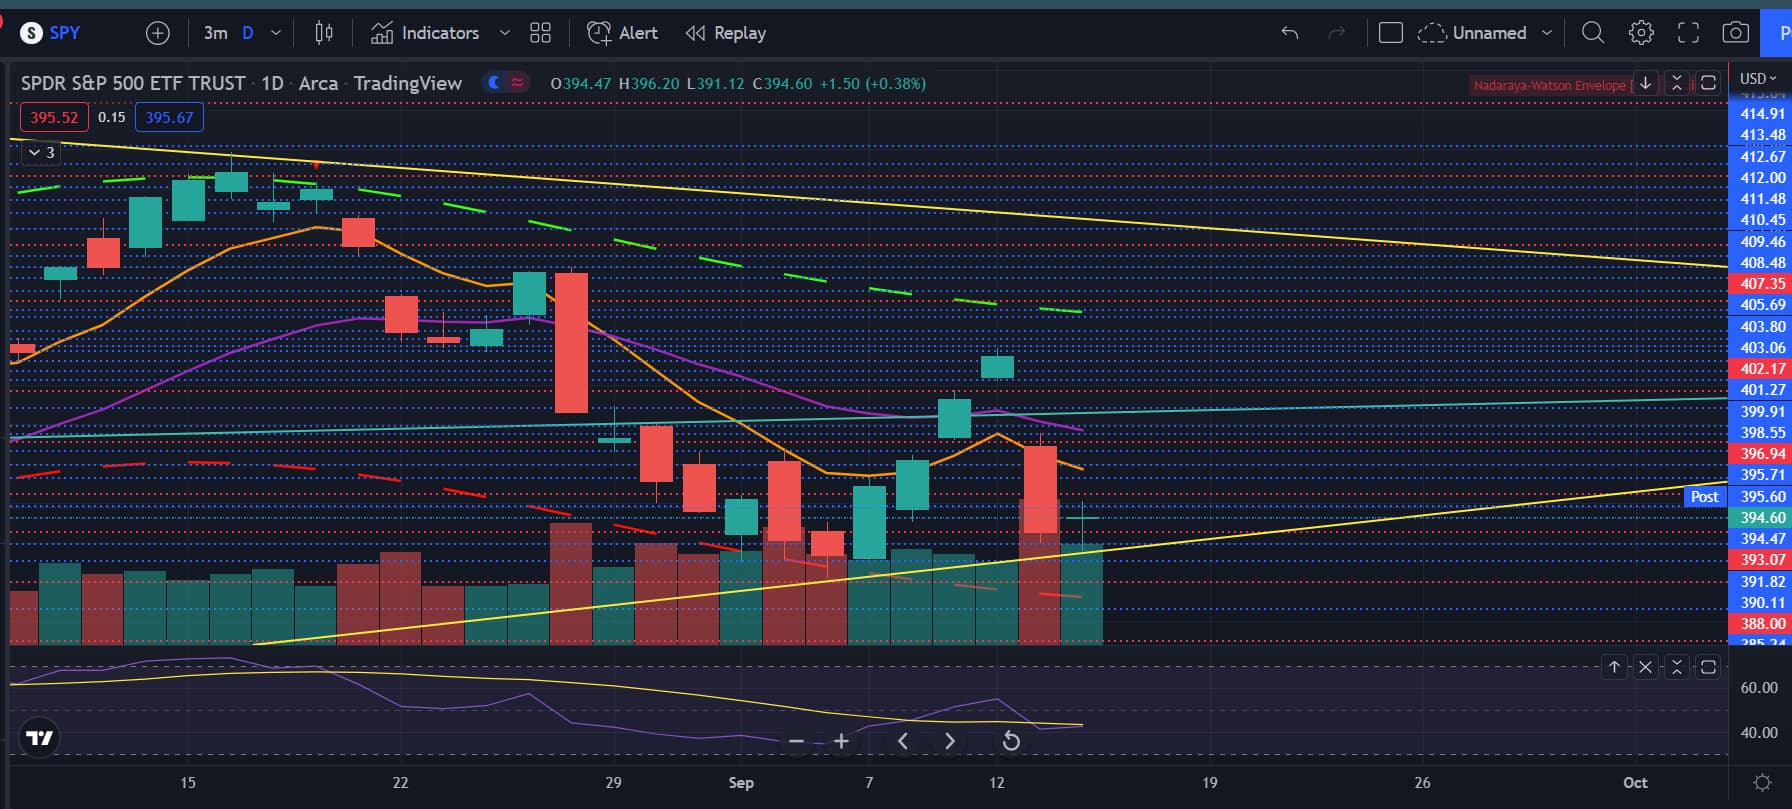
The daily chart shows a sexy ass bounce off the uptrend line. Almost damn near perfect. It’s amazing to see. When we break this, I think that’ll be a quick trip to the June lows. On the daily chart, I am looking at the 8/21 EMAs and 397 as my key levels to look out for. We can reject off any of those levels so lots of work to be done for bulls.
VIX is just hovering here. I think we’ll see a breakout on the VIX soon and cause another leg down.
Overall, the markets are bearish and this rally up - if we do see it - should just be seen as a relief rally rather than a change of trend rally. We’ll see what happens, but don’t get caught on the wrong side of the trade and get blown out. Let me repeat - the trend is bearish.
2 Likes
The SPX 4000 level is absolutely engorged, so it is likely to continue to play that “magnet” role into opex on Friday. And a decent amount of put concentration at 3950 and 3900, so decent support on the downside. This suggests that without some external trigger, we will likely rattle around in the 3900-4000 channel into the end of the week.
One interesting thing from the strike changes below - not a lot of call buying over 4000, but a ton of put buying below it. While this gives great protection to the downside, it also points to much-decreased upside sentiment.
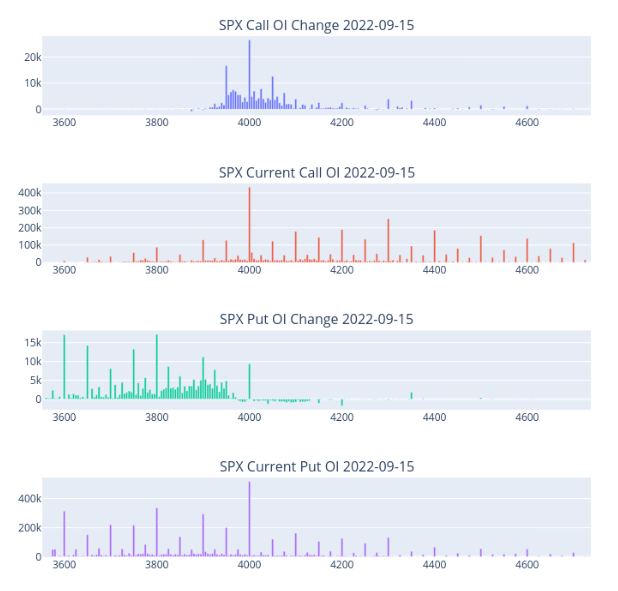
This makes the opex potentially boring, but sets us up for excitement the week after. More on that on Friday as it depends on where the market and the option complex ends up relative to each other.
6 Likes