Hey guys! It’s my most favorite time of the year which is the rebound of earnings. I’m going to kick off an earnings journal starting next week and post weekly updates as to what it is I’m eyeing to play. I’ll provide some retrospective after each play to tell you what I saw, how I played it, and how I did.
For those who don’t know, I keep a famously small portfolio and since the start of the year it’s even smaller than usual as I pulled out some funds to supplement Christmas for the kids. Do not expect to see life-changing gains or losses getting posted about here. My goal is not to gloat, but rather to give you some insight into what I see before earnings calls, the decisions I’ve taught myself to make, and generally hoping to demystify some of what goes through my head so you don’t have to look for my callouts every time there’s an earnings call.
With that said, next week is going to be a fun one! There’s a few notable ones that we can start rubbing our hands together on now:
Monday, January 24
IBM - After-Hours
Tuesday, January 25
JNJ (Johnson and Johnson) - Pre-Market
MSFT (Microsoft) - After-Hours ++
Wednesday, January 26
TSLA (Tesla) - After-Hours ++
INTC (Intel) - After-Hours
Thursday, January 27
MCD (McDonalds) - Pre-Market
AAPL (Apple) - After-Hours ++
HOOD (Robinhood) - After-Hours ++
X (United Steel) - After-Hours
Friday, January 28
Not a whole lot piques my interest on Friday
It’s unlikely that I will play all of these, but those noted with a ++ mean that I will be actively taking positions in these earnings.
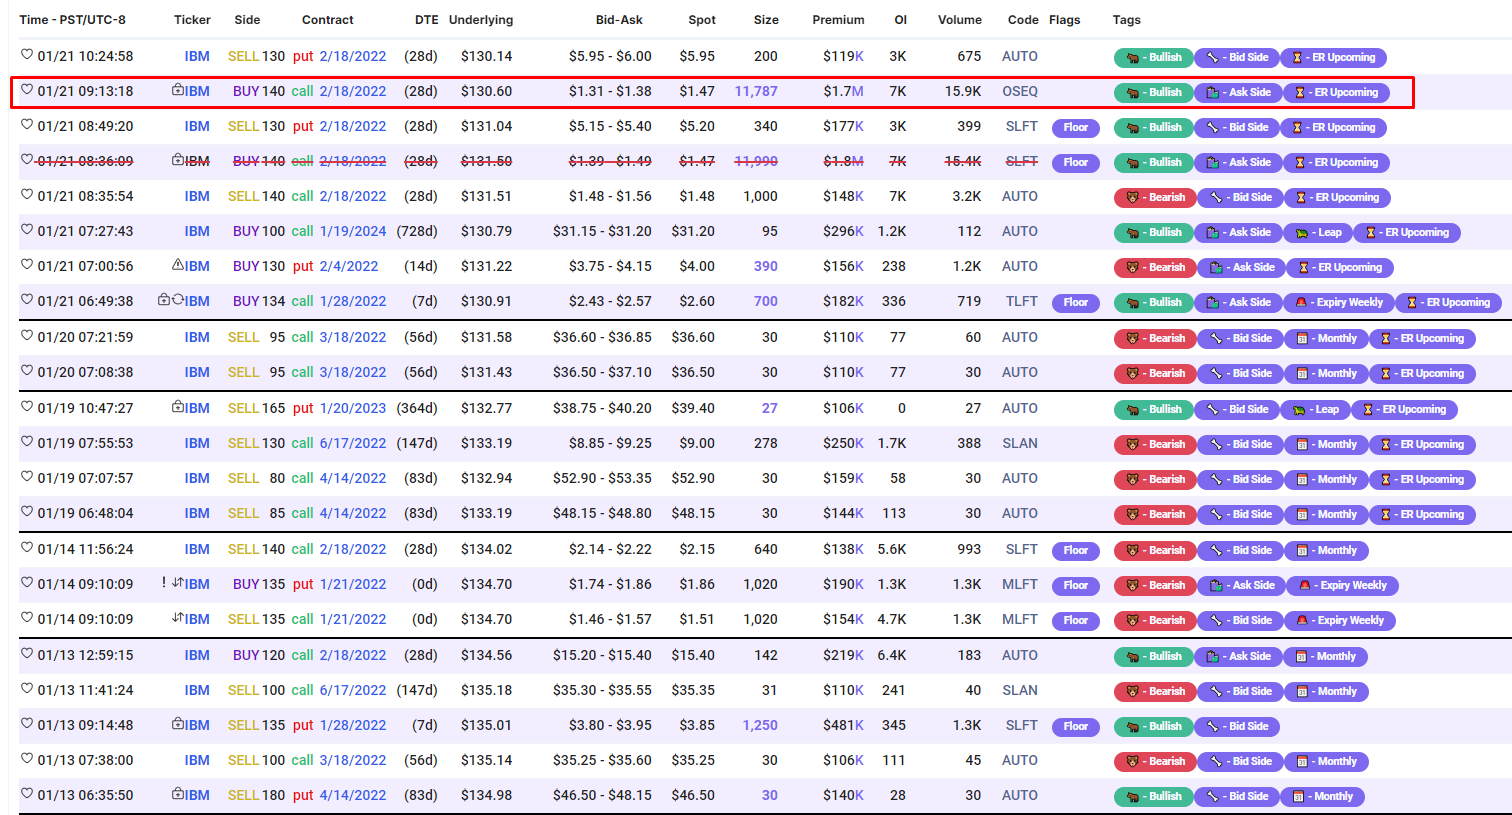
100K filter. Nothing looks obvious as part of a potential spread here.
It’s also a confirmed “To Open” transaction, filled at 1.47 apparently when the bid/ask is 1.31-1.38??
I can do these for all the charts above if it is useful. Price action in and around earnings for MSFT. I looked at the one for NFLX and almost every earnings they dumped after. Failed to take action on it. But in general I find these useful to see what kind of price swings one might expect so they can plan ITM or OTM options.
Actually what I started to write as a general response might pique your interest.
Since writing this I’ve found that the Polygon APIs provide wonderful candle data. Plug in an earnings date, measure the window I look at pre-close and see how well the stock historically abides by the method over the prior 7 earnings calls. So far I’ve experimented with TSLA, however I’m going to mature this over the coming days and see if I can start to quantify those patterns to better identify which plays may yield the best results.
I’ll keep you in the know about what I uncover though! I have a wild vision in my head that I want to take some time to put more thought around.
These are extremely time sensitive, i.e. minutes before market close. I wonder if this becomes decently reliable and after you are comfortable, could you have some sort of alert channel like Conq and JB?
Super time sensitive for sure, I often have less than 5 minutes to position myself before market close. I floated the idea of announcements and it was a lukewarm reception for good reason: the method has existed for three months and needs more data to really solidify the approach. Such methods I also wouldn’t want someone new to think is a “sure thing” and I’d hate to have someone jump on thinking it’s an official play and get burned by the fact that it’s not perfect.
For the time being I’d rather teach what I’m doing and seeing. It also gives me the opportunity to do retrospective on the failures and find ways to strengthen the strategy or, in what I’m honestly doing with TSLA now, look at possible reasons to sit it out.
I would be lying if I said I was expecting to make a process diagram today, but this is effectively what I’m looking to spin up. I found that Polygon has great free access to historical candles (2 years) and Finnhub has great free access to earnings information. Looking at blending the two of them to make an application that simply shows data for now so I don’t need to pull it all manually.
To be cliche, the largest obstacle with this is probably just going to be timezone conversions. Given a bit of time I can probably throw together a POC in a couple of hours.
I find your flow chart and idea fascinating. Would be cool to add a database component and run this back as far as your trial data gets storing your results. Might give you some useful insights on how that slope calculation and assignment would have held up in previous earnings. Thanks for pointing out the open API’s gonna play with those today.
Humorously, I have a REST callout infrastructure built in Excel and that’s where I tend to start most of my POCs because of data storage (Excel doesn’t work when you have to have it on and running in order for it to work, so it scales for shit). I also like starting with Excel because it gives me an opportunity to get a better feel for the data by getting my hands on it which helps with any translations that may be needed.
Ahh One step ahead lmao, that makes alot of sense! Thanks for explaining. Do you think you could apply t-test on the average of past earnings assignment and your current pull?
If you could how far back in earning would you need to go you think and when does sentiment and broader market conditions break this idea down. Just some thoughts you got me spinning on a Saturday!
Big shoutout to @DakkJaniels for pointing out my dumb mistake - slope should be a function of price over time. My PDF shows it as a function of time over price which was resulting in huge slopes.
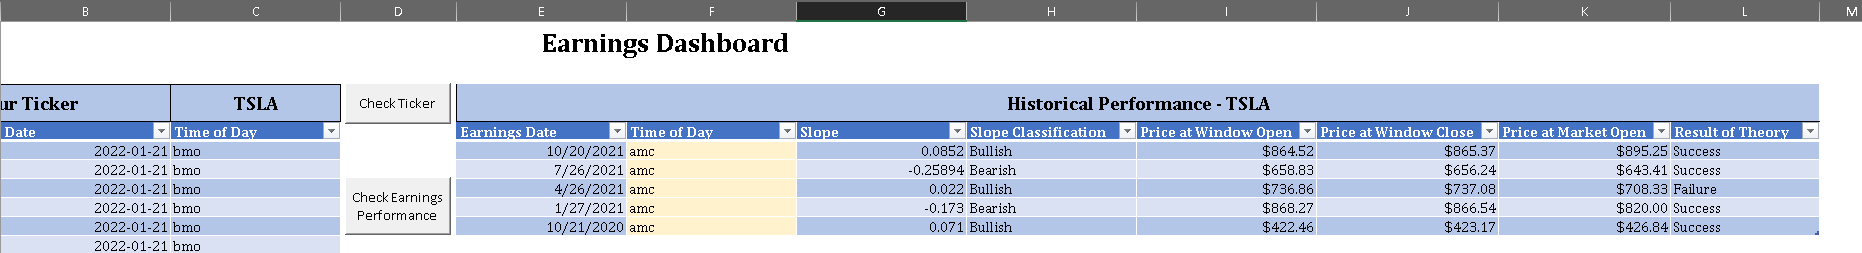
Anyhow, I got my POC stood up with some limitations. I learned that Finnhub only gives a month of earnings data on the free tier so my current POC requires that I populate the time of day that earnings were released prior to calling out for the candles.
Here’s a screenshot of what I threw together using TSLA as an example. We can see that they abide by this theory roughly 80% of the time, which coincidentally is about my success rate for doing this by hand.