Just a quick post on bookmap and 2 scalps using bookmap.
2 quick scalps on SPY from this morning, still loads of chop so it’s hard to trade with no clear trend.
A way to scalp SPY (Or any stock) without a clear trend or strong daily support/resistance is against liquidity.
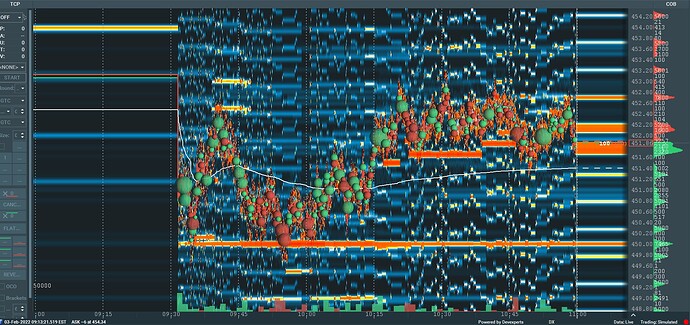
Top picture is bookmap, saw on the tradingfloor that most people didn’t know what it was so a quick introduction.
The red and green bubbles are market orders, the size and the green/red colour are determined by the net difference between market buyers/sellers (and shorts) in that timeframe. A big green bubble for example implies loads of buyers buying on the ask.
The white vertical line you see at 11:01 is the line between real time on the right and historical time on the left.
Everything to the left of the line are historical orders ( the heat) and the tape (the bubbles)
Everything to the right of the line are current orders in the LVL 2.
It’s really just the LVL 2 visualised.
The heat (colour) is relative to the size of the orders that are on the screen.
Now the SPY bookmap chart always looks a bit weird because of Algo orders, you can see the weird blue patterns all over the screen. This is all just noise, only pay attention to the big orders.
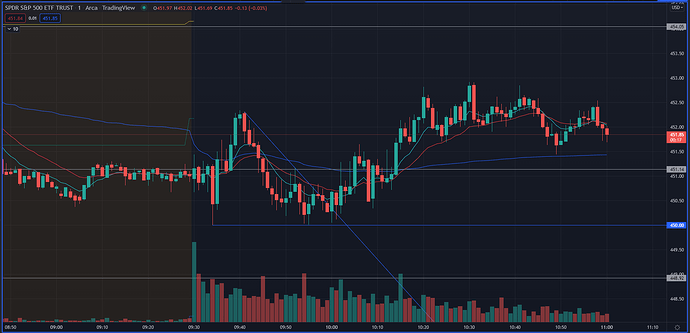
There are only 2/3 points of interest on this map, if you look at tradingview you can see a double bottom setting up on the 1 minute at the 450 level, normally I wouldn’t take a trade like this because it’s not at a daily support or resistance level. But when I saw the buy wall at 450 holding i went long with a tight stoploss underneath that liquidity.
Did the same at the 451.60 level when I saw that liquidity hold as well, it’s important to actually see a confirmation of it holding in the price action ( buyers stepping in, decrease in volume on a pullback etc) to prevent being faked out by a removal of the order or a breakthrough.

