Bookmap Discussion

I’m looking into Bookmap to gauge how useful it is for me personally and will be posting some observations and such here and welcome others to post questions and comments of their own.

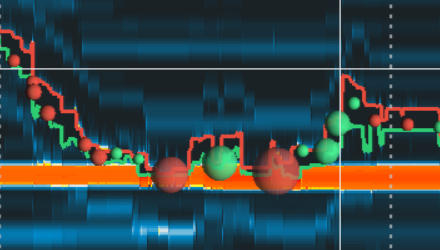
My first observation is in trying to trade SPY. The Bookmap is kinda useless tbh considering the way it trades, you basically just get this tunnel that the price action runs between:

image

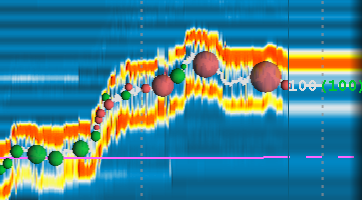
So the features of Bookman which is mainly the support and resistance heat mapping don’t really play out as expected… however if you use futures (/ES) you do get the traditional heat mapping that you’d expect (/ES is on top and SPY is on the bottom):

So if you look, the bounce points that are only briefly shown on SPY itself are shown as solid historic support on the futures. Now to answer the question; yes they move in tandem, obviously not in price moves, but in movements overall (SPY goes up when futures go up and they do so at the same time to roughly the same amount) and in most cases futures move before SPY which can be a slight edge if you have massive autism.

Will report back with more observations, I’m liking the tool thus far and think that it might actually become a staple in my trading setup.

See @brummel’s thread about Bookmap scalping here for more information: Using Bookmap to scalp SPY on a choppy day

See my thread on how to add it to TOS here if you use TD (and if you don’t and can I think its the cheapest way to get it): How to add Bookmap to ThinkOrSwim (TD Ameritrade)

5 Likes

Not my trade but from a guy on Reddit from this morning using Bookmap:

9:59am EST - NVDA - Markets started pulling and I looked for the best setup. NVDA held the breakthrough and backtest of 248 liquidity (where it rejected earlier in the day). I got short @ 247.61 with a stop above liquidity and the pullback high @ 248.30. Took profit at 1:1 then the majority into the 245 liquidity tests. Profit stopped out as the consolidation range broke to the upside.

In my opinion Bookmap is better suited for large caps, Liquidity often doesn’t get pulled on these stocks and there is (almost) no order spoofing. Still helps to give an overall picture of the level 2 on any stock though.

It also paints a better picture on the price action than the normal 1 or 5 min chart, i personally use the 5 min chart for setups and bookmap for entry’s and as a replacement of the 1 min chart. Can really see the increase in volume and buying pressure.

Normally there are better examples but let’s take BEEM as an example today.

image

You had the buy wall at 20.76 that got chipped away at by market sell orders.
The red bubble was some aggressive market selling on the bid, but not enough to break the buy wall.

On the 1 min chart it looked like this:

image

Big volume spike with absolutely no movement, Bookmap on this example gives a better picture of what is really happening in the price action.

2 Likes

Smart thing on that overlap with the futures, going to try that.

3 Likes