CPI Fortune Telling... What the market has done leading up to CPI

CPI numbers come out this Wednesday, August 10th.

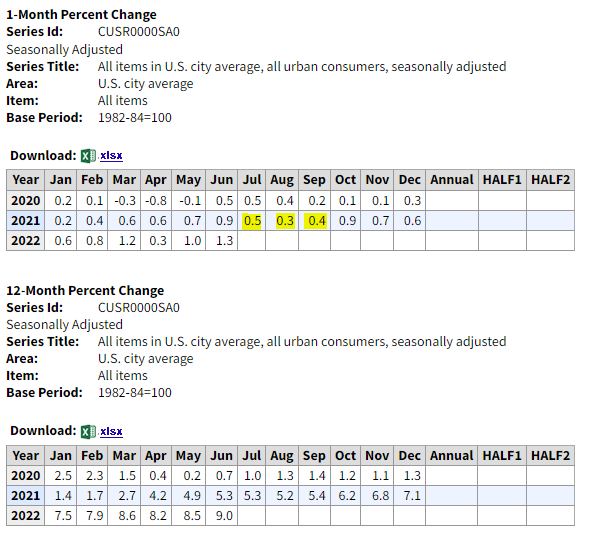
I was curious how the market reacted in the past to CPI numbers so I looked them up on the government website:

https://www.bls.gov/cpi/news.htm

Some of the previous release dates, Core / All (which are obviously for the previous month’s data), and also how the market ended that day:

July 13, 2022 - 0.7 / 1.3 / Green
June 10, 2022 - 0.6 / 1.0 / Red
May 11, 2022 - 0.6 / 0.3 / Red
April 12, 2022 - 0.3 / 1.2 / Red
March 10, 2022 - 0.5 / 0.8 / Green

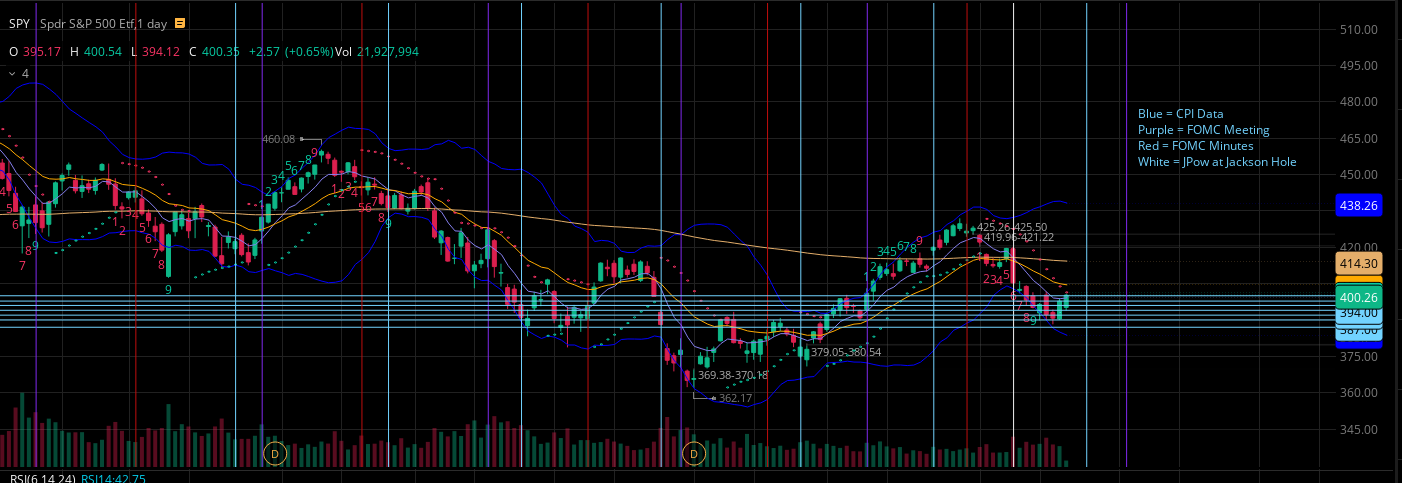
When looking at SPY on the daily, we can’t just assume CPI day will be red, or even the days after.

HOWEVER, These past 4 CPI releases, the two days before (Monday & Tuesday) have all been RED. Sometimes a little, sometimes a lot. Will history repeat itself a 5th time? Who knows… But for me it’s just one useful bit of information to keep in the back of my head that things will probably be leaning to the downside first part of this week if we are to believe algos and fears stay consistent with this sort of information in the current macro environment.

UPDATE:
The combined drop for the two days preceding CPI were as follows:

July 13, 2022 = -1.98%
June 10, 2022 = -2.97%
May 11, 2022 = -3.47%
April 12, 2022 = -2.02%

So on average we’ve seen a -2.61% drop for the combined two days before CPI. Granted it is a little skewed with the May 11th big drop likely on other news, if we exclude that then for the other 3 times we still see a -2.32% drop.

To paraphrase Ian Fleming: Once is happenstance. Twice is coincidence. Three times is actionable intelligence.

20 Likes

Thanks for the write up! Just wanted to add that I’ve noticed, at least for the last two releases, the day before CPI SPY has massively sold off in the last 2ish hours of trading. Not saying it would happen again, the market expected really bad numbers both of those times.

2 Likes

Tl;dr:

  • 0.5% monthly inflation will keep annual at same 9.0% level. Cleveland Fed forecasting 0.27%/8.82%.
  • Markets puke when inflation comes hot as size and duration of rate hikes increase
  • Which direction markets go may therefore depend on whether that monthly print is > or < 0.5%

One factor that will likely play a role in how markets react is, of course, the actual inflation print versus expectation. I can’t quite find the exact data, but I believe the print came higher than forecast every time. And so markets reacted negatively, because higher inflation means more rate hikes for longer from the Fed.

If we agree that that is an important factor, then let’s ask ourselves whether we think inflation will overshoot or undershoot forecasts. If someone can Blomberg estimates, that would be lovely. In the meantime, we have the Cleveland Fed with its very low 0.27% MoM estimate, suggesting a July YoY inflation of rate 8.82:

No doubt, reduced energy costs and possibly reduced food costs too, played a role.

Is this realistic?

Here’s the monthly and annual inflation data from the BLS:

(Source)

For July to have the same annual print as last month, we basically have to have a monthly inflation print of 0.5%. Not just that, but to stay at this 9% annual level for the next two months, Aug monthly inflation has to be 0.3%, and Sep has to be 0.4%.

Note that the last three months were 0.6%, 0.7% and 0.9%. We were going up. And services inflation is getting entrenched now. Sure, food prices may be stabilizing and energy prices adjusting downward even, but is that enough to offset the other increases to give us a monthly print of 0.5% this month, and 0.3% and 0.4% the next 2 months?

Will have to see it to believe it.

The math is thus (my calculations, take with grain of salt):

July MoM July YoY
0.0% 8.5%
0.5% 9.0%
0.9% 9.5%
1.4% 10.0%
2.3% 11.0%

Thus, anything over a monthly 0.5% inflation print is likely to markets nervous and likely give us a red day. This is 2x what Cleveland Fed is projecting :grimacing:

8 Likes

Even if food and energy comes down and brings a cooler headline CPI print, the fed has iterated that they are looking at core CPI to gauge rate hikes, not so much headline inflation. So if core comes out hot, that’s a problem for bulls.

For instance, rents hold big weight in CPI and rents have not cooled down, to my understanding.

All eyes on Wednesday.

Wonder if Bowman today is trying to prep the market for a hot CPI in advance
https://twitter.com/deitaone/status/1555951594742714368?s=21&t=ehIBjUBsI60W3GrZ61OsVQ

6 Likes

I don’t have a Bloomberg Terminal, but here are the numbers from Marketwatch & Trading Economics.

CPI1

As for energy & food costs… A few factors to consider…

  1. We are coming off of the summer peak travel season, so gas prices naturally drop around this time of year.

  2. SPR release is going to stop I think end of October?

  3. Hurricane season is getting warmed up with the peak around end of august / beginning of september, any major storms could cause problems.

  4. The LNG export terminal is expected to be back in operating in October (previously November), and when they start exporting again the price for NG will go up since Europe will gladly pay more for it.

  5. Row crops right now are in a crucial growth stage and much of the country is in a drought. From what I’ve been following the “high end” of yield expectations are already off the table (and that was already reduced from the late planting of much of the country). Now it’s a waiting game to see if they get any rain soon. As farmers harvest crops this fall we will get a better gauge on what food prices are going to be for the next year.

11 Likes

You are right, everytime we have had a hot headline print Powell has reiterated that they primarily look at core when making rate descisions. I’ll add that this could put them in a unusual spot if core doesn’t cool as he announced in his last press conference that they believe they are currently at neutral. I would assume that would be rather difficult to walk back in such a short time period.

We know the bond market has been moody as hell as the 2/10’s are currently extremely inverted and have been for some time.

Wednesday should shed some light on if it is justified. Rate expectations post numbers release should give us some good guidance on what to expect from equities moving forward but we are still a ways out from our next FOMC meeting so any movement should be taken cautiously imo.

I’m going to grab some Aug 19th lottos on IWM for any surprises to the downside, they are cheap right now and technicals look pretty good as we are testing a pretty significant resistance on the daily. Outside of that ill be scalping whatever trend forms after the numbers drop.

9 Likes

Watch what the White House says. They always get out in front of hot CPI numbers.

8 Likes

Do we feel as though there’s a possibility that the “expectation” will come in low so even though CPI will come in hot it will beat and we’ll rally no matter what? This goes along with all of the fed jaw boning that’s been happening lately and just something to think about

4 Likes

Man I love Valhalla!!! I was just thinking about this potential factor and you guys have it broken down already.

I was imagining the scenario where Hot Inflation numbers are announced and we get our usual (right now) “drunk market” reaction of going up, but then the Fed calling an emergency meeting to initiate an emergency rate hike and then the market reacting like it should (down).

I’m not sure what to think at this point but I’ll definitely be watching the market Wednesday with you guys.

2 Likes

Hi y’all… I’m still in bear mode at the core, but did decently on the current run. Started mentioning on TF the volume on SPY leading up to CPI and FOMC was big.

Here is Junes lead up to CPI on June 10 and FOMC on June 14-15

Looking at the upcoming dates there is significant volume and OI on the Aug 12 and even more on August 19 see below. As you see leaning more out heavy


I have been collecting UVXY calls in anticipation of CPI and future Fed macro shizzle as time goes. Holding a few SPY Aug 19 puts. But also holding general calls on a few tickers we have collectively discussed here so playing the trend but I feel there is some downward pressure coming so be cautious on either or both sides you play. Manage the risk and can’t hurt to hold cash.

Cheers

6 Likes

The interesting thing about SPY on the daily, 3 out of 4 times SPY actually was green the day AFTER CPI came out. The one red time we were in a big freefall already on I don’t remember what other news.

So even if the market freaks with with CPI, we are likely to see some rebound on Thursday. Past that is anyone’s guess.

5 Likes

First what a great thread and info. Best case scenario is CPI comes in lower than expected coupled with jobs coming in hot. This would to me signal the old proverbial soft landing.

However I doubt that is the case. From the ground floor of retail automotive I can say supply has increased ever so slightly. Demand has yet to cease. Which is likely bad for inflation in general. Will take a lot longer for supply to catch up than overall demand destruction. But I’d think we would channel for few days leading up to CPI.

4 Likes

18 previous CPI prints, 12 have come in hotter and 6 have been right on expectation. Not a single one has come in lower than expectation, pretty interesting stuff

7 Likes

This topic was automatically closed 14 days after the last reply. New replies are no longer allowed.

As of the last CPI report the thesis continues to hold true that most of the two trading days preceding the CPI report are generally RED. Thus if the theory continues to hold we should see Friday & Monday as red days…

I would recommend this as more of something to just keep in the back of your mind, not something to YOLO a position on.

5 Likes

I was thinking about the correlation between commodities and CPI and the possibility of front-running the report based on the current values and trends of commodities. I believe macroeconomic-based hedge funds include the current prices of commodities as a forecast for future conditions and their effects on the markets.

Look how similar the percentage change in CPI and the price for commodities are in the charts below.

I know it doesn’t include all the categories that the report has, but they both had a big spike in March, seemed to have peaked in June, followed by declines in July. These commodities have continued to trend down in the month of August, leading me to believe that we could get another deceleration of inflation.

I think cross referencing with other sources of consumer spending could help solidify this theory.

Let me know what you guys think.

6 Likes

This is a rather important CPI print because we’re all expecting it to confirm that we are past peak inflation. Consensus seems to be that the annual rate will go down to 8.1% for August, from 8.5% in July and 9% in June.

Because inflation picked up so quickly over the last year and change, it means the YoY number that folks focus on is also very susceptible to small changes in the MoM. Downloaded the BLS data and ran these numbers on where we might end up for 0.0%. 0.1%, 0.3% and 0.5% sustained rates. (Of course, the % in months will vary, but this gives us a sense of the general trajectory.)

image

As we can see, the Jun 2023 numbers vary quite a bit, between annual rates of 0.0% and 5.6%. We’d love 0%, and we’d be very unhappy with 5.6%.

To the extent that the Fed really wants to get rates at least as high as inflation and that is what markets are pricing in (below), a “terminal rate” of ~4% in Jun 2023 then implies that we’ll, on average, have a monthly inflation of about 0.3%. And that the end-of-year rate will be about 7%.

image

Though not impossible, it does seem to be a bit of wishful thinking though to expect inflation to come down without the Fed actually raising rates to actively meet inflation rates. Also, core/sticky inflation is creeping up even though headline is flat. Aug inflation numbers will be helpful to see if expecting for inflation to meet them half way is indeed wishful thinking on the part of the Fed.

9 Likes

This is the Bloomberg economists’ survey scorecard going into tomorrow. 8.06% average, 8.1% median.

7 Likes

Well, the two days before CPI (9/9 & 9/12) did not follow the previous trend… Myth Busted!

4 Likes