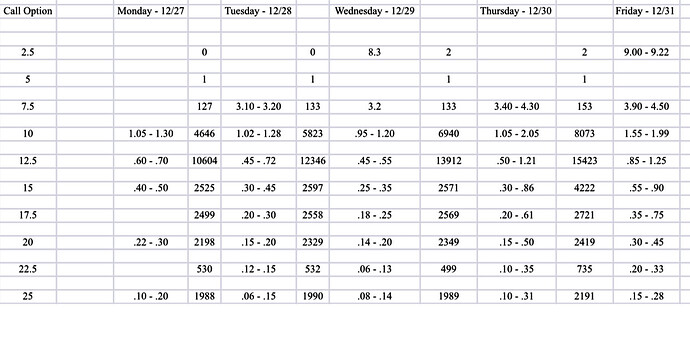
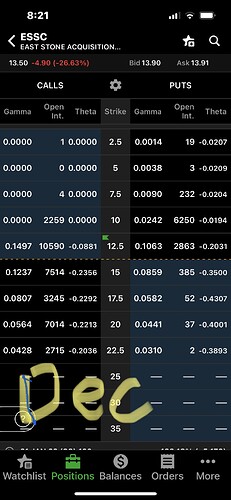
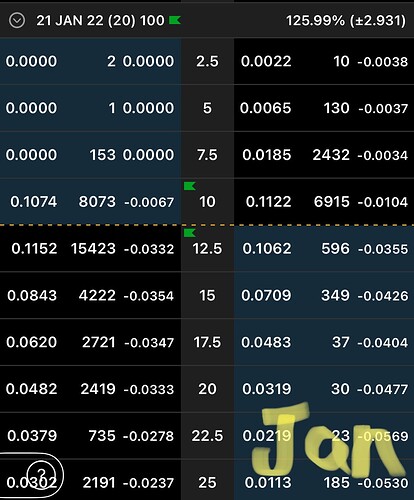
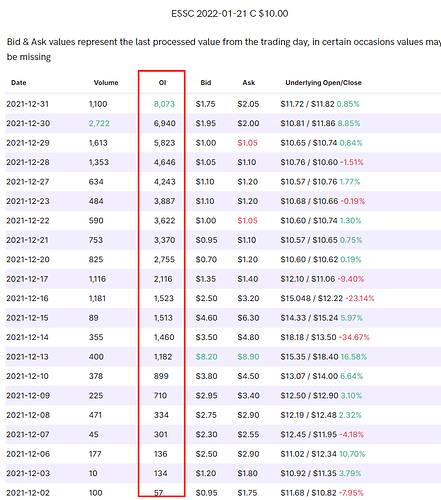
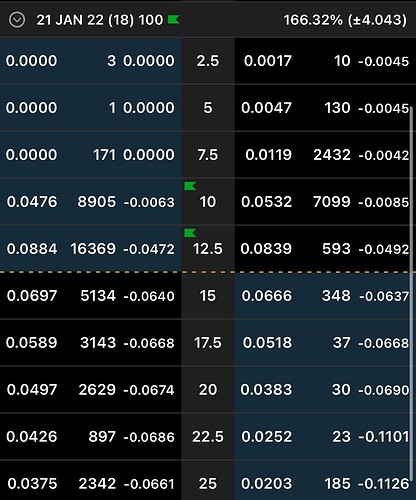
What you’re saying is actually something that I’d incorporate in thinking about it. You’re thinking on one dimension of the transaction, being the point of transaction. But that would have different attributes to it, like how long ago was the order set as an easy example. I’m thinking about grouping attributes together like order type, size, price. If there is a fill, compare the grouped together attributes (probably lot more than just what I mentioned) to any cancelled order with the same attributes in a prior timeframe (size of the timeframe dependant on the price action of the underlying) if there is a match, you have a good idea that it was an algo making that.
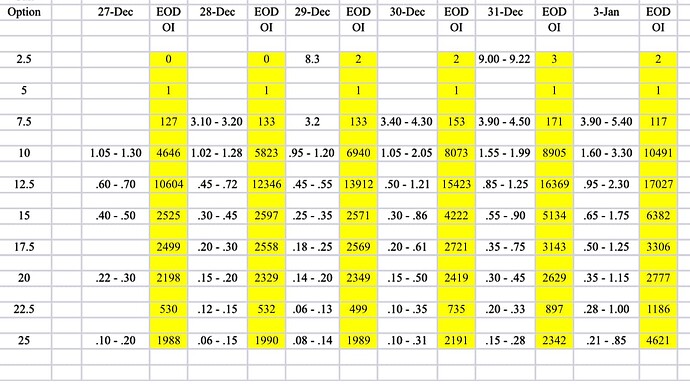
Now you can make conclusions from this, but likely still just guesses. You know that one side was an algo, then you can flag it as potentially a decrease in OI, since it COULD be a MM buying it back. Now add into this the price of transaction compared to bid/ask and you have a better idea if it was an increase in OI:
- one side is an algo based on the flag and the price was on the ask side, likely an increase in OI since the algo would not buy on the ask, therefore the algo sold.
- transaction is not flagged as algo on either side, likely not affecting OI, it could be just retail buying from retail
Now of course now we are talking about using different data sources at this point, like order book, transaction details. The logic above is just me thinking while typing, it would be probably be a lot more complex (maybe impossible, yes) and a fair bit of work. And again, I don’t know if this kind of granularity is accessible at all. But this is definitely the type of thing that keep me working on it until i figure out a reasonable correlation.
Perfect would be likely impossible, but having a data driven idea intraday that OI is building or falling could possibly help the community enter a play by just one day, which could mean comfortably sitting on profit instead of catching up, and also see a play is over before close, not waiting to see if tomorrow is still good. Meaning that even a backtested signal of the direction of the OI and a moderately accurate prediction of the extent of the change in real time could be priceless.
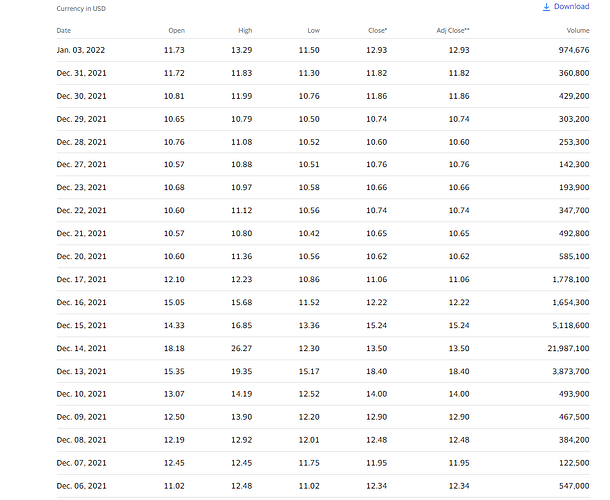
Going in a different direction: looking at past charts for gamma squeezes, we have at least some idea of when hedging took place. Now you could crosscheck that with options transactions/orders to see if they were purchasing back options as well while hedging shares, or just shares.
Might be helpful, might not be, but definitely paints a part of the picture that previously was only imagined.
Don’t take any of the above as fleshed out ideas, these are just thoughts while typing. I see errors in them myself as well, but it gives an idea of the things you could do.
