What is the next peak that Fibonacci might see?
4 Likes
TF was having a discussion regarding false claims outside of Valhalla on the subject of liquidity…
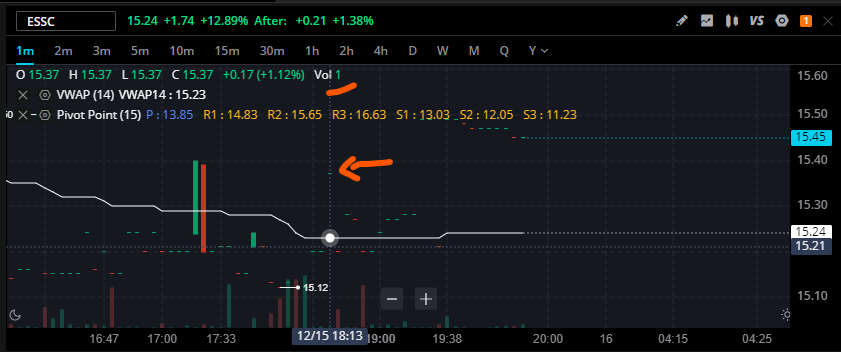
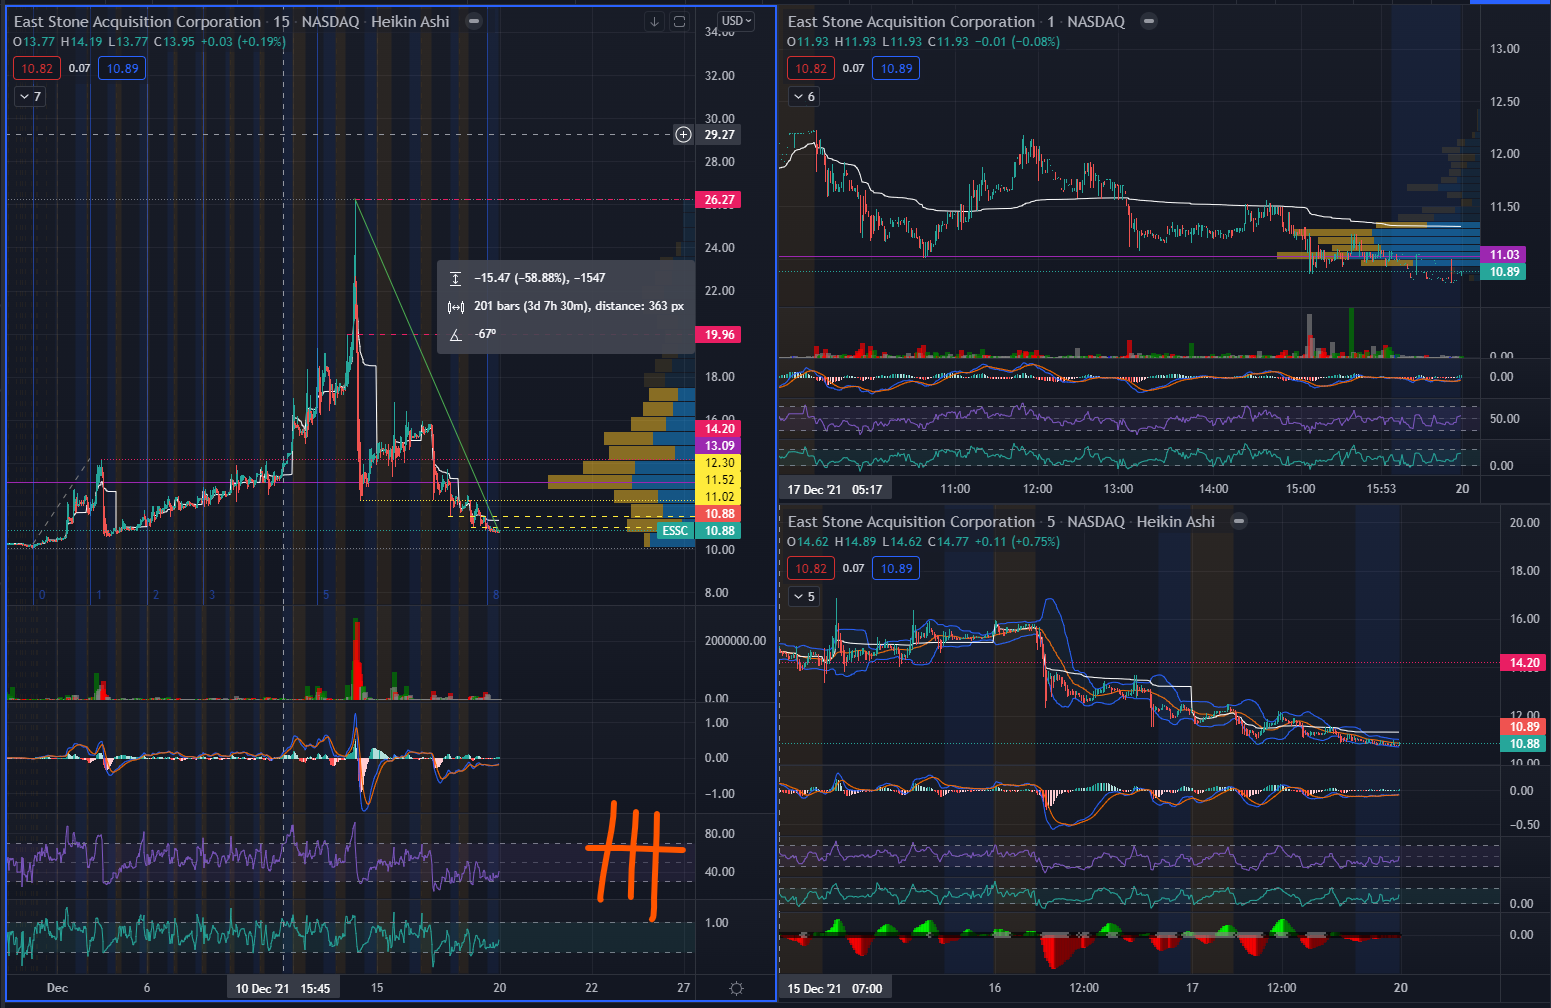
- As you can see in the 1min chart AH, a single share purchase moved the price +1.11842.
- If the micro-float wasn’t real, there’s no way it would jump like that.
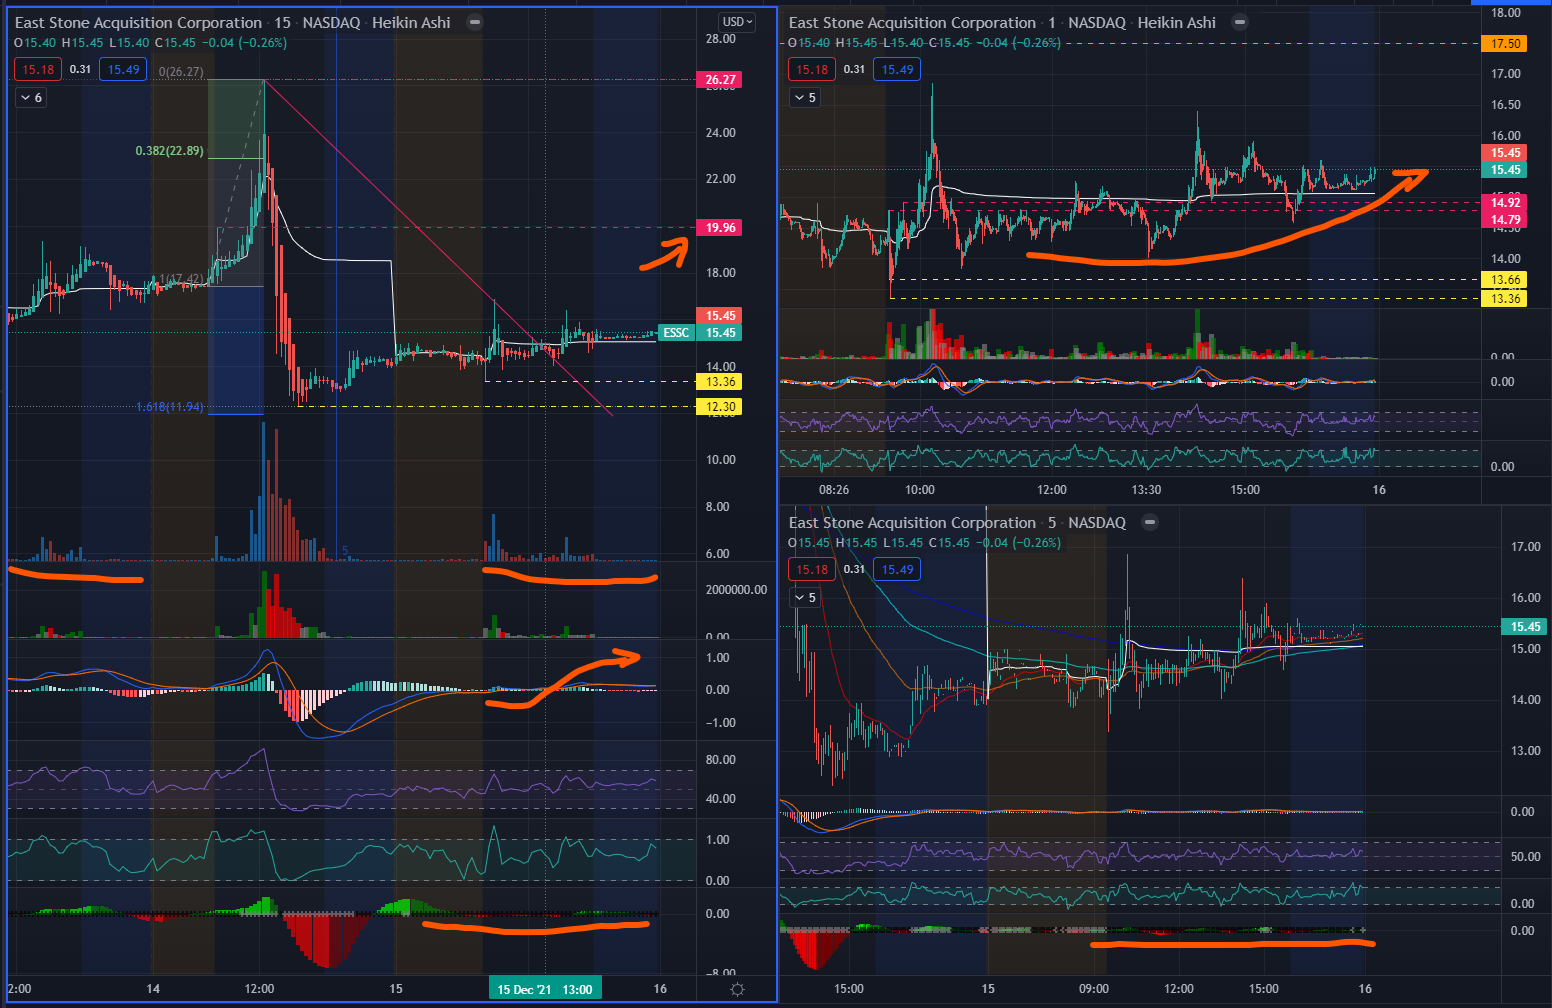
15min and 5min squeeze charts…
- All day long was just the price squeezing/compressing around VWAP.
- Though we saw some spikes, there really wasn’t a notable are of pressure relief.
- 15min chart was on the mark with the wedge breakout and bounce from 1pm to 1:30pm.
- MACD and Signal lines have both crossed over to the upper bands of the histogram, this confirms upward momentum.
- Volume was comparable to Monday, Dec 13th.
- The price line to break is 19.96, which will signal Squeeze relief momentum–sell side would have given up.
- 5min chart echoes the same non-story regarding price squeeze action, despite a few spikes up and down.
- 1min chart confirms ESSC has flown out of the channel trap that was established in the first 30min after open.
- 17.50 strike isn’t too far out now, do expect a good fight before and around this price line.
*Today confirmed my bias as just a good loading area. Possibly the last.
Regarding PT…
Any price higher than Tuesday’s 26.27 will throw you off your game.
You don’t really want to hear anyone influence you at this point.
Best you can do for your accounts is to discipline yourself according to your risk management and exit strategy.
I now only prefer the Fib for price retracement, and in this case, it actually maxed out for best entry.
- IF you’re playing Options, use Optionstrat.com or Optionsprofitcalculator.com
- IF you’re playing shares, decide on a percentage gain and stick to those levels.
*The more you talk about higher PTs in Trading Floor, the more you will confuse yourself and others.
Regarding Sentiment…
Tuesday’s dump has created the perfect shakeout.
Those who know the play jumped back in or averaged down at the 12.30-13.30 channel.
Those who are dismissive or doubtful, but tracking momentum runners will be hit with FOMO the hardest–if and when ESSC runs past 17.50 and 19.96.
This will create a chain reaction and will get more retail chasing the stock price above 17.50.
IF I were in this play, I’d trade my highest contracts first, then my shares last.
IF I were in this play, I’d re-read all the inputs by Conqueror and the others who are the gods of calculating the float with/against the Options chain.
30 Likes
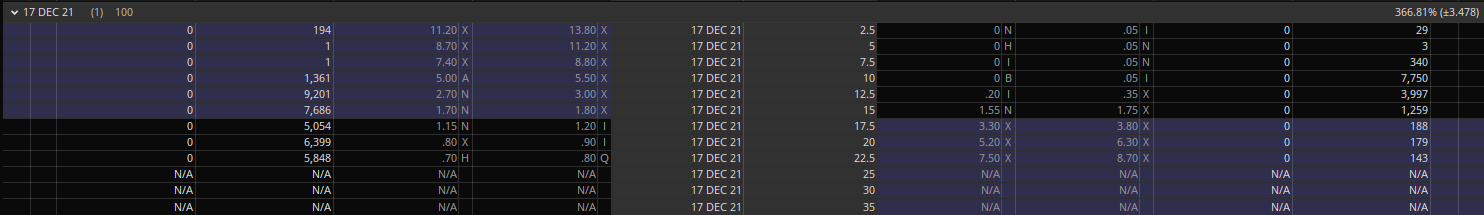
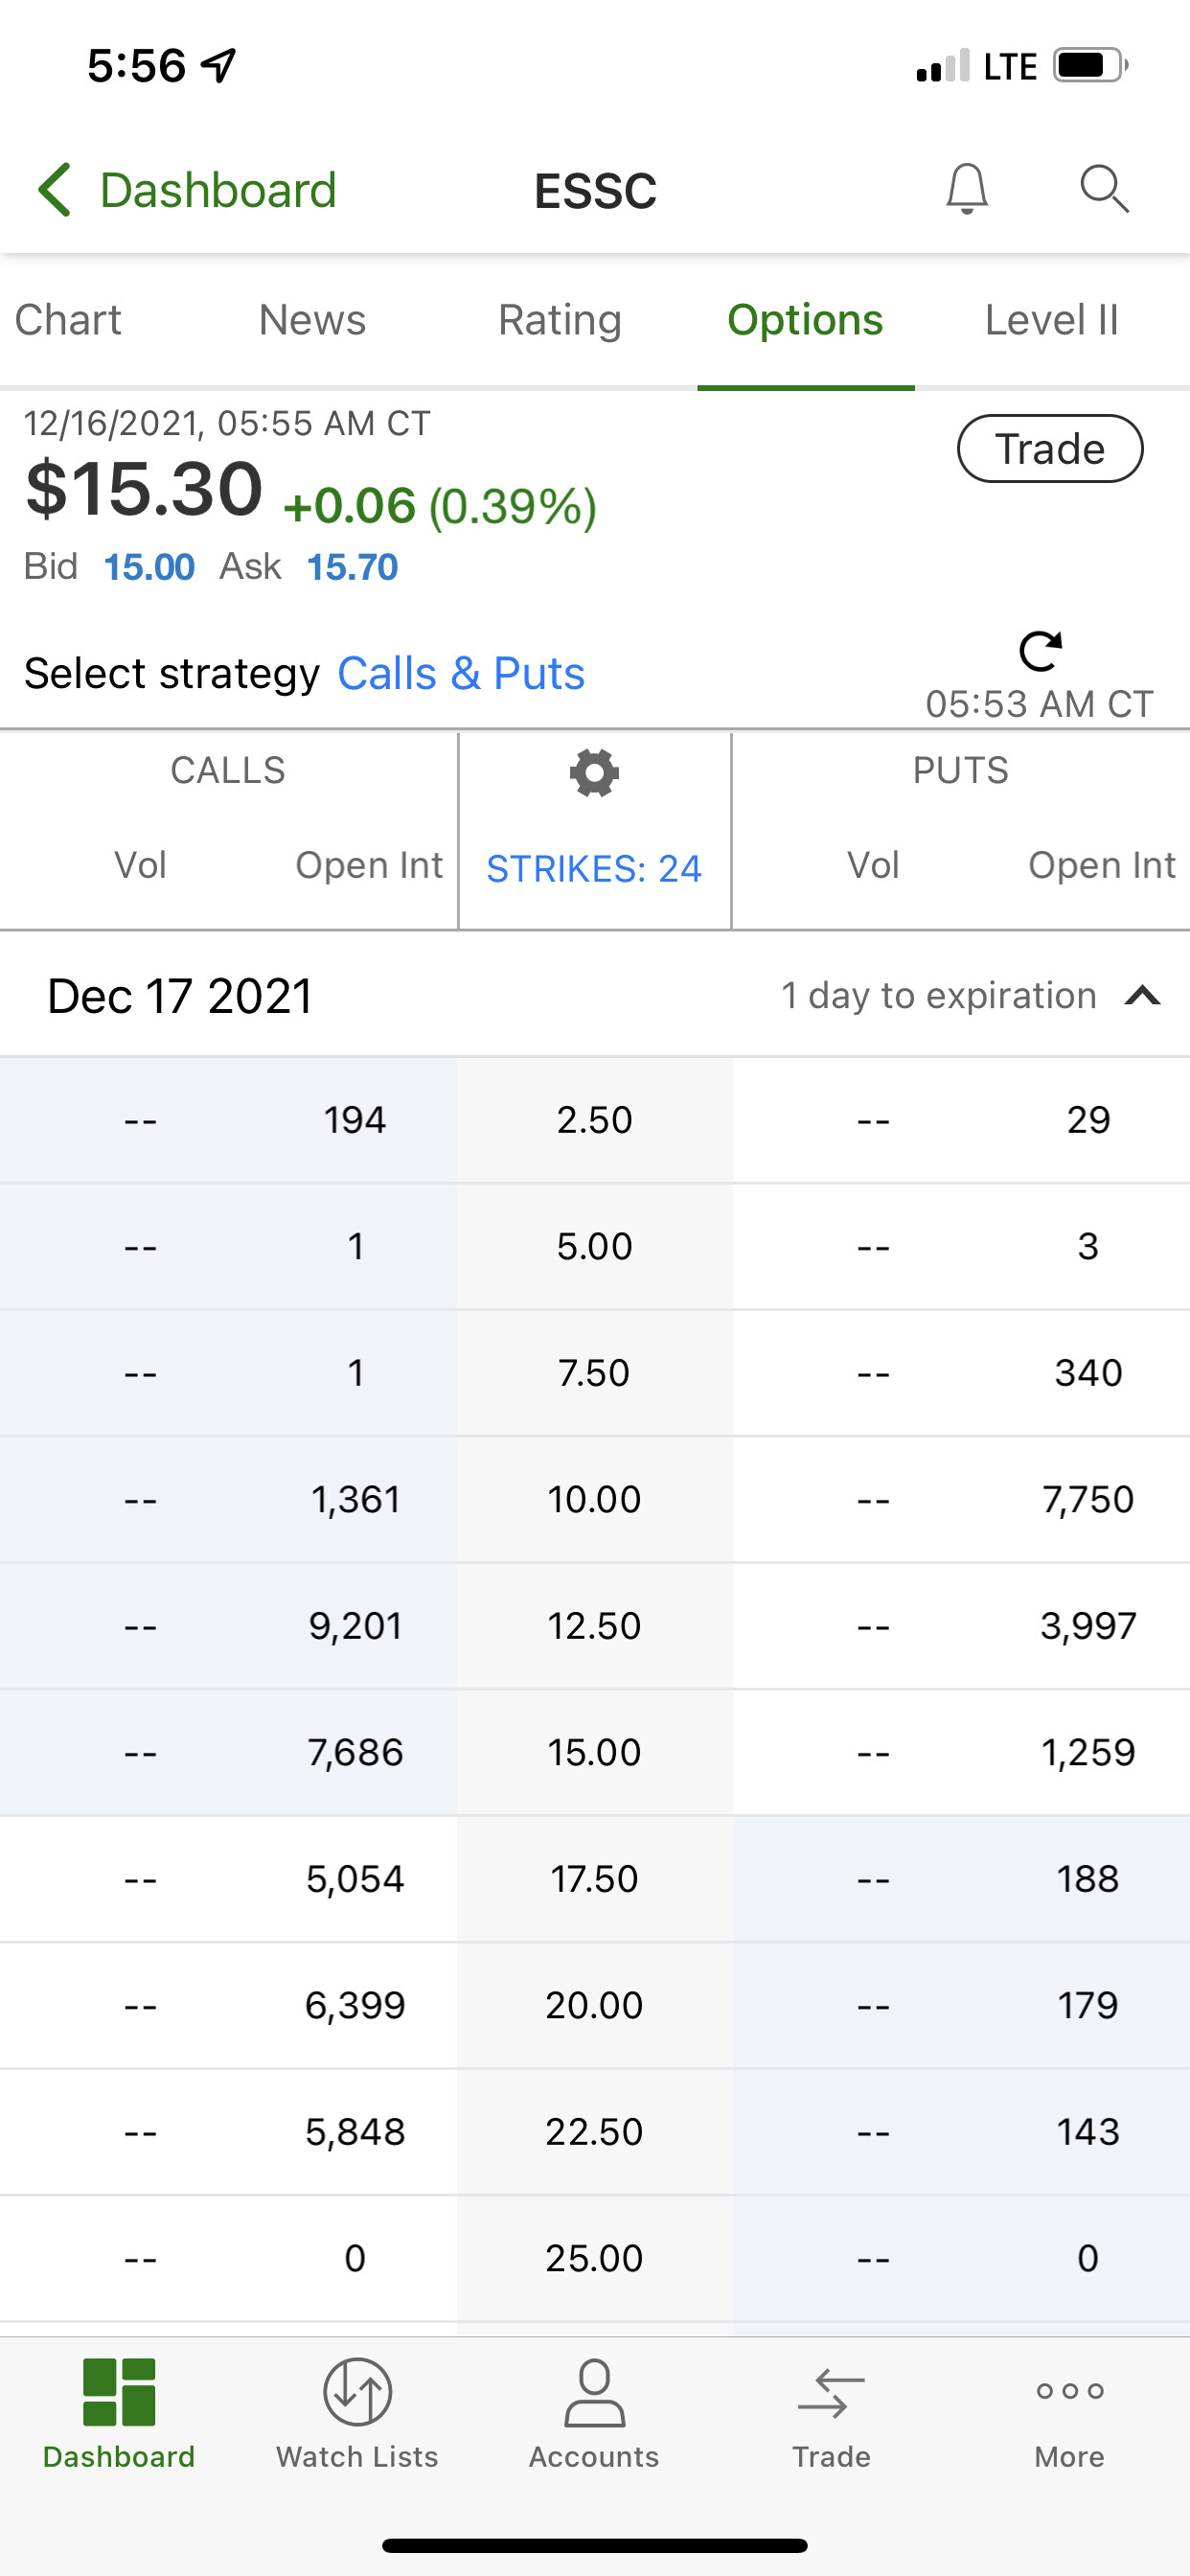
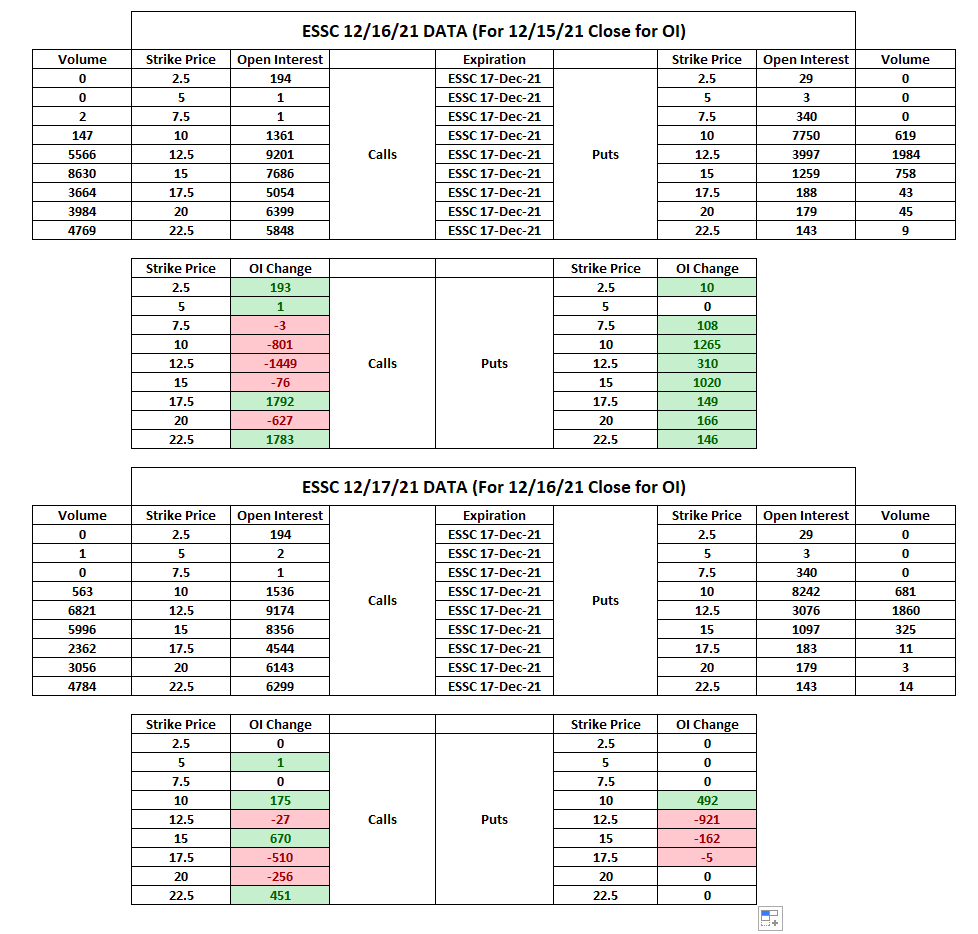
TD Option Chain for 12/17 because lots have been asking this morning. No further extension as of yet….
5 Likes
I’m copying a post that was made in the wrong place here last night.
Hey, Finally figured out the account access issue. Been playing around with this for fun, figured I would post it. What follows is just theory crafting, not to be considered serious or advice:
The Most Dangerous Game (for Sea Otter)
So I noticed Sea Otter filed that 13G… Which seemed like a bad move from a game theory perspective to me. I decided to do some math to figure out the best way to exploit bad moves of other players in the “game”.
So according to the filings I have read, ESSC requires $5,000,001 in their trust account by February otherwise the business combination will fail : this equates to 480,769 (nice) shares.
Currently there is a maximum of 341k (previous float) + 850k (from Sea Otter 13G) + 2,073,974 (other Arb Funds shares) = 3,264,974 shares that exist (1.191M of which could now likely be considered tradeable at this moment).
Suppose you wanted to force the business combination to fail, what would it take?
You would need to acquire 2,784,205 shares in total and then redeem them to force this outcome. You could theoretically acquire 1,191,000 tradable shares which would leave you requiring 1.6M. Potentially, these same arb funds may have already locked in their 400k “founder shares” which they are supposed to get after the combination closes, by shorting them. That would take it down to 1.2M which is perilously close to the amount of tradable shares if they were shorted 1x… This doesn’t even take into account other ways of getting shares through exercising options or MM liquidity shenanigans.
Ok, so lets say you wanted to do this, how much would it cost?
The formula is pretty simple: (AVG SHARE PRICE - 10.40) * 2,784,205.
So if somehow you were able to acquire the required shares at an average of $12 it would cost you $4.45M to cause the merger to fail. This is after you got your money back from the redemptions.
Ok, so how would you profit?
This is the easy part, now that you are assured the merger will fail 100%, you sell ALL of the long dated contracts on ESSC at stupidly high vol. ALL OF THEM – After February. For instance, you could likely make all of your capital outlay back just one series of the March chain… But of course, you would be selling literally all of them.
Closing:
This was pretty fun to think about, I think the possibility of this strategy might actually increase the floor substantially from $10.40 from here till Feb. I will definitely be keeping an eye on those far dated contracts…
6 Likes
My attempt at transcribing Conq in VC. Tried my best but it was pretty technical so please feel free to edit/correct: this play is highly unusual and what we know of gamma squeezes are they require chain extensions: it’s been the play of AMC, GME. MM’s filed for a chain extension but didn’t get it which seems to be the options might be delisted. Conq doesn’t know what the mechanics are for this but it’s trading on options exchanges but not trading. So either these options are going to be delisted after next week (5-day period) or wires were crossed and it is not executin…in any event it’s bullish. If we have all these buy stacks on these options there’s no way to swap out. They have to run it with ITM options move regardless. They would have to see people sell off ITM options for profit and then the IV crush assimilate those OTM options as they become worthless as it comes down. So you still get a run and you get a run with a lot of potential and the game is when does the OI come off? All of this is super-conspiracy and tinfoil hat in that we’ve never seen a situation where the chain hasn’t been approved/extended. And they’re still selling strikes. It’s odd and Conq doesn’t see a way for the MM getting out of it. MM, as sophisticated as they are, and they always win, they may have to lose to win here (let the share price run up). You have to remember that 3M volume, there is only so much the MM can grab of that volume. This type of buying really inflates the stock. This situation is weird and gots a lot of potential but we’ll just have to wait and see. There’s no reason it’s not bullish from what Conq sees.
2 Likes
My counterpoint for the lack of options chain extension being bullish in all cases:
I, as a MM keep selling options as usual here, as per my standard process. I see the price reacted drastically, and now all my sold call options are in the red, barely any put sales, so I am net negative. No worries, I’ll get a chain extension, and make a killing off of retail fomo into FDs as per my standard process. Great.
What? Chain extension is not possible? Maybe time to re-evaluate. I see the price is also dropped enough where I am now potentially net positive on my sold options.
My choices here disregarding the size of the float, but realizing what previous volume caused to the price of the underlying:
-
Start buying now to fully hedge my current position, pushing the price to the point I need to hedge more because more calls are now ITM.
Now I reached the highest strike again, the stock gained retail momentum, and I can’t sell new calls that are going to expire worthless, so I am not going to come out net positive on this specific expiration.
-Proof of concept is in retails mind now, next expiration repeat above. -
Keep the price lingering around/above $12.5, needing to purchase stock for exercised calls where not hedged properly so far. While 12.5 and 10 has a large enough OI for my purchases to move the price significantly, the closer I get to expiration/even after expiration, the more I gain on theta on OTM calls, maybe buy to close some options to lock in profits. 15 and up strikes expire worthless. Now let’s assume I didn’t hedge a single share and I did not buy to close any ITM options, they are excersized (not saying this happens). I now need to purchase over a million shares on the market to deliver within the next days. I buy the shares, as expected the price goes to 25 again. Retail again starts buying january calls, with the jump IV prices the options higher. I finish delivering shares.
Delta on my newly written calls are low since the expiration is far off, as per process I won’t hedge yet majorly. Low float stock, without my volume, eventually the price drops, I am green as hell on my short options.
-Proof of concept for low float still happens, repeat in january.
Now if i look at these options (most likely not a black and white choice, mixture of the 2, multiple MMs deciding differently->game theory also comes in, Institutions trying to push up price come in, which in my opinion is the reason for a more likely option 1) the second one is more beneficial to me financially.
Just a thought, obviously i can’t know all their choices, processes, or anything at all really. But saying it can only be bullish to not have an extension is in my opinion overly confident.
I am also holding calls for tomorrow, and I do expect a move, but I’d rather have a counter-argument on the table too.
Let me know your thoughts
2 Likes
I only worry that part of the movement up on Tuesday was the MMS hedging the 12.5cs. If that’s the case, we need more sentiment to drive price up to get the 15c ITM.
5 Likes
We gotta remember that the movement on Tuesday was also right after we had it was trending on Reddit and also making an appearance on Apple News, all happening a couple moments before the movement started. I’d assume it was mostly retail (emphasis on “mostly”).
Of course, this is just my gut feeling, not based on any facts.
That being said, I would love to see another strike going ITM and also more people piling onto shares + ITM strikes to propel this. (Not giving financial advice in any way, shape or form!)
4 Likes
Bullish flow today was only 39.37%. However, nearly all flow from Floor Traders were bullish. Kinda weird, imo. But maybe it’s a nothingburger since the premiums for these trades are quite small. They were mostly 12/17 options for the first half of the day, then started becoming mostly Januarys.
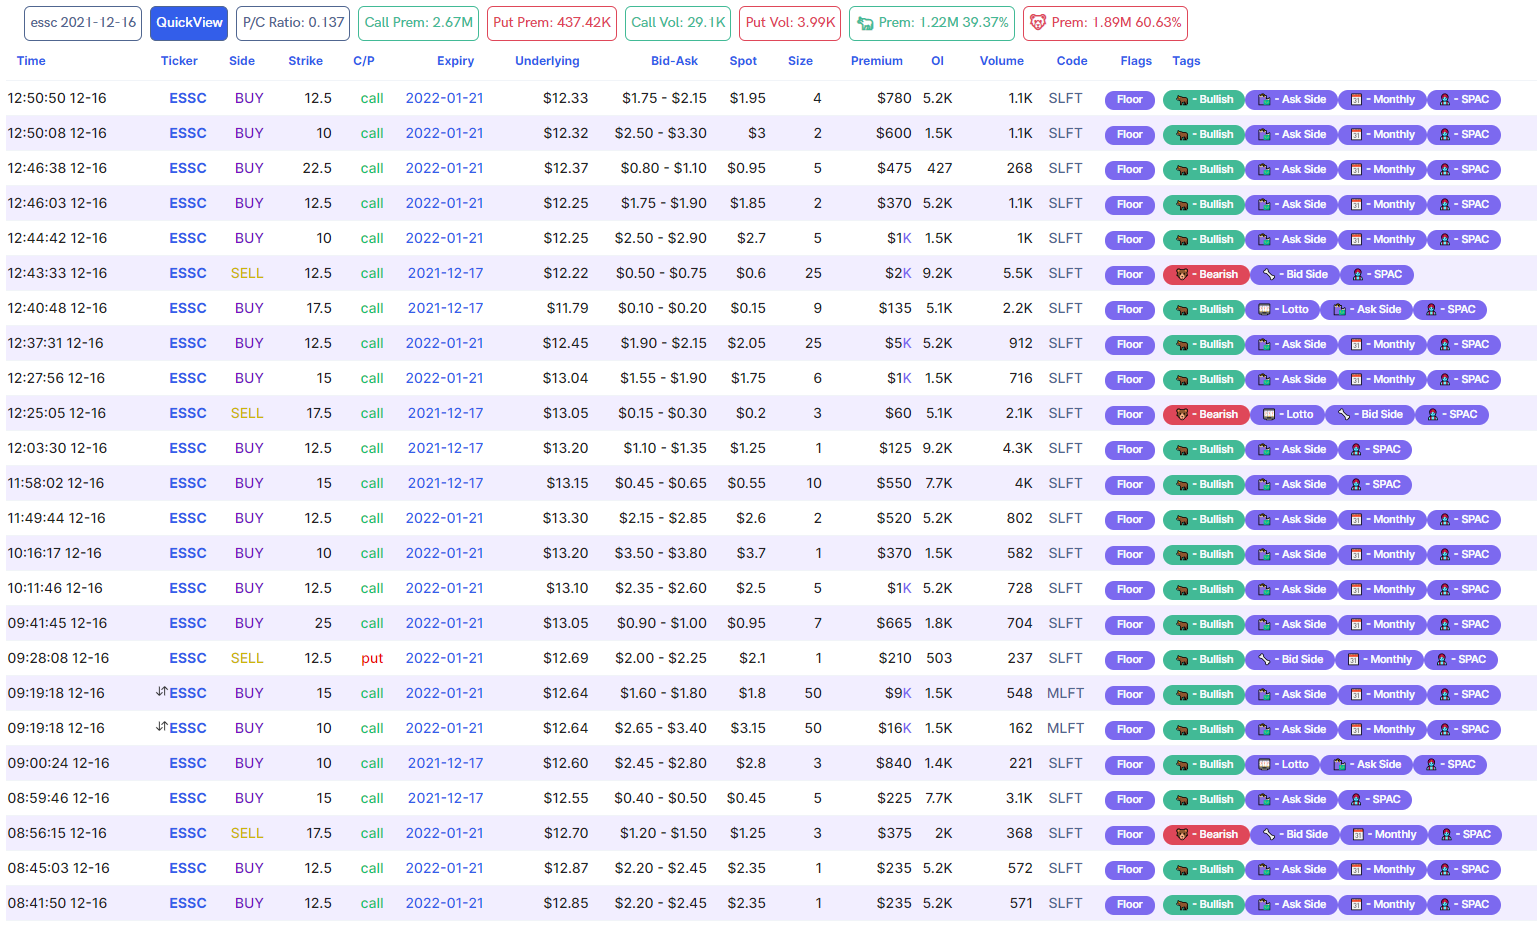
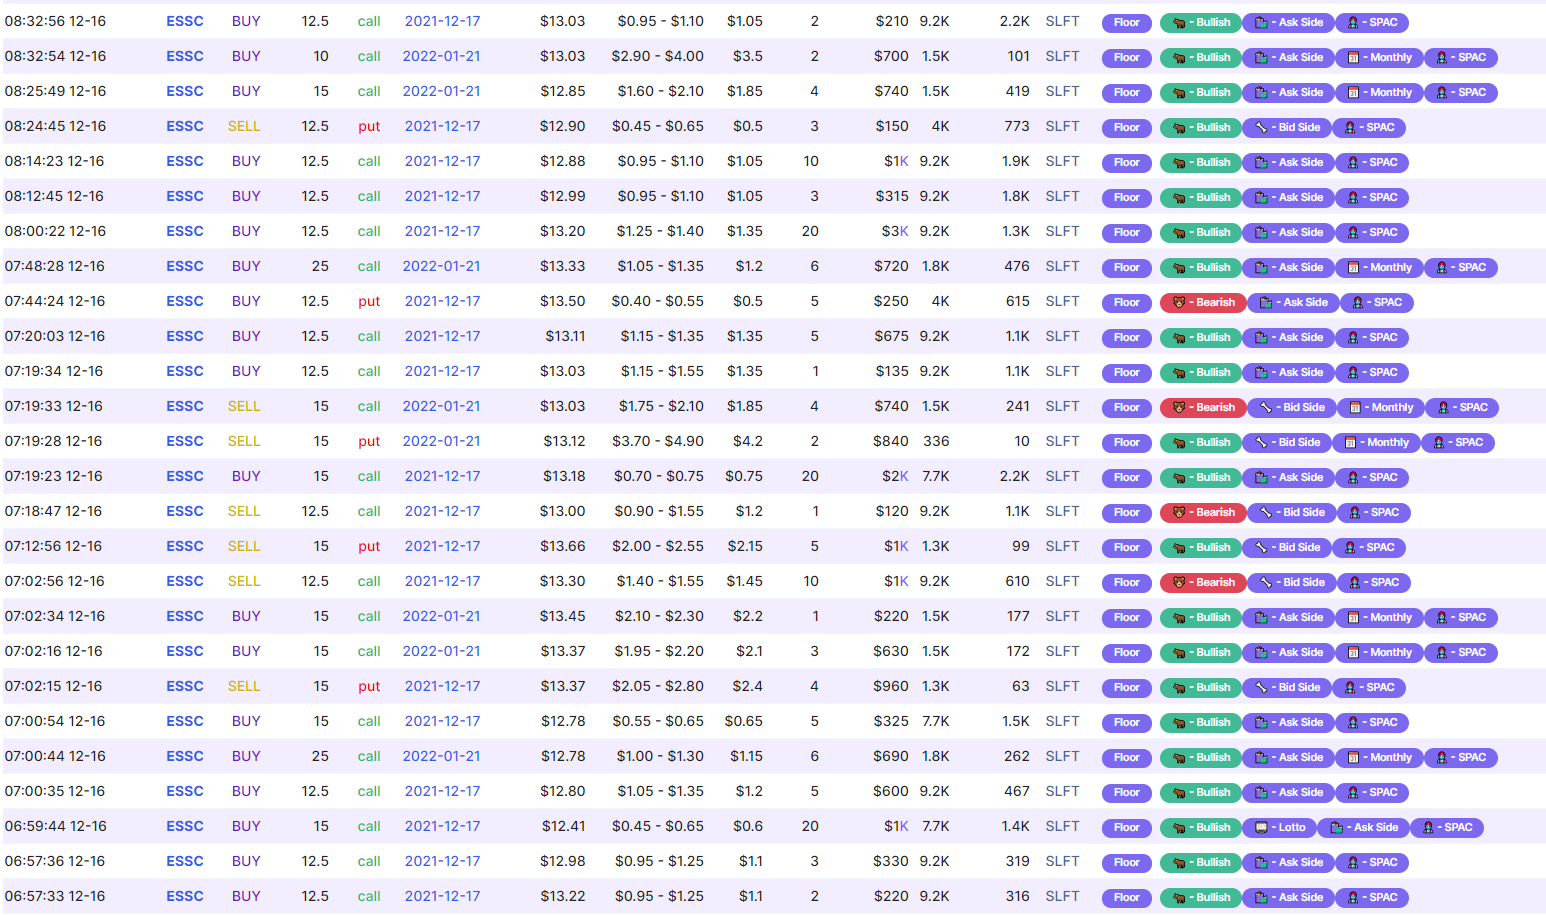
FYI:
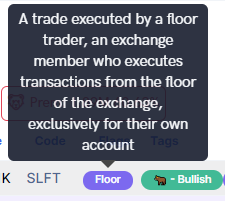
This is a Floor tag:
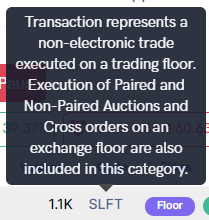
This is SLFT:
5 Likes
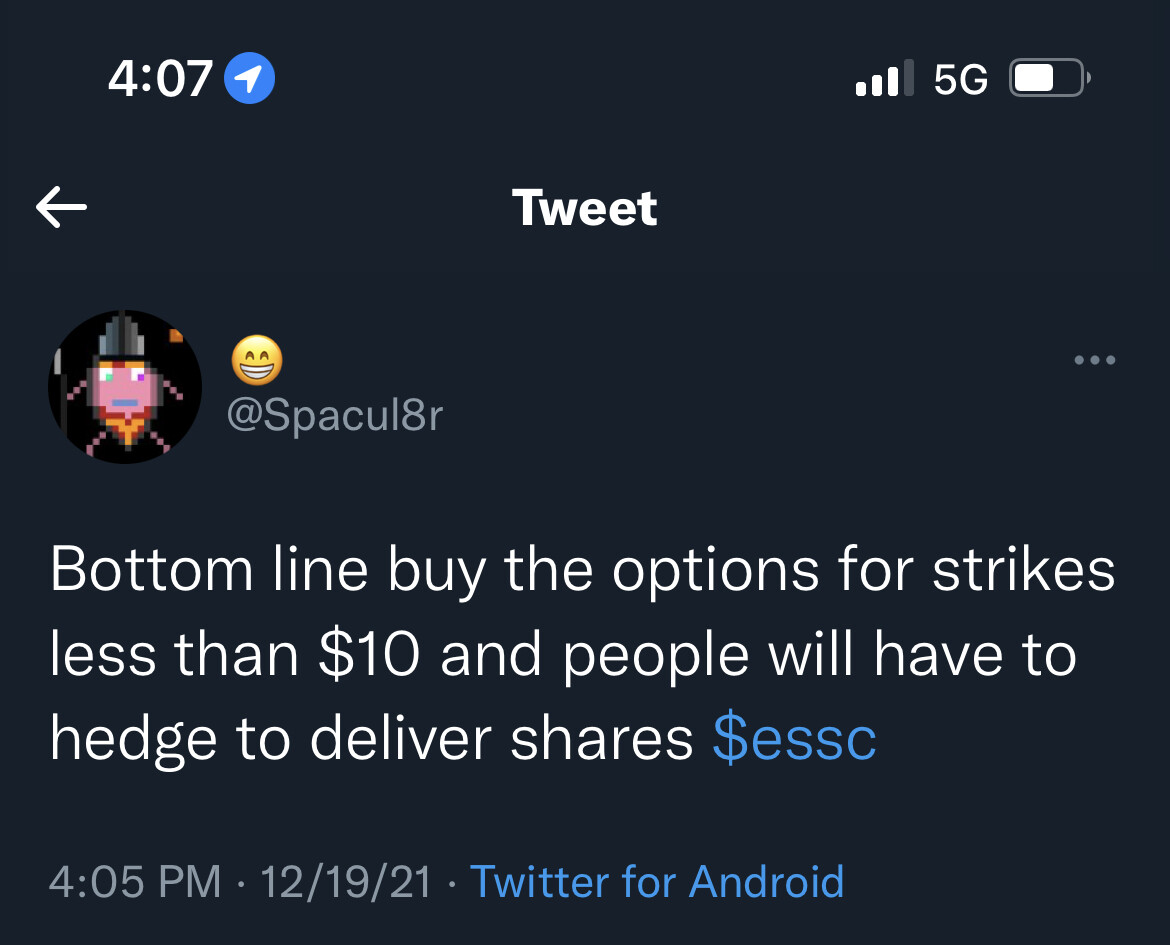
Anyone seen this?
3 Likes
Update to my tracking…
ESSC peaked over +120% since Conqueror created this thread–a few days after kevin chen and magician brought the original reddit DD to attention to some of us.
It then dropped -53% intraday–an hour or less from that ATH of 26.27–them jumped back up 29-36% the following day.
The week closed it at the price of $10.89, Friday 8pm–very close to the $10 price where the initial rally started.
- On the 15min chart extended to Nov 18, wee that Volume peaked at 11.52, this is where most traded or loaded up.
- Volume was still good at around 17, which is the same price line I didn’t recommend chasing anymore.
- RSI closed at 28.47, I’d like to see the 15min chart above 35 again with good volume, before another upward momentum is confirmed.
- BB%b shows this is probably a great buying opportunity if you think a 3rd run is possible, should sentiment ramp back up.
- Fib Time Zone has good enough room for the remaining days of December, and it marked the 15th as a possible good low enough entry day before another bullish run.
- The 1min chart on Friday 17th, shows volume peaking at 11.03 and maintained well at 11.26.
- Notice the divergence between the rising RSI and the lowering price, this means a change in momentum.
- MACD confirms what we see in the RSI, looking at the green bars of the histogram and the rising lines.
- The 5min chart echoes the price-strength divergence, with tight price action on the Bollinger Bands.
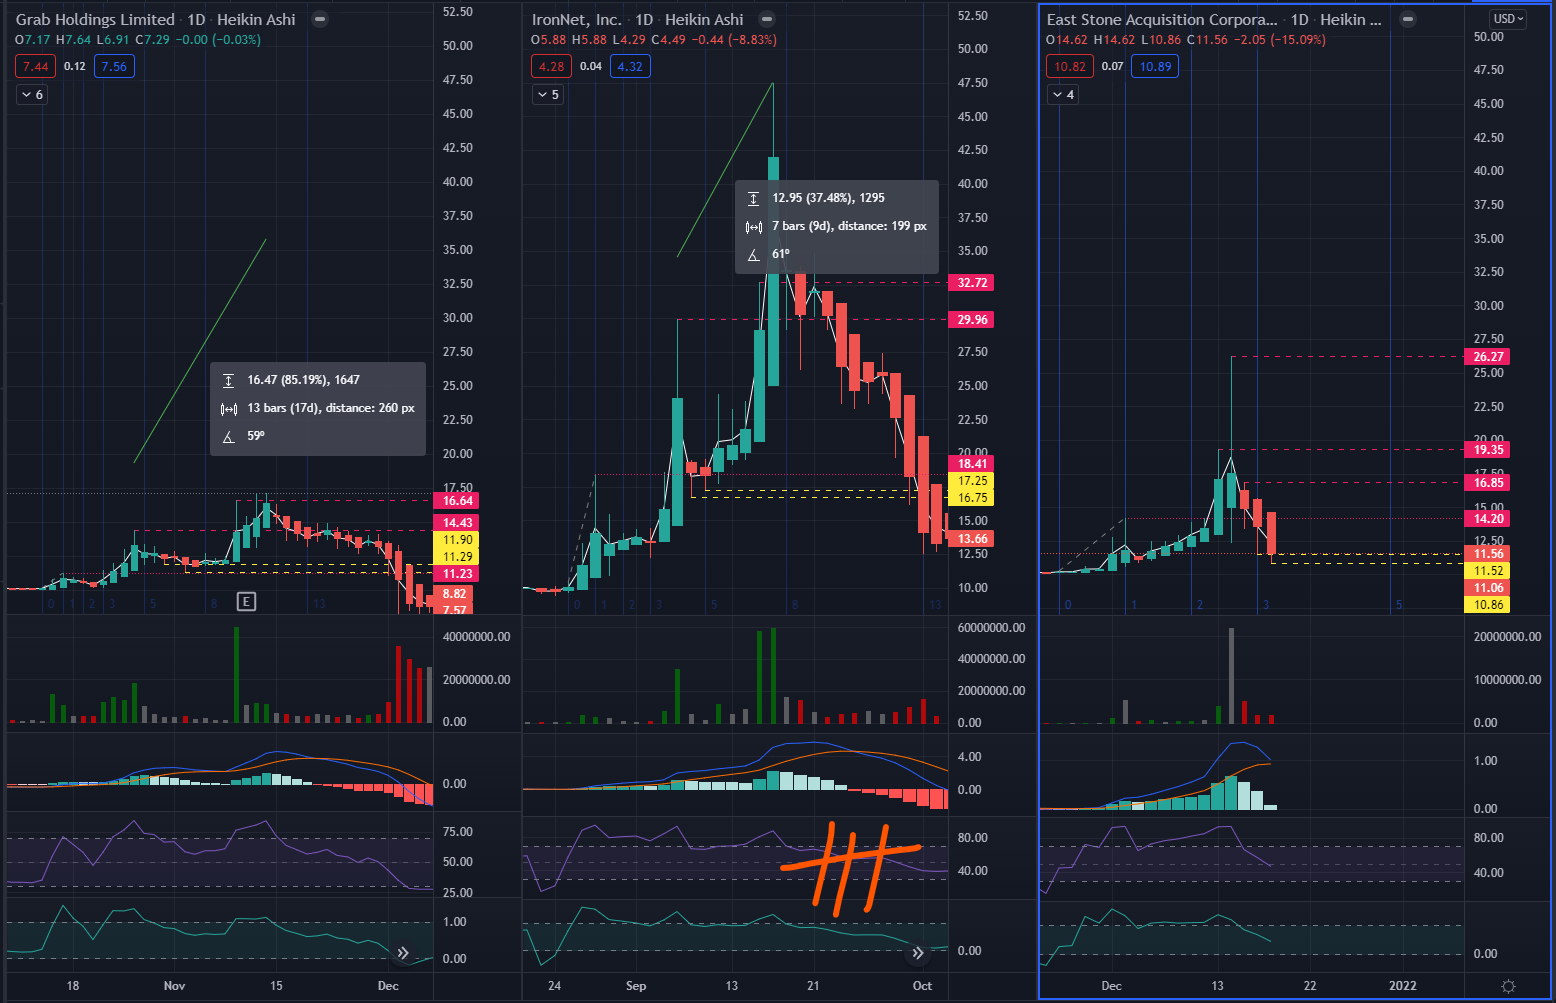
Comparing once again to GRAB and IRNT…
Given that there is plenty of time before ESSC’s next meeting on February, I am of the opinion that another bullish rally will soon ramp up.
I cannot recommend putting in capital at the moment since the market is really choppy now as we end the year 2021.
We also ended the week on a Quad Witching Day and FOMC at its rear.
The market it tired and needs a bit of room to recover.
- It took GRAB (AGC) 17days between the 2nd and 3rd peak.
- IRNT had 9days before reaching its 3rd peak.
- Notice IRNT also closed it 3rd and final bullish run on a QWD.
- I would have loved to see it retain volume and price above 14.20, and as soon as I it near that mark, I will add to my position.
- It has fallen way below my the 12.50 mark there most of the Options Oi were invested.
- Both 10.86 and 11.52 are now minor resistances.
There still seems to be a good amount of sentiment left in reddit and other platforms, but I want to see the price reflect that above 12.50 again.
Shares are better for these plays since:
a) you don’t have to worry about theta decay, and
b) the close you are to the NAV price of 10, the safer it is for your position and of course most profitable.
Choosing mostly Options on these plays may actually be detrimental against the bullish momentum–especially OTM.
I’m really hoping my charts are helping some of you in deciding entry and exit points.
Regardless, I think it’s important for the group to have a visual guide on big momentum plays like this one.
The notes on this thread are outstanding to say the least, and should easily help you plan ahead should a new SPAC/deSPAC play comes up.
Thanks again to everyone who contributed!
12 Likes
@rexxxar awesome summary and update! So much to take away from your post. That is one of the biggest take aways I had in ESSC, shares vs calls. For these types of ramp ups or plays I will certainly be more open to shares vs options based on theta decay. Your charting is definitely in infinity god status and will be trying to focus 2022 on understanding more. Cheers!
4 Likes
Don’t know what influence this guy has, but seems like people are still digging dip to keep ESSC alive. Things could ramp up for a second run if retail traders can muster the courage to hop back in at the right entry points.
3 Likes
I’m still keeping an eye on this one.
Due to the ambiguity of the float, I’m going to, for the purposes of calculations going forward, use a float of 1.5M shares for calculations of OI % of float. This is the middle ground between “all shares in the float” and the 340,000 share “chad float” we’ve used previously. Sticking with this number may give a somewhat more accurate picture of the potential of the play as we move into January, however, it should be kept in mind that the float, in my opinion, is lower than this number at this point possibly to a substantial degree.
With that said:

The current ITM OI sits at 18% of float with the $12.50 adding enough OI to push the percentage to 63%. The full chain is currently sitting at 115% of float in total above the $25 strike.
At this moment, I think consolidation is still in store for the next few days, however, I wouldn’t be surprised if we see accumulation of OI start ramping back up towards the end of that period. What we’re watching for here is specifically a “doubling” of OI within the chain around the ITM strikes. We’ll know more tomorrow.
14 Likes
I think if you’re playing a gamma squeeze potential for 2022 Jan exp, then accumulating Shares near NAV would be better until the ITM OI increases just in case then if the play doesn’t work, the shares can be redeemed.
7 Likes
anyone playing options on this? I dont see options chain for after Dec 2022. Also what DTE and strike has good OI and volume?
3 Likes
yeah, it seems they dont have options available after 2022. i might go shares for now but if I was going to play options on this, I would go for Jan 2022. this is all up to your risk tolerance really. personally, my definition of “good” OI is at least >= 1000 and volume at least >= 100.
2 Likes
yup… no jan 23 chain for now. and dec 2022 is the last one. $12.5 has roughly 1500 OI but no volume. Dont want to go higher than that for strike price, ideally want $10 calls.
5 Likes