Some observations on where SPX is starting Sep from:
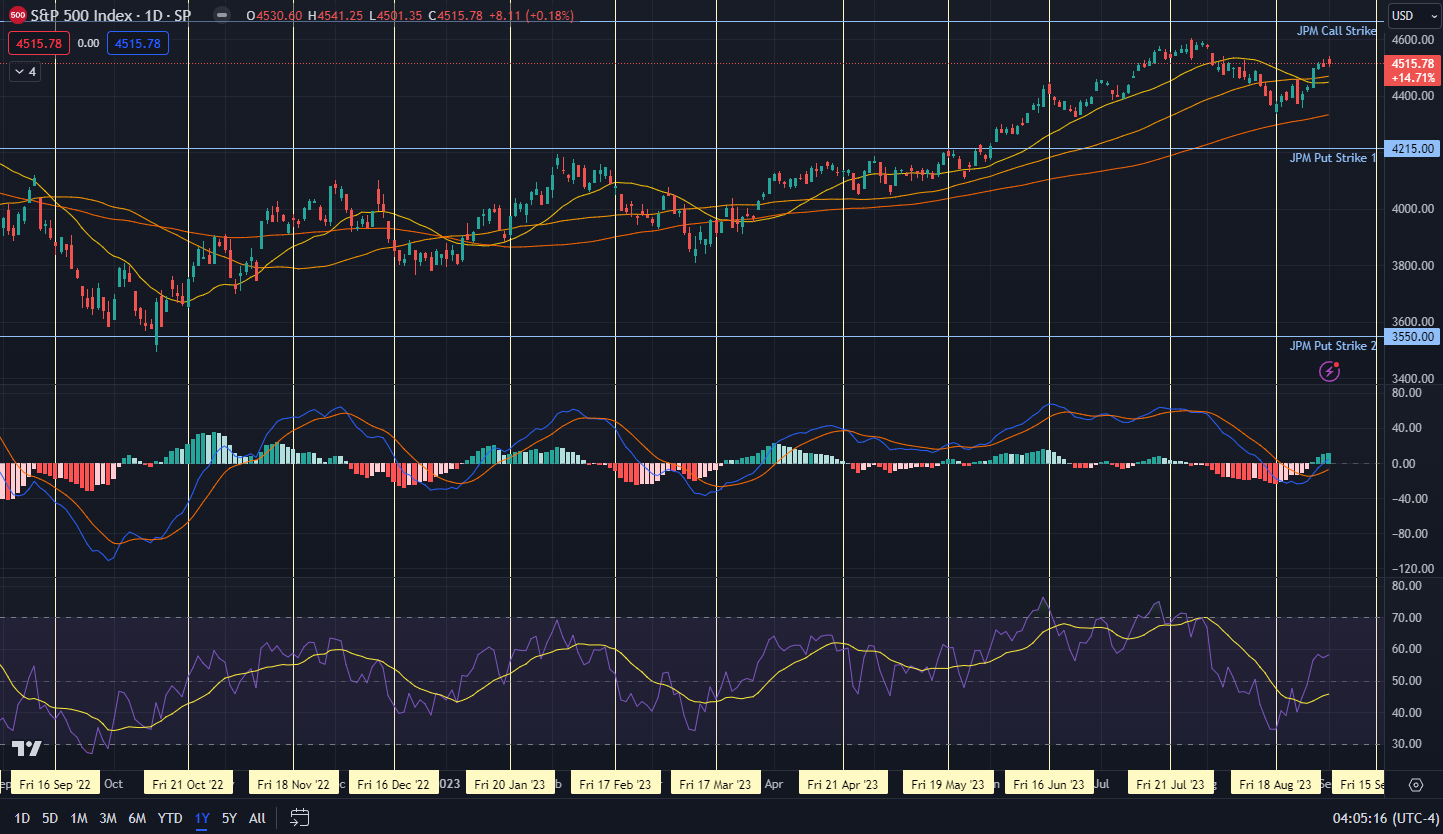
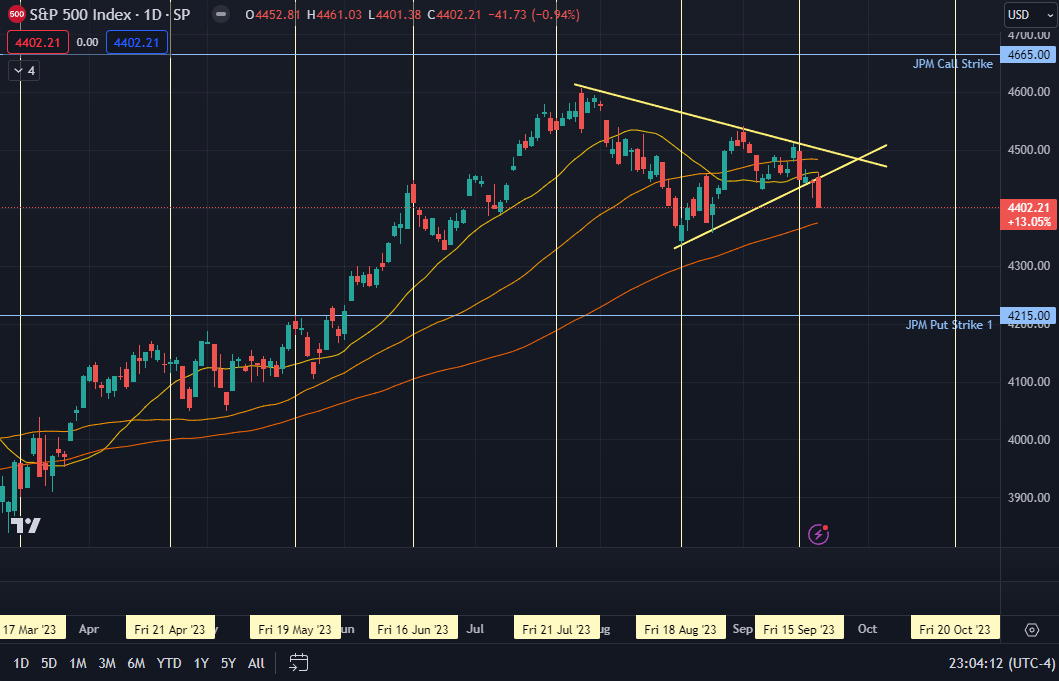
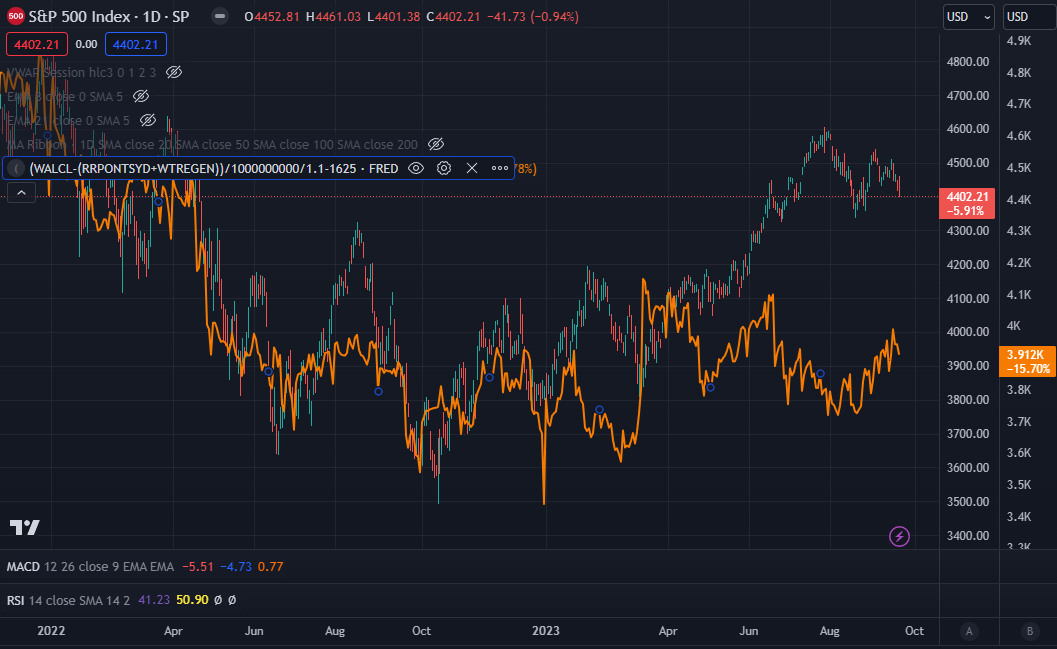
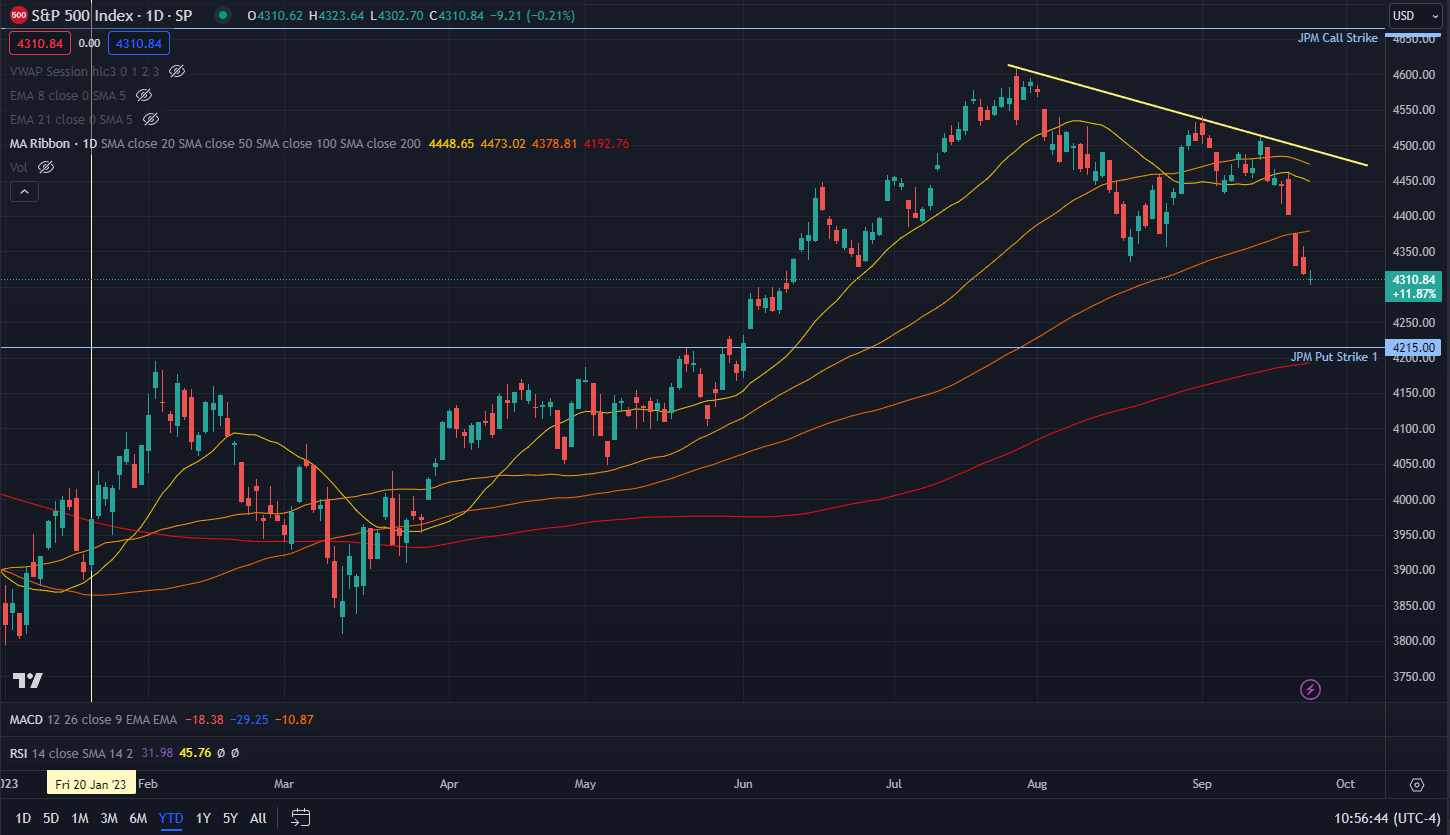
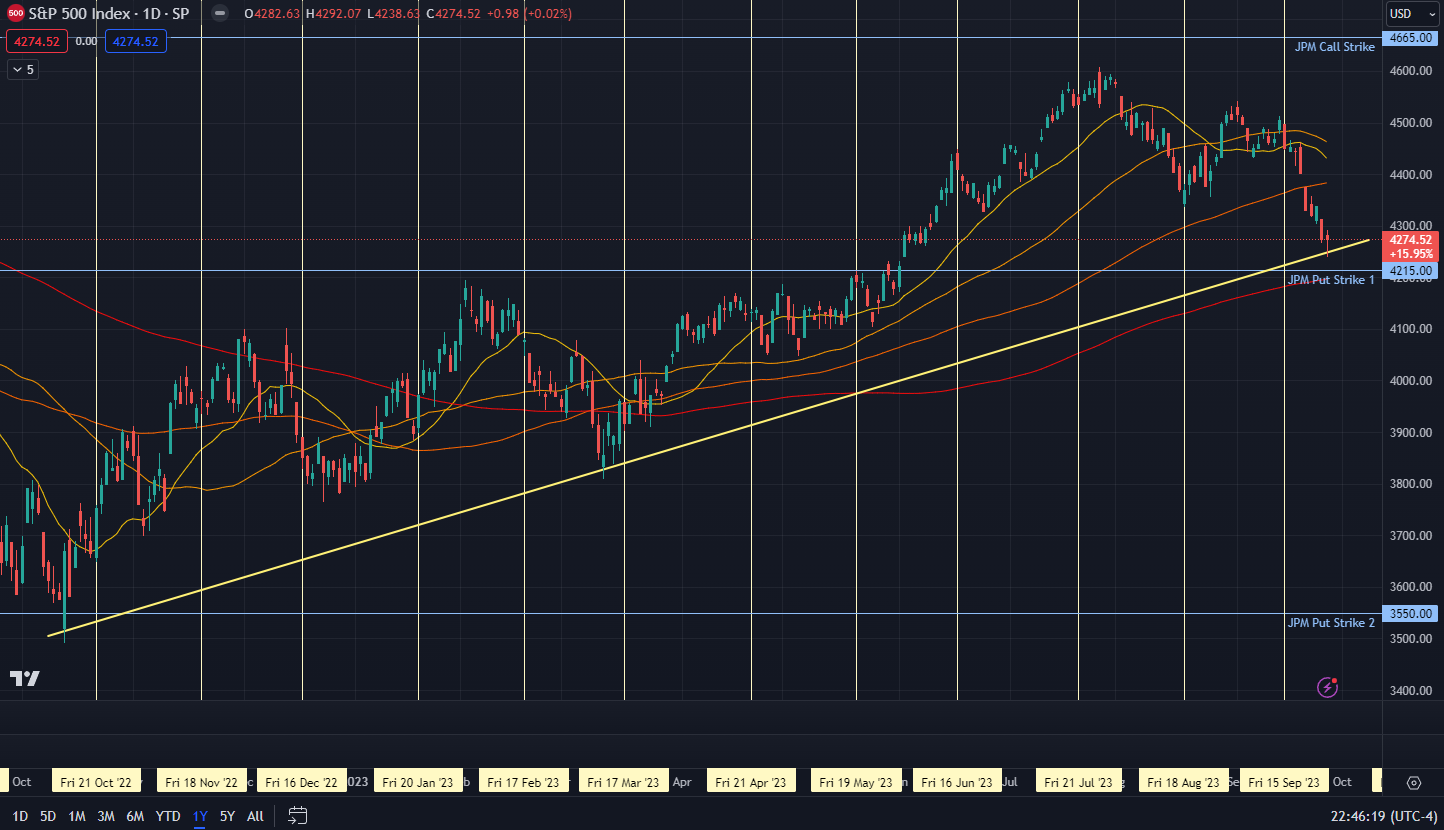
We closed out a happening Augustover 20SMA and 50SMA, which should be making folks feel relatively good (Image 1).
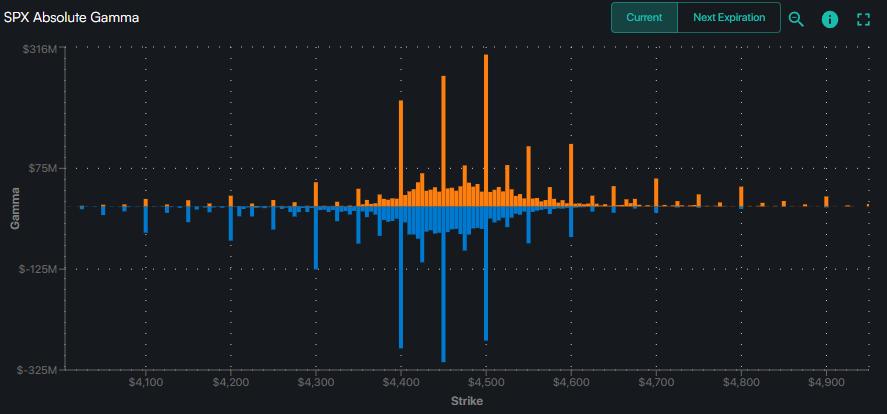
The massive quarterly opex is 9/15, and the vanna and charm flows occuring now should be supportive.
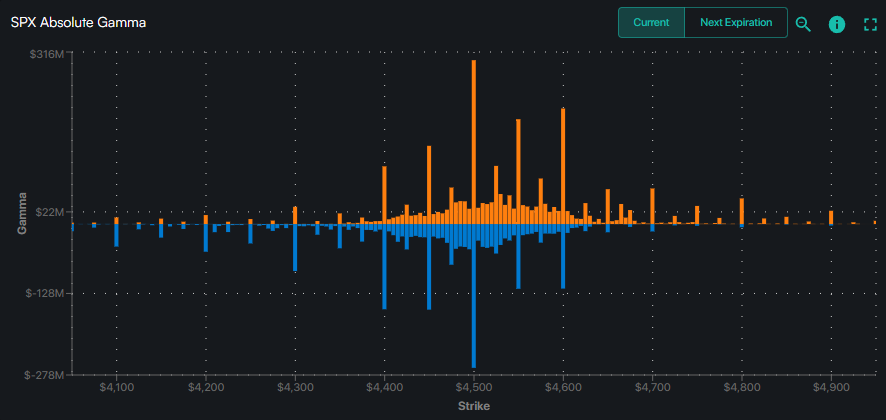
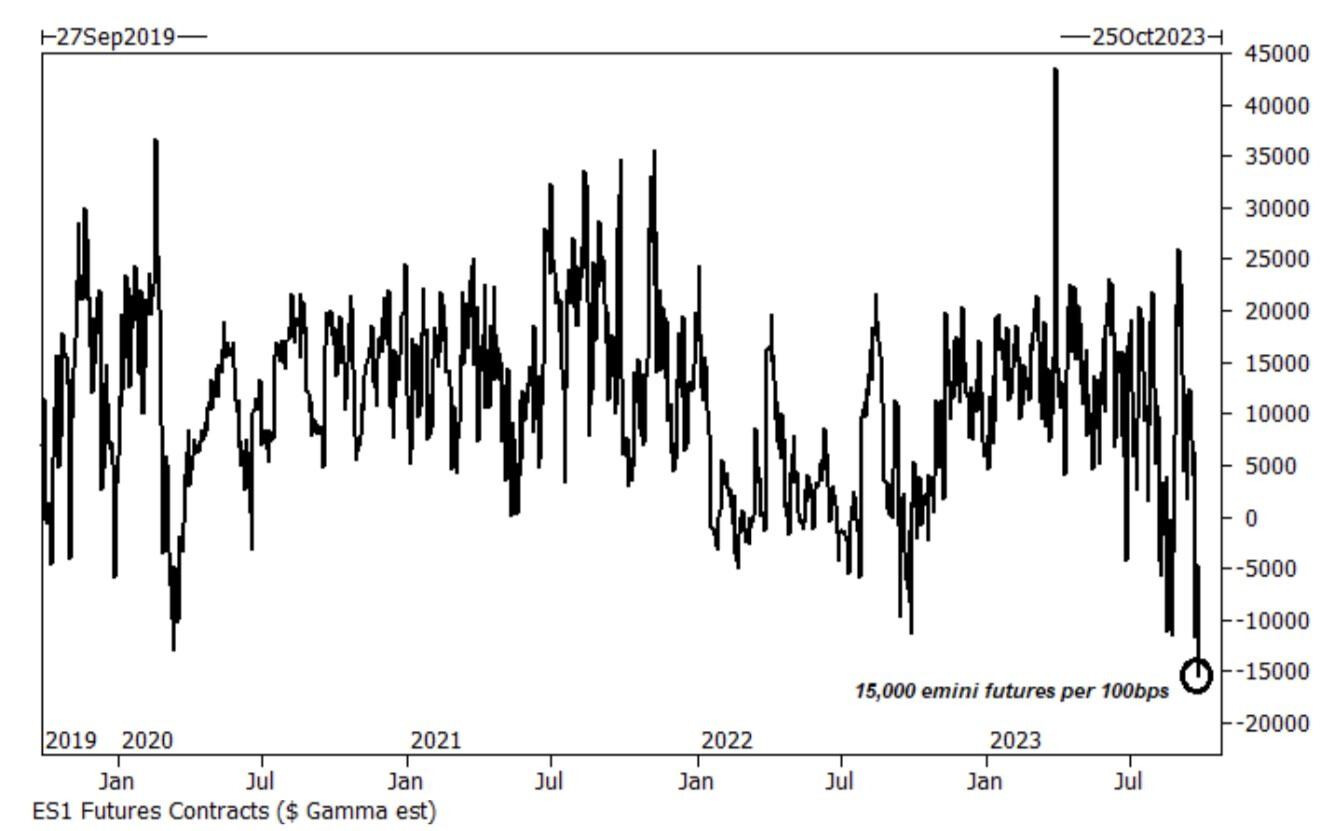
We have a ton of structural support going into opex. (Image 2). All that orange call gamma should pull us upward slowly, while the blue put gamma provides support if we do fall below 4500
Vol trigger is at 4495, so we’re just about in positive gamma territory.
Call wall is at 4600, so any upward move should make it up to that with ease. Put wall 4300, and is not in play.
There is more put OI at SPX 4400 than 4500, more put OI at 4300 than 4400, and so on until 4000, so even if market falls, there is increasing levels of support, implying the fall will be in a step-stair fasion and not knifing.
Overall, I expect markets to stay over 4500 and drift upward toward 4600 between now and next Wed (9/13) That is when the supportive flows peter out; CPI also comes out on Wed.
A likely big picture trajectory is: we do a double top around opex, then fall after as all that supporting call gamma disappeares, then - and hence the title of this post - start a rally into the year end. Will be updatnig this as we go along.
Didn’t take markets even one day to b*tchslap this notion hard. Nevertheless, SPX did bounce right off the 20SMA (Image 1), and those flows are still there, so not changing my expectations yet.
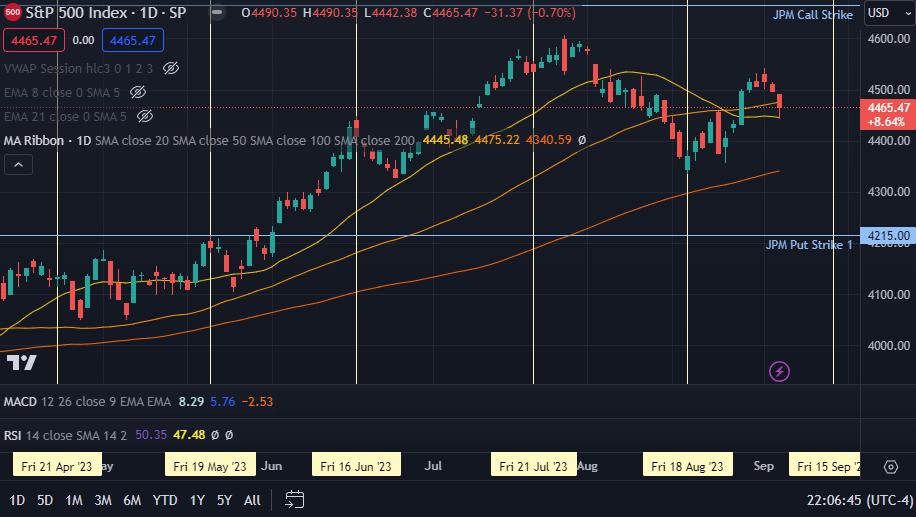
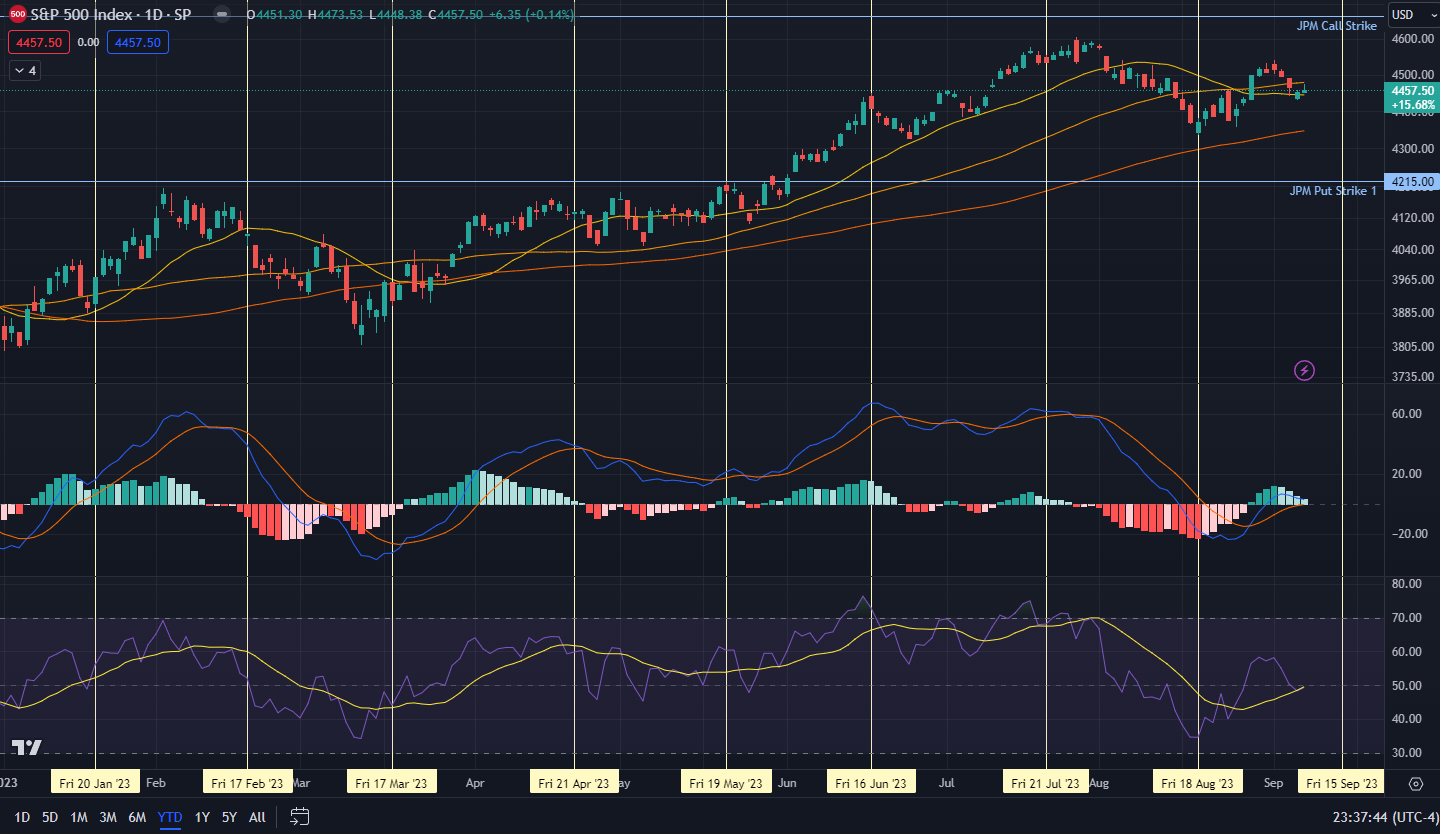
Vol trigger is 4475, which is 10 points over where we ended. So still pretty much on the cusp.
Don’t really have a strong feeling going into next week. Technically option flows should be supportive, but we’re quite below the vol trigger (4495), closing Fri at 4457. More importantly, CPI Wed PM, and that will likely set the tenor from then onward than anything else.
Nevertheless, it’s good to go into the week with some market awareness.
SPX is kinda muddling around between the 20SMA and 50SMA, and just retraced back the JOLTS green dildo. We have a lower low, but this seems inconclusive.
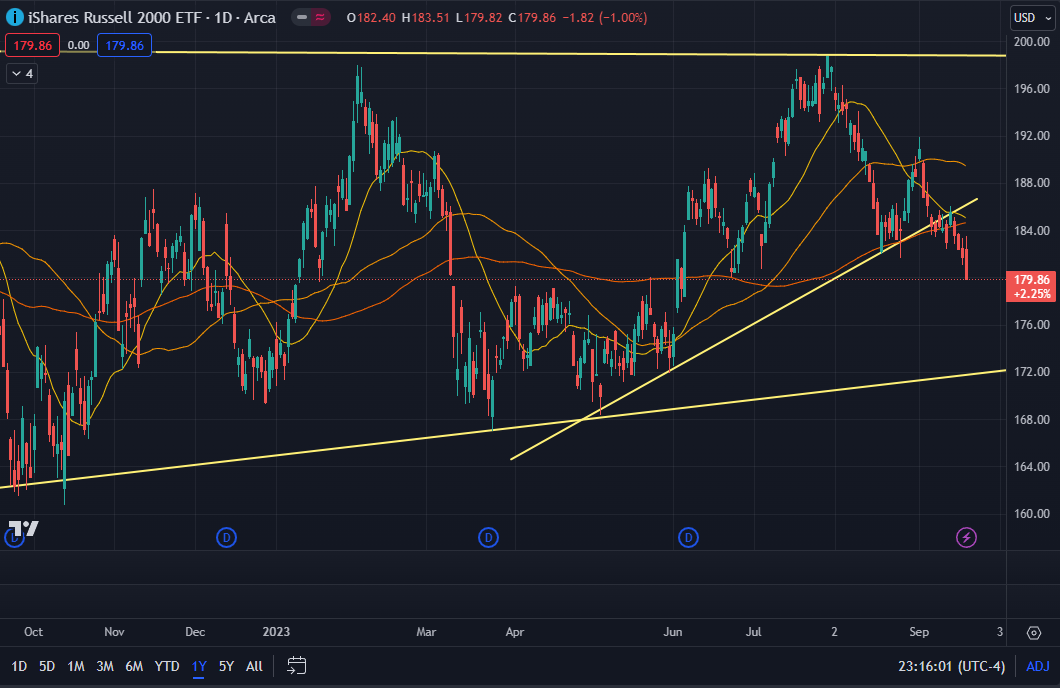
IWM is more interesting. 20 days ago, we wondered if it would bounce off the trendline and moon, or if it would be a H&S pattern. Turns out it did the latter very clearly. This is bearish.
Spoiler: IMW comment from 20 days ago
Also interesting - IWM (the real-economy companies) - bounced right off its 100SMA and trendline. Nice supportive move there. Shall we see IWM go back to the top trendline, or will it form the second shoulder and resume its move downward? Will be watching this closely.
NDX isn’t showing anything that different from SPX.
Underneath this all, there’s the heavy quarterly option structure, expiring on Fri. It shows surprisingly strong gamma levels at three strikes - 4400, 4450 and 4500. Can’t say I have seen it before. Movement should be sharp between those levels, given negative gamma, snapping to those levels acting like magnets.
With no economic news today and tomorrow it provides less friction on markets grinding up. However, I think CPI will dictate the next short term trend.
And if markets keep rallying into CPI it raises the risk to the downside.
Apple could be a good mover tomorrow at their event. Historically speaking it moves up into the event and sells the news during the event.
While we likely will want to give the markets another day or two to confirm whether FOMC has really pricked the balloon, initial signs do suggest we are looking at a correction:
SPX is below the 20SMA and 50SMA, and looks like will hit the 100SMA soon. It’s also broken out of the symmetrical triangle where we had ended yesterday.
As noted in Discord, we started the day with a 4500 Call Wall, a 4400 Put Wall, and a 4450 vol triggger. We ended at 4402, well underneath the vol trigger. Note that while option strike gamma pins are almost non-existent at this time, MMs still have to hedge 0DTEs. Now that we are in negative gamma territory, the institutional cow tippers might show up in force and tip market cows down the hill again.
QQQ shows a similar pattern as SPX (my NDX chart has opex lines so choosing QQQ - same difference re: pattern).
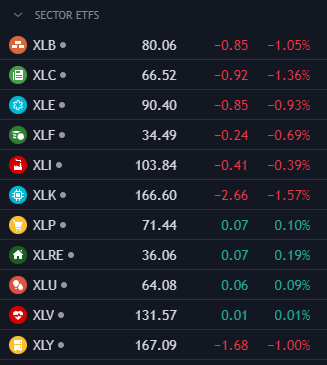
Sector rotation seems to have taken place today - Utilities and Staples are up, Telecom, Tech and Discretionary are down.
We used to follow some measures which used to correlate very well with SPX, but stopped around May when they correlation died. Reproducing some of them here again in case it’s time for the jaws to close and correct these imbalances.
How low could we go? For no reason other than it would be hilarious, I’m mentally rooting for 4215 - the JPM Collar. There is no way to know, of course, but will play it bearish until the signals suggest otherwise.
Thursday 8pm PST is when the Bank of Japan announces their interest rate decision.
There is a strong possibility that they decide to raise rates to support the yen, as the USD/JPY is once again at about 150, which was when the BoJ intervened previously in Sept and Oct 2022.
If they intervene, it has a negative impact on the yen carry trade. tl;dr yen carry trade = market participants have enjoyed borrowing yen for free to buy USD, which they then use to buy bonds or stocks.
Yen carry traders would feel some pressure to close out their carry trades. This means selling the stocks or bonds that they bought with the “cheaply” borrowed USD and returning the yen before the yen keeps going up.
Put wall has moved down to 4300,which is often a signal that market still wants to move lower. And vol trigger is way up there at 4480, so we are in deep negative gamma territory. This means MMs will exacerbate moves, down or up.
Both equity selloff and bond yield run got a little overstretched yesterday, so they may take a breather at some point today. Also, after two nice red days, folks will likely monetize puts and close shorts so they don’t have to hold over the weekend, providing some support. If we rise into the higher 4300’s, will take this opportunity to load up on the downside again for next week, as I’m not sure if the selloff is done yet.
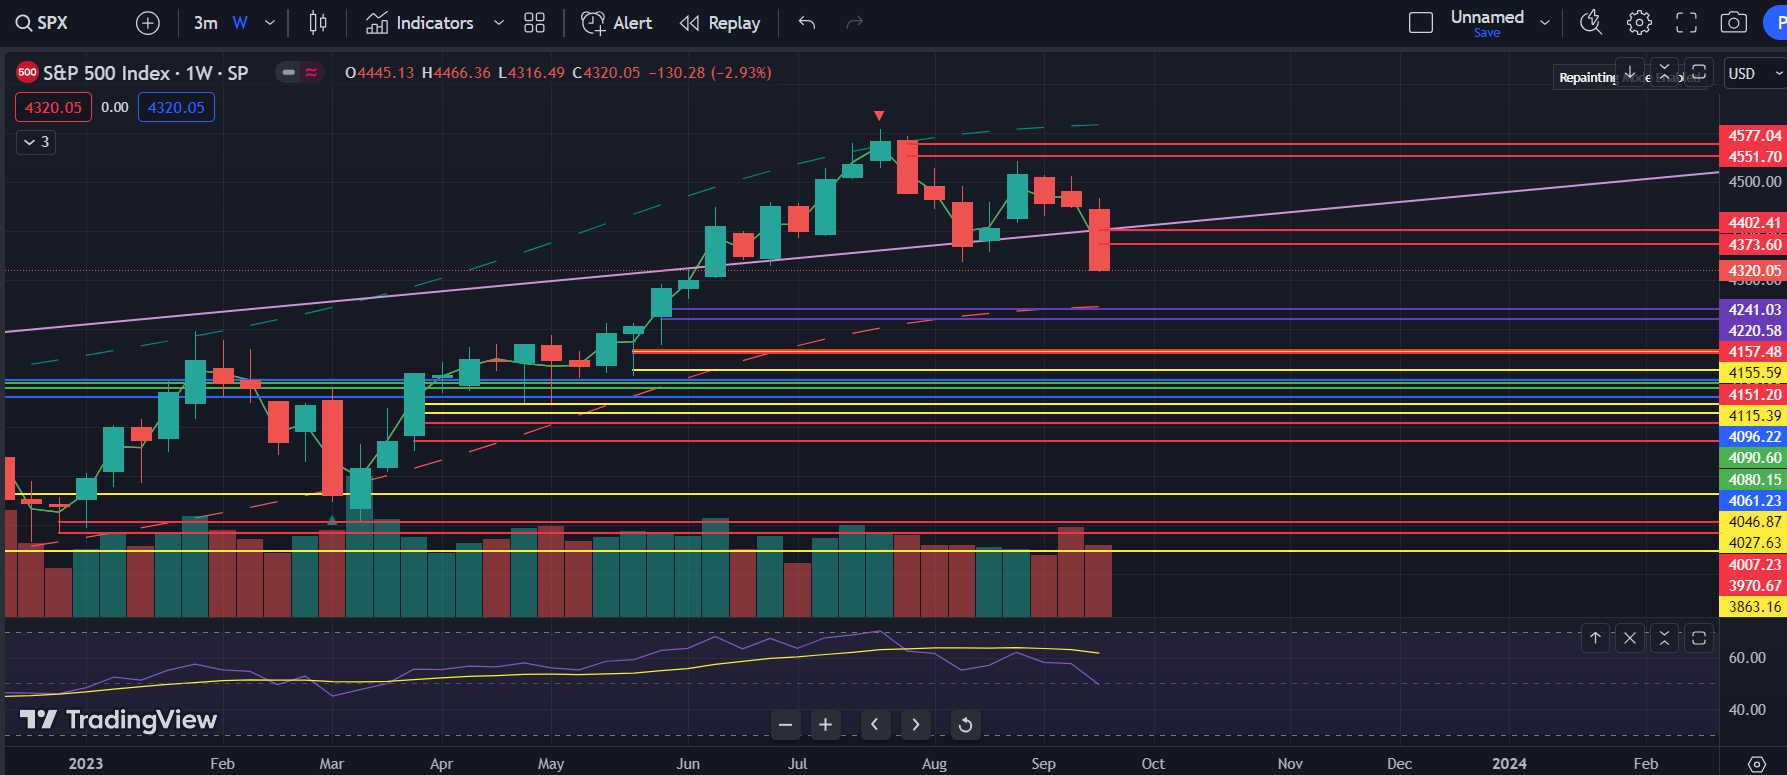
Looking at the weekly on the SPX, we have increasing sell volume on the red bars (using SPY) and a strong follow through candle. We set up a lower high and now making lower lows. We also broke below the purple trendline which marks huge moves each time.
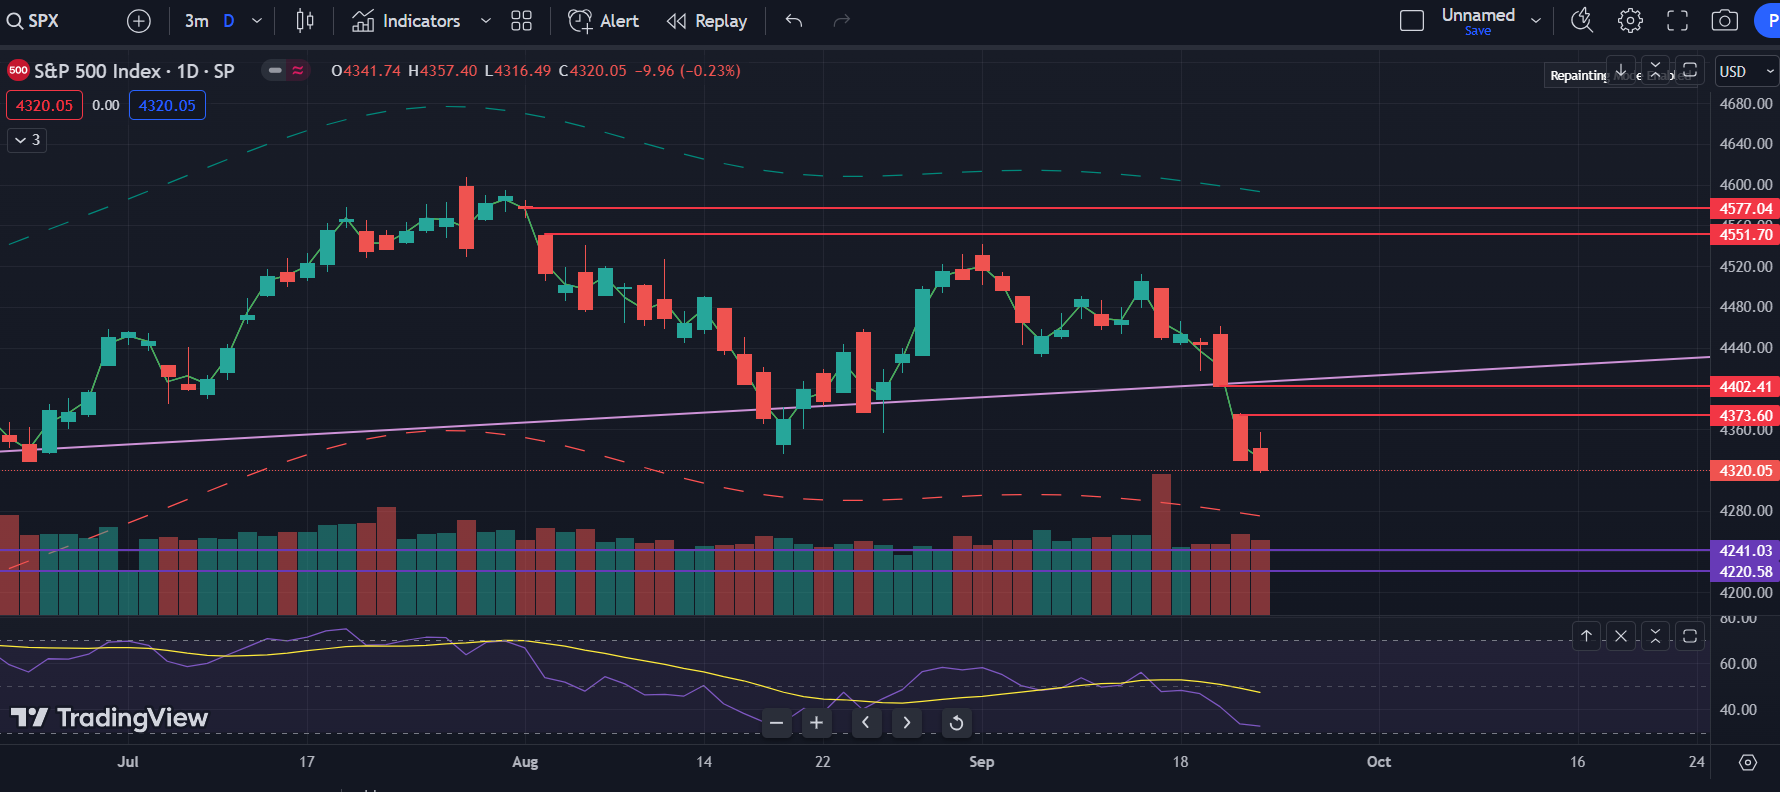
On the daily, we have high sell volume with the gap up in the morning that was eaten up. We have a continuation lower with us making new lows. Although QQQ hasn’t broken its support yet. This is still bearish as it seems like there are no bulls here and seems like we won’t have major supports until like 1% lower.
Looking at the hourly, there is some hope because we are forming some bullish divergences on the RSI. But, during these strong selloffs, we can stay forming these bullish divergences for multiple days and head much lower before a big bounce. So I wouldn’t go balls into puts here, but small sizes to capture any moves down and buying puts at bounces.
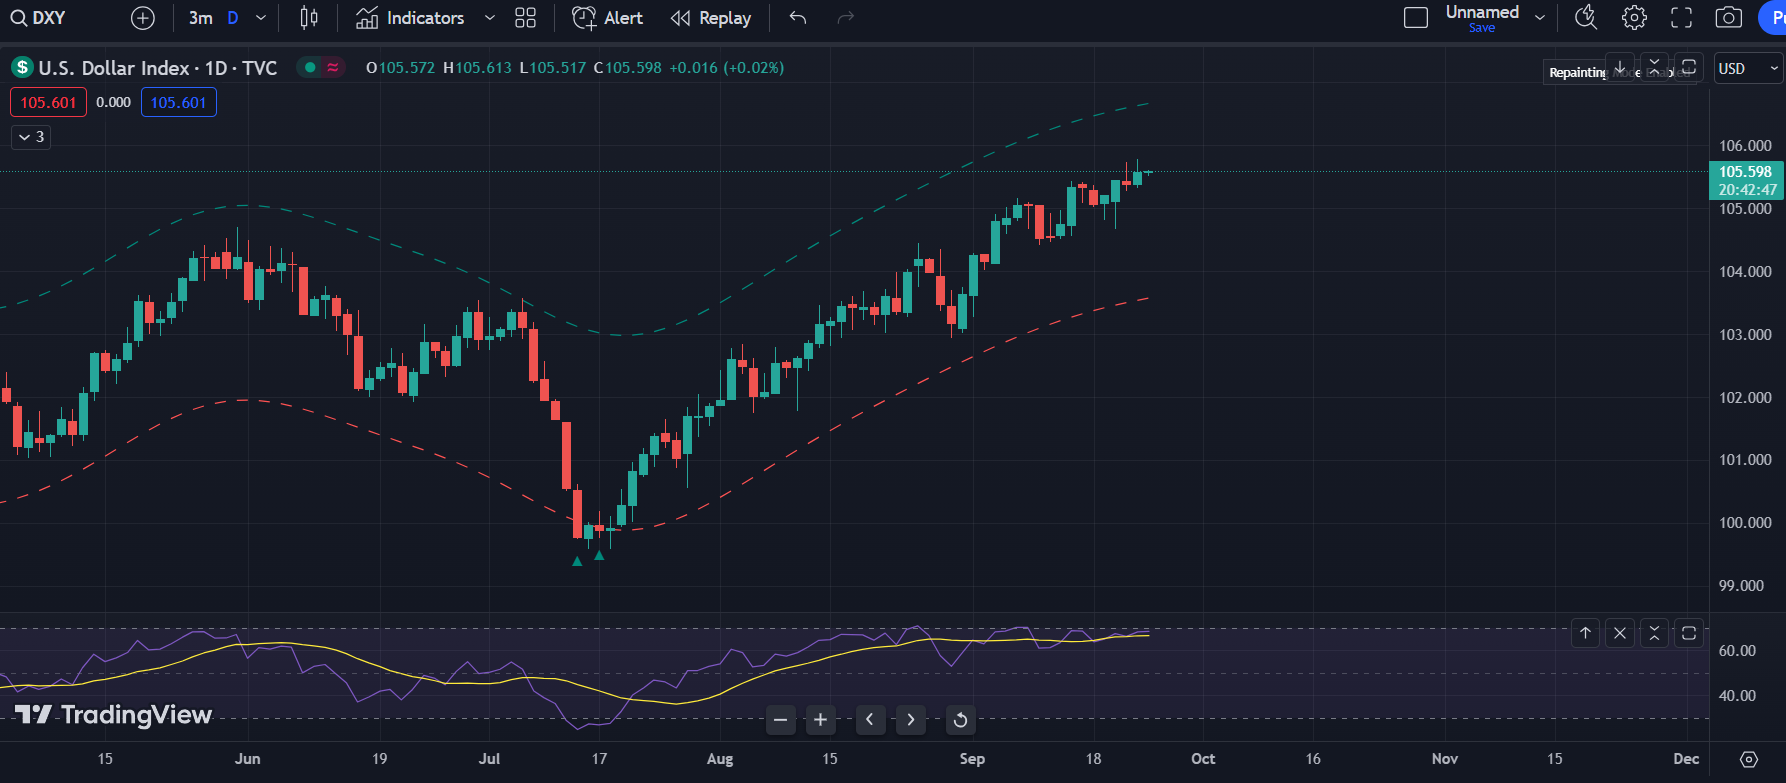
The dollar is showing strength and has been on a tear recently. Maybe it starts to pullback and the markets start to bounce up with its bullish divergences, but the trend right now is strong like the stupid strong bull rally months before.
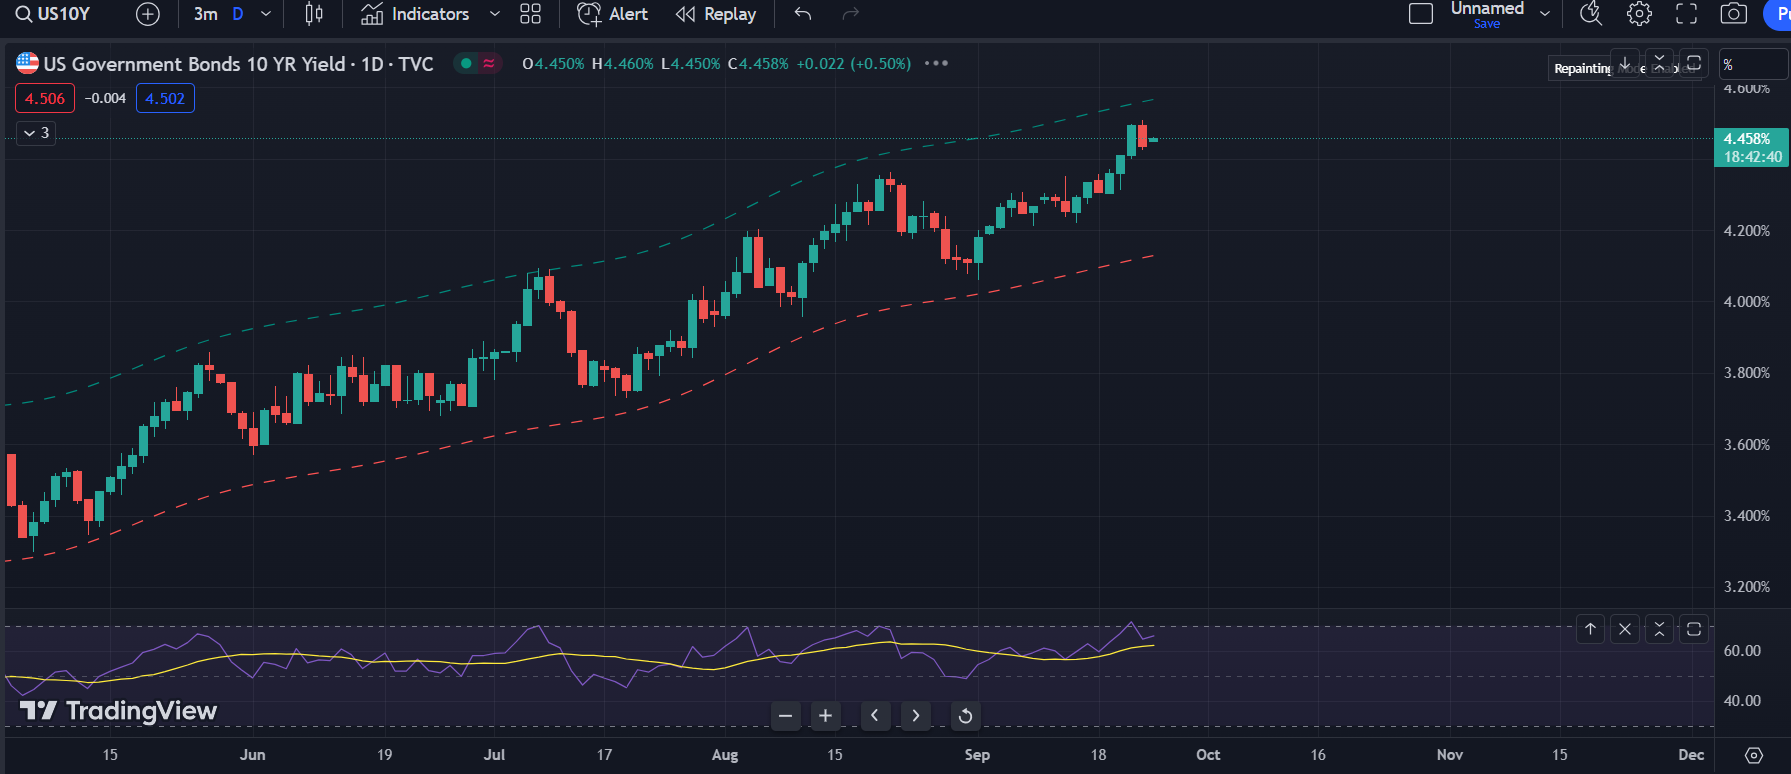
The yields are also sky rocketing because of the hawkish Fed. This will continue to put pressure on the markets and until the news is priced in, I wouldn’t expect markets to rally.
Overall, I expect a continued selloff until some major supports are hit which is still like 1% away. Maybe there will be some bounces along the way, but I expect more downside from here. Good luck all
On one hand, Call Wall is at 4600 and Put Wall is at 4300, suggesting this could be the bottom for now, given the support we have at 4300.
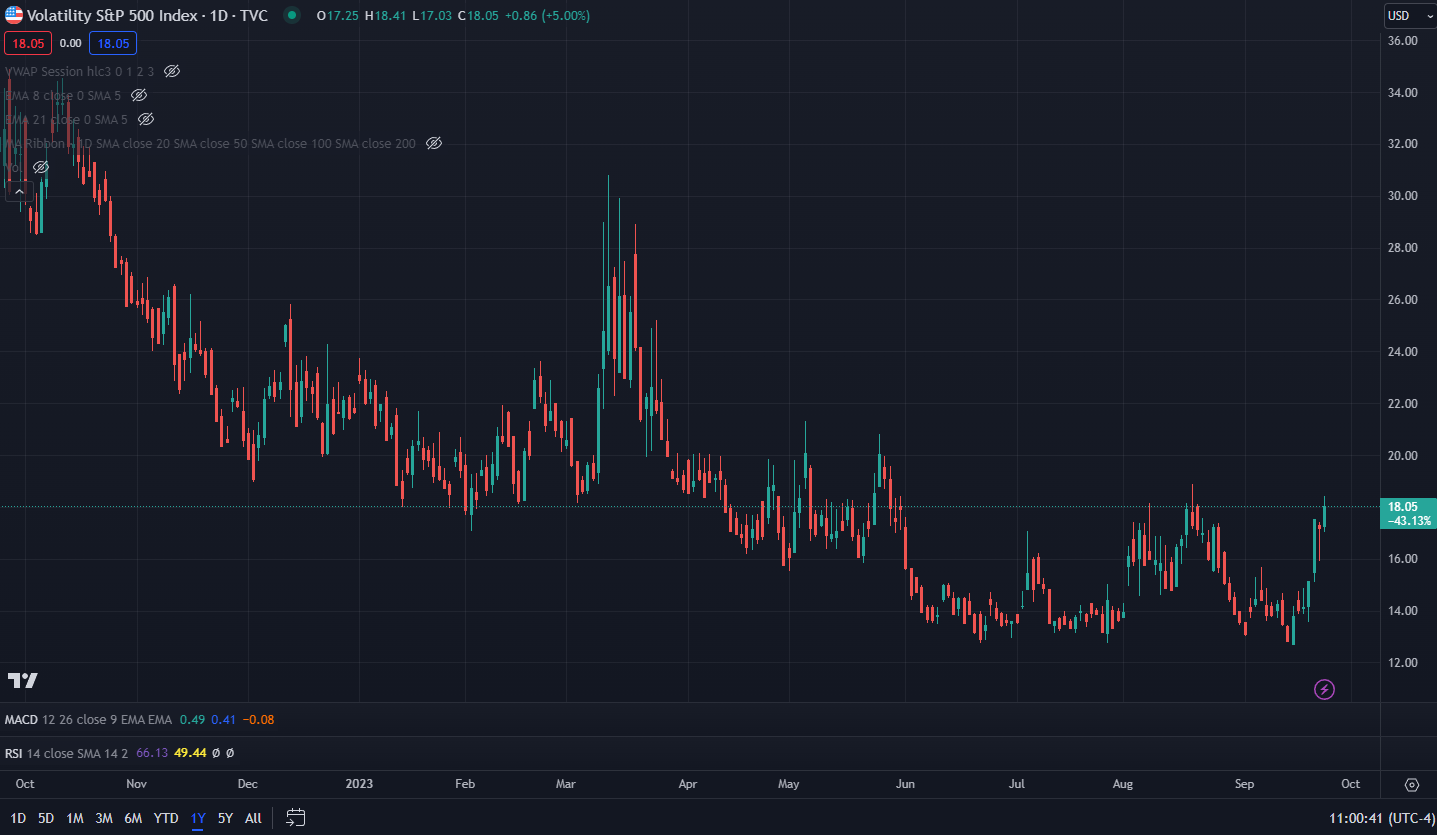
On the other hand, we decidedly breached the 100SMA and are looking longingly at the 200SMA, which also happens to be at the 4200 level. VIX is rising, as are bond yields.
To top it off, vol trigger is … 4480 - we are in deep negative gamma territory. So any move will happen fast.
I have a slight tilt toward a downward move to 4200ish, but not with great conviction. We might consolidate for the first day or three of this week, and then respond to GDP and PCE on Thu and Fri respectively. After all, the post-FOMC selloff does warrant some consolidation.
Fwiw, a flush to 4200 would be nice so we can start the rally to year-end.
Tl;dr: No idea what will happen in the next two days, but whatever happens, it should be provocative!
What a day.
The negligible close-to-close change belies the violence that transpired throughout the day. First we had a 1.2% drop to rip one side of the face off, then a 1.2% rally to rip the other side of the face off, and then a 0.6% drop to punch the nose in… (Assuming one was caught offside.)
I scoured my various sources to see if there was a clear “why” for why those strong u-turns happened, but no one seems to have anything definitive. Even 0DTEs didn’t play a role, apparently. Only thing that comes up is that the MOAT (Mother of all Trendlines) was touched, and countless algos kicked in to save it from a breach. Could not reach any algos for comment, though.
The potential range of movement over the next two days is very wide. Given that we closed (4274) roughly in the middle of vol trigger (4360) over which things should get calmer, and the put wall (4200) which should act as support, that leaves a 160 point range to flail around in. It may be prudent to just keep arms and legs inside the ride for the next two days, so as not to lose them to all that intra-day volatility, unless one feels comfortable riding the rips and dips.
Of course, the other thing lurking in the background is the put strike of the JPM collar, at 4215. It is currently at 18 delta, suggesting a roughly 1 in 3 chance of us touching it at some point. MMs are now actively hedging for this as it had gone up to ~35 delta at some point during the day, vs last week when delta was < 5. Unless GDP and PCE numbers are great, 4200 therefore still seems to be in play by Fri.
Incidentally, GS notes that there has not been this much negative gamma ever. This reinforces the call to be careful as movement can be frequent and violent.