SPY Tech Anal: Can November Be a Month For Bulls? It's Been 10 Months of Gay Bear

TLDR: I personally think that Fed will still be hawkish tomorrow which will cause the entire rally we’ve seen to retrace and disappear. This is because CPI, PPI is still hot and we haven’t seen the economic slowing down to the levels that the Fed wants. Maybe one more hawkish Fed before dovish Fed.

TA really doesn’t mean shit right now but if you’re interested, here it is.

On the hourly, we had a huge gap up overnight and then the PPI numbers came out which shat the markets and then caused a chop day afterwards. Personally just looks like a bear flag to me which seems like we broke down in AH, but we’ll see if it continues to track down tomorrow morning.

SPY on the daily is still in an uptrend, but we’ll see what happens with the Fed. RSI above 50, low volume selling and still above both the 8/21 EMAs. I personally think that we’ll go retest the 350 level, but we’ll see.

VIX is basically flat again. Nothing to see. Maybe everyone expects fed to be hawkish so that’s lower volatility.

Overall, just watch what the Fed says at 2:30 and then either take your swings then or gamble like a retarded degenerate and get a 1000% or a -100%. Good luck all.

1 Like

So puts :pepedetective:

No retard. Calls because Inverse Yong

Wanted to share some background information as we go into FOMC meeting that might assist us in formulating our responses once SPY (and the market) starts moving.

  1. VIX is not too high, and not too low. This may represent a certain complacency in the markets, especially with all the pivot talk. It is also low because there are not nearly as many puts available as hedges. This means that if the Fed does indeed go dovish, we will have a rally that will enjoy some support from the event vol dissipation, but not nearly as strongly as in June. On the other hand, if the Fed goes hawkish and market falls, VIX has room to spike if hedges prove to be insufficient to slow the fall. So there seems to be more risk to the downside here.

  1. On that note of sufficient hedging, we can see from the option gamma complex below that there is no material support until 3700. We are at 3835 right now, and vol trigger is 3830, so we are on the cusp of where MMs will switch orientation from damping movement to exacerbating it. 3900 and 3950 seem to be resistance levels overhead, while 3700 is the first major support below. Again, reason for caution - you’ll recall that we used to have quite solid supports even just last month - most of that has dissipated.

  1. Bond markets seem to have walked back from their pivot expectations. The first image is from last week; the second is from now. A full additional 25bps has been priced in since, with a second 50bps now expected in Feb 2023. How this changes will be more important than the spot raise today. If market things 525bps will be the terminal rate through the rest of 2023, we can expect significant downward movement in the markets. Market is also split about the Dec rate 52%/45% on 50bps vs 75bps - clarity on this will also move markets accordingly. It’ll get confusing if he guides for 50bps in Dec, but promises higher terminal rates.

image

image

  1. DXY has been weak recently, but is back in channel. If rate hike expectations are spread into the future more than it is now, and the long end rises up more, we can expect additional influx of foreign capital, which will also juice up the USD. It is not clear if a pause will hurt the USD as much though, unless the long end falls significantly.

  1. The big unknown are the 0DTE SPX options that I’m sure are flowing in size. If someone has access to live flow data, this would be quite helpful. SPY shows lots of put buying but this is likely just hedges.

All in, it seems like a downward move will be more vicious than an upward one. This has implications on hedges we may or may not have, positions we want to take off or put on, and stops we may want to deploy.

7 Likes

From the trading floor last night:

75bps is priced in. So if we get 75bps expect a minor selloff into Powell speech. If we get 50bps the market will get fully erect immediately. Then all ears will be fixed on Powell’s speech. There are three general views of what he might say: (1) Fed is concerned with economic climate and is not going to commit to further increases in the Fed rate and wanting to be flexible to meet the needs of the economy (the pivot speech); (2) inflation is persisting and the Fed will not stop until inflation is back to target 2% annual rate (hawkish speech); or (3) inflation is a concern but want to wait to see the latest data before making any decisions on future rate hikes and won’t commit to anything (neutral speech). The pivot speech would send the market to the stratosphere because investors would see this as bullish because the rate increases have a soon-to-be defined expiration date. The following days would continue to be bullish into the midterms. The hawkish speech would result in a bit of a selloff. I don’t particularly think it would be a massive selloff because investors would still bet on the Fed caving to pressure to stop rate hikes eventually, but the market would move down after the speech in the days following. The neutral speech is probably the most likely outcome and would result in the market continuing its rally as investors bet that inflation has peaked and data will show that soon so future rate hikes will be muted or eliminated.

6 Likes

TLDR: I think that we’ll continue to head lower because the Fed was hawkish and the market was front running the Fed being dovish.

SPY on the hourly completely shit the bed. I think that we might have some kind of oversold rally to the 8 EMA or something, but we’re most likely going to continue lower. The RSI is very oversold and near the oversold LED lights. The ISM numbers tomorrow could also have us shit lower but we’ll see. TA wise, this is a strong selloff that will most likely continue while setting up lower highs.

On the daily, we had big volume bursting through big supports. This is bearish and most likely going to head lower. Maybe a rebound to the 8/21 EMA? Either way I’m bullish on puts.

VIX is weirdly flat but we’ll see if we continue on higher.

On the 2 year yields, it’s continuing to go higher. Not a good sign for bulls. This will continue to put more pressure onto stocks and we’ll continue lower. Doesn’t seem like the bond market thinks that the Fed will pivot soon.

The dollar rallied hard again as well. This is putting more pressure onto the stocks. Not a good sign for bulls.

Overall, it’s a pretty simple TA. Shit looks bearish, combined with the news of the Fed. Even if we have a green day tomorrow, it’s probably going to be put entries and not just a higher low. Good luck everyone and stay green.

5 Likes

Could be worth noting that a substantial amount of put entries stand to expire worthless tomorrow, if the current upward momentum holds and extends through Friday.

The 11/4 370p is sitting around 196k volume at the time of writing.

The chain down from there to 365p has volume ranging from 30k-110k.

My thought is that the closing of all these potions this afternoon and tomorrow morning could result in a small rally into the weekend, not to extend past Monday morning.

I’d probably look for SPY to close above 374-375 for this to be true.

Edit: there is also a massive volume of call orders at 372c which has accumulated to 100k.

3 Likes

TLDR: Charts are kinda learning bullish? Weird to see that considering that the Fed wasn’t dovish. Maybe the numbers that came in afterwards made the markets refront-run the fed pivot.

On the weekly chart of SPY, we rejected off the 21 EMA and ended below the 8 EMA. We’ll see if this continues and we make lower lows or if we go back to retest the 21 EMA and turn the trend.

On the daily, we have a huge bottom wick. It’s interesting to see, esp with high volume. Was this just a put wall of support or something bigger and a bigger support? We’ll see what happens, but we’re at the 21 EMA. The candle does look kinda bullish, but we’ll see if it develops into anything more.

On the hourly, it kinda seems like we’re in a bear flag. But we’re back above the 21 and 8 EMAs and they’ve crossed bullishly. The RSI is also above 50 and we’re just kinda ranging here. We’ll see if we can break out from this range or if we break downwards into a bear flag.

The VIX is continuing to head lower. This is bullish for the markets, but weird to see considering that I don’t think the fed was bullish enough to cause fear to leave and not for us to make lower lows.

The 2 year yields have a weird candle, maybe a glitch? But there are 2 huge upwicks on the 2 year. Maybe signs of peaking? We’ll see, but the fact that it’s not heading higher shows good signs for the market.

The dollar also died hard. This is also bullish for the markets. So far, most things are kinda pointing bullish for the markets, which is weird.

Overall, kinda a mixed bag, but signals are kinda leaning bullish for me. One thing that makes me hesitant is that the bond markets are continuing to head lower - typically if they don’t go up with equities, it means that it’s a bull trap. Also, tech isn’t leading the rally, which makes it very suspicious. But the yields and dollar and the small caps are kinda showing bullishness. We’ll see what happens, especially with CPI coming up.

TLDR: Maybe go up? Maybe go down. But ik we’ll go right.

Hourly looks like a fat fucking bear flag. But we are tracking up strongly so maybe we continue higher and break out of the bear flag. Idk

Daily bounced off and either looking to make a lower higher or a higher high. Idk, but volume is ridiculously low.

VIX is flatlining like my dead grandpa. Nothing to say.

Other key signs that I’m seeing is that the dollar is ranging and the TLT (bond market) is dying off hard. The TLT makes me believe that we’re going to see another shitter down, maybe at this CPI release. TLT’s direction has been right everytime this year so I would expect it to be right again.

Overall, markets are looking bullish, but with no real strength. Hard to tell what will happen so just either wait until CPI or take small position sizes with tighter take profits.

TLDR: SPY looks bullish enough for me to say that I think we’ll run upwards into CPI - maybe a range day. But we’ll see how CPI looks like tomorrow.

On the hourly, we see a pretty bullish candle. A huge bottom wick combined with a follow through green candle with a solid body, although there was a good upwick. We’re still above the 50 level on the RSI and above the 8/21 EMA and unable to break below both. This is bullish and I still expect us to keep running upwards.

On the daily, we had more volume but with a doji. This tells me that we’re going to most likely see a range day tomorrow with bulls and bears fighting here. But that’s just my dumbass guess. We did test the 21 EMA but did not break through. This is all bullish, along with the RSI fighting to get back above the 50 level.

Once thing to note is that the VIX is starting to show green. Maybe volatility increasing heading into CPI and an early sign that we could potentially see a good pullback.

Nothing really big to see on the yields so I didn’t include it, but yields are either going up or holding steady high, but with very low momentum based on the RSI and MACD divergences.

But the thing I want to focus on right now is the DXY. It’s moved down hard and looking to break through that level its bounced off the last 3 times. If it continues to move down, then the markets will most likely continue to move upwards.

Overall, things seem bullish, but I think the CPI will really point towards the next leg direction. If CPI comes in tame, we should see an explosion upwards. If the CPI comes in hot again, then we should see a quick retracement of this move upwards. In conclusion, just wait for what CPI has to offer before jumping into TA swings since news > crayon lines

2 Likes

TA is useless, just watch out for CPI tomorrow. I think it might actually come in good/neutral based on the bond and yields though. The yields actually went down today, possibly marking that inflation has peaked, even the core inflation. Also, the bond market isn’t free falling and is holding steady. Seems like good signs that inflation might be coming in tame, giving us a huge ass market rally tomorrow. But if it comes in hot again, well shit - bear season resumes.

2 Likes

TLDR: I personally think tomorrow is going to be either a range day or a low volume pullback day for the next leg up.

Looking at the hourly chart, I drew out what I think might happen. We ran a good amount in AH which is surprising to see. But it does look like an ascending wedge with a bearish divergence at overextended levels. I personally don’t think overbought at this bullish news means much other than a pullback to mean reversal. I think we will see a mean reversal to the 388ish level which is where the 21 EMA would be as well. That’s where I think good entries would be. Considering that tomorrow is going to be a bank holiday where funds won’t settle, it’s most likely going to be low volume with range or people profit taking which would be red. Overall, very bullish chart and I do think that we’ll get a pullback, but we’ll see since there is big news tomorrow as well.

On the daily, we have a huge buy volume which is bullish. The level I’m looking above is the major downtrend line that we have respected the last 2 times. I personally think that we’ll reach that level which would be around 400-410. Then I think we’ll see a good pullback or a breakout leading to another huge ass move. It does look bullish on the daily charts and I’m looking at the downtrend line for the next price target.

The VIX is at the levels where it has bounced off numerous times (the blue uptrend line). We’ll see if this means anything or if the markets suddenly just rollover here with the VIX rising higher.

The yields are dying which is good, but we’ll see if this continues or if this is just another pullback before the next leg up. But so far, it does look like inflation has peaked (or maybe not) and markets have a lot of weight that’s being removed.

The dollar has finally broke through the support levels and looks like it’s going to rollover. This is also good for the markets and bullish.

Another great sign that I’m seeing is the TLT or the bond market. The bond market agrees with this move up, which is a great sign. If the bonds didn’t move up higher with the markets, then this most likely would’ve been a bull trap, but it does seem like this move is supported. There was huge volume and it looks like markets are looking like bull season is coming back.

Overall, the great CPI report makes me think that we’re going to go test the major downtrend line on the daily SPY chart, but I think we’ll see a pullback before we do reach those levels. I think markets are going to run hard again front running the fed pivot. But maybe I’m completely wrong and this is all a bull trap. Who knows, but I’m personally bullish for the next upcoming weeks.

1 Like

TLDR: Maybe a pullback coming but I still think we’re on pace to hit the downtrend line around the 400-410 area

On the weekly chart on SPY, it looks bullish. There isn’t a bearish divergence and it looks like we’re strongly above the 8/21 EMA, maybe a retest to the 21 EMA breakout and then run up, but we’ll see. But we are reaching the downtrend line (yellow) and nearing the overextended range. Maybe this rally is starting to fizzle out for a pullback.

On the daily, it’s still looking bullish, but we are nearing overbought territory by crossing the green dots. It’s interesting to see what’ll happen, but we’ve moved up way too fast. I think there will be some kind of pullback to let some of the big money re-enter or maybe bull trap. Either way, this rally is starting to get overbought.

On the hourly chart, we are overextended on the hourly and forming a large bearish divergence. I think based on this hourly chart, we’re due for a pullback to at least the 21 EMA. The move up isn’t as explosive and starting to slug around. Shows that buyers are getting exhausted. Pretty often to see, but we have to see the lower high be confirmed after the pullback.

The VIX is dying off which is still a good sign for the bulls. Not much else to say other than maybe we’re having a EOY run up.

The 2 year yields did not die on Friday. Maybe a sign that we’re getting a pullback or another leg down? Maybe the market overreacted to the good CPI? We’ll see how the 2 year yields act.

The dollar is continuing to die which is good for the stocks.

Now I have some warning signs. The bond market isn’t going any higher, which isn’t good considering that the bond market might be starting to disagree with the market’s move up. If the bond market continues to run down after this, it might signal that the market overreacted to the CPI and we’re due for more pain.

Looking at the junk bonds, it’s making a lower high still. This bearish divergence with SPY isn’t a good sign. If this bearish divergence disappears within the next couple days, then it doesn’t matter. But right now, there are some warning signs that this move up from now might be a bull trap. Whether it turns into a pullback for the next leg or a the next leg lower, we’ll see.

Overall, I expect more upside after a pullback. I personally think that market will be green for a bit considering the CPI and markets starting to frontrun the fed pivot again. But we’ll see what happens.

5 Likes

We’ve been on an insane run since CPI came in better than expected. It seems like there’s a good chance the rally will sustain for a little while longer. Reasons:

  1. There really isn’t much news expected for a few more weeks, until we do the JOLTS, CPI etc all over again.
  2. VIX is dooooooown. (Image 1) This signifies market being in risk-on mode, along with a decent reduction in hedging.
  3. SPX closed at 3992 on Friday, just shy of 4000. 4000 has massive call and put gamma levels. (Image 2) If and when we cross 4000, the de-hedging of the puts and the hedging for the calls should provide additional tailwind. It won’t be explosive though, as we are in positive gamma territory, where MMs tend to dampen movement. So we can expect more of a glide up.
  4. The bond market has two 50bps priced in for Dec and Feb, and nothing after. (Image 3) Difficult to see how view of Mar 2023 changes in the next few weeks. Bonds have also rallied, with the long end moving the most. (Image 4) This is quite the pivot from the bond market, and they are supposed to be smart money.
  5. Safe to say that the USD has also popped out of its bullish channel last week, and reversed course. (Image 5) Just more tailwind.
  6. If markets keep going up, we can expect institutions to start buying in even more, as you don’t want to be a fund manager who was too cautious and missed the end-of-year rally, and therefore your bonus.
  7. If markets keep going up, short covering could provide additional fuel. Many shit stocks are heavily shorted, but shit stocks also tend to explode violently to the upside when the short covering rallies happen.
  8. The crypto shit show has not spilled over into the real financial markets, and does not look like it will.

While making any price target predictions is difficult, simple trendlines suggest we might get to 4100 by opex (11/18). The period immediately after opex can be a little dicey, and will comment more on that based on the option positions we see on Fri.

While all that sounds great, it is worth noting that periods of penance must follow periods of excess. We’re de-hedging and rallying and all that good stuff, but it’s often when we are least prepared that we get hit the hardest. And we’ve covered how we are not in the clear in macro terms by any stretch in other threads here. I certainly don’t feel like the bottom is in, and do feel agree with the consensus that we’ll very likely have another leg down in 2023.

But for now, we may have a window to make hay. So, lets!

Image 1. VIX

Image 2. SPX gamma levels (from SG)

Image 3. Fed fund rate probabilities (from CME)

image

Image 4. T-bond yields

Image 5. DXY (1 month)

Image 6. SPY lines

8 Likes

I forgot to update this, but look out for data tomorrow for a move. May have been priced with the EOD dump or maybe not idk.

Signs are pointing towards a pullback but we’ll see if data aligns with it

TLDR: We either continue to consolidate around here or continue up in my opinion

SPY on the hourly chart is holding on strong to its bull trend in my opinion. The RSI isn’t breaking below the 50 level and SPY is continuing to hold up above the 21 EMA after breaking below. Will this change tomorrow? We’ll see. There’s a huge bearish divergence, but was the dip on the war news it or are we going to go make another point of divergence and then get a bigger dump.

On the daily, we’re again nearing the overextended range. Interesting to see buyers continue to step in, which makes me think we’re going to hit the downtrend line of 410-400 soon. Volume is still there and it doesn’t really seem like there’s much reason to cause weakness right now.

The VIX had an upwick today, showing bullishness again. Interesting to see the VIX really not do shit for a while.

The yields are just flat lining while the dollar is continue to shit down. This is good for bulls and providing more tailwind.

Some other good signs that I see is the bond markets continuing to move up and make higher highs, confirming this SPY move.

Again, the junk bonds are holding up strong and formed a strong hammer candle. This shows strength in the markets. Overall, seems like the charts are all pointing towards the upside.

Personally, I think that we’ll see a bigger pullback to enter on calls or just a next leg down, but based on the charts, it’s really just pointing up. Be careful if we continue to chop around the next couple days. Good luck all

4 Likes

I feel the same way.

On Monday, I was expecting markets to make it past 4000 and maybe all the way to 4100 by tomorrow, which is now virtually impossible. Ukrainian missiles f*cking around in Poland, relentless Fed jawboning and TGT adding to the dour commentary on the state of the economy have added support to SPX/SPY retracing a decent chunk of the post-CPI rally.

Opex is tomorrow; let’s talk about what to expect. That’s a brick ton of gamma at the 4000 level.

A third of that is expiring tomorrow:

If we were over 4000, that would mean calls were ITM and puts were OTM. The calls would be hedged tomorrow, and dehedged next week, resulting in a downward move. We have the opposite situation here - puts are ITM, and calls are OTM. This means MMs are hedging by going short. This is assuming their counterparties are net long puts (put buyers) and not net short puts (put sellers).

When these short positions are unwound, there should be tailwind next week.

Such de-hedging flows are done within a day or two though, and after that, we enter what folks call a “window of non-strength”. I.e. there are no immediate gamma pins to effect the market so it can do what it wants.

Personally, I think we go up into year end for the reasons mentioned earlier. But there is this window where market could flail around, so will get some hedges tomorrow as I still plan to hold a decent chunk of TQQQ into year end. Fed is mad, and they might just decide to push some buttons in addition to all the jawboning…

Btw… wouldn’t it be a shame if we didn’t reach up and kiss that trendline, even though the 200SMA is looming overhead?

3 Likes

I’m back with my autistic trading

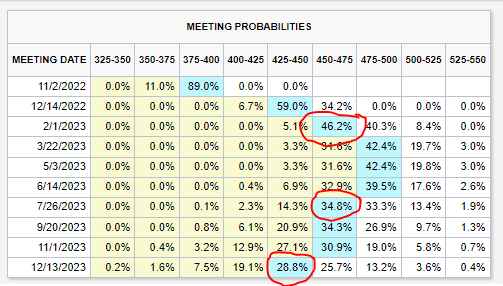
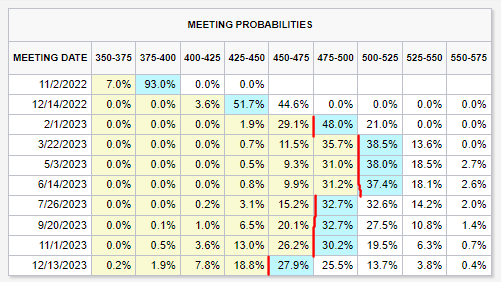
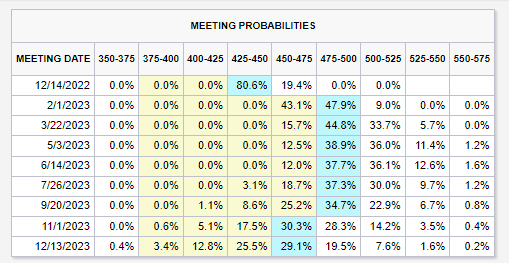
TLDR: I expect us to go to around the 405-410 area before having a good dip or the next leg lower because I think the market is rallying based off Fed pivot predictions, but the Fed isn’t pivoting, they’re just slowing rates but still raising rates. Plus we’re setting up bearish divergences and overextensions.

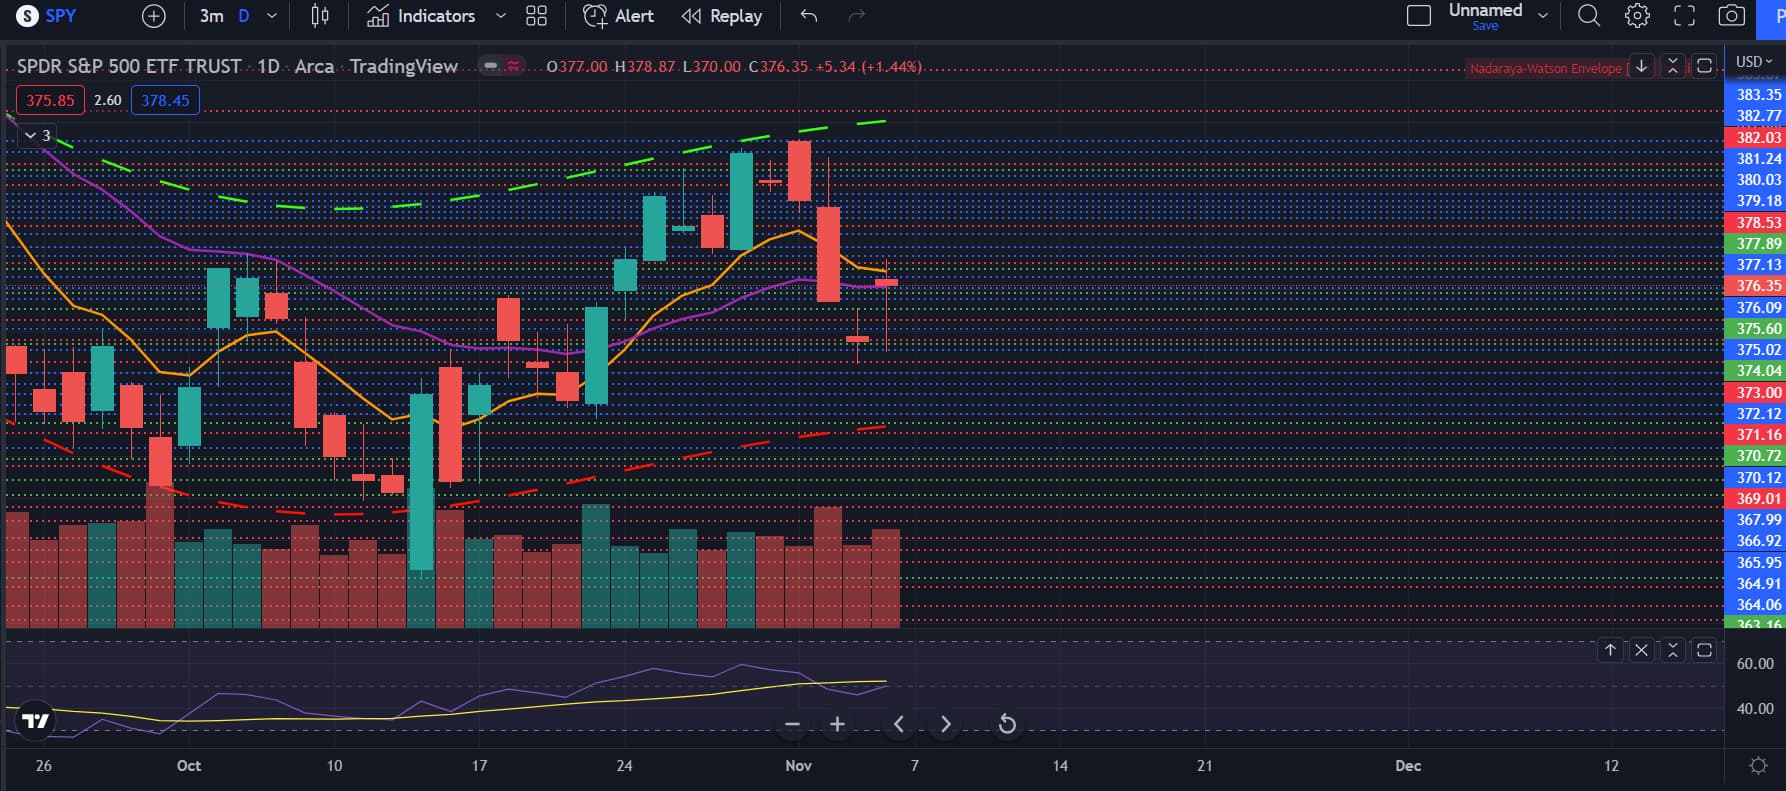
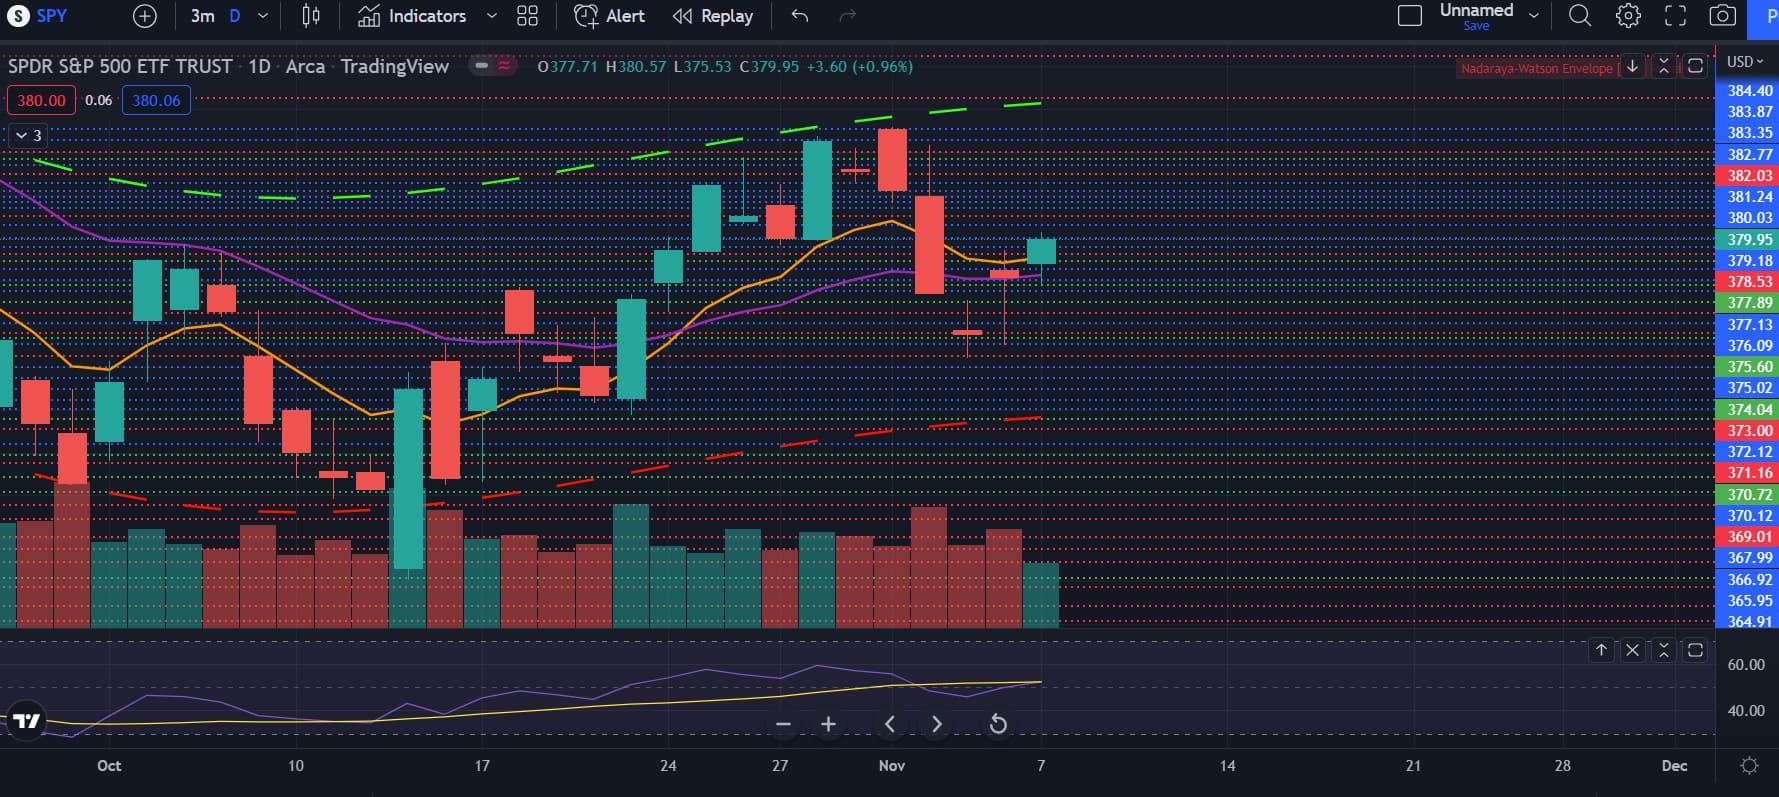
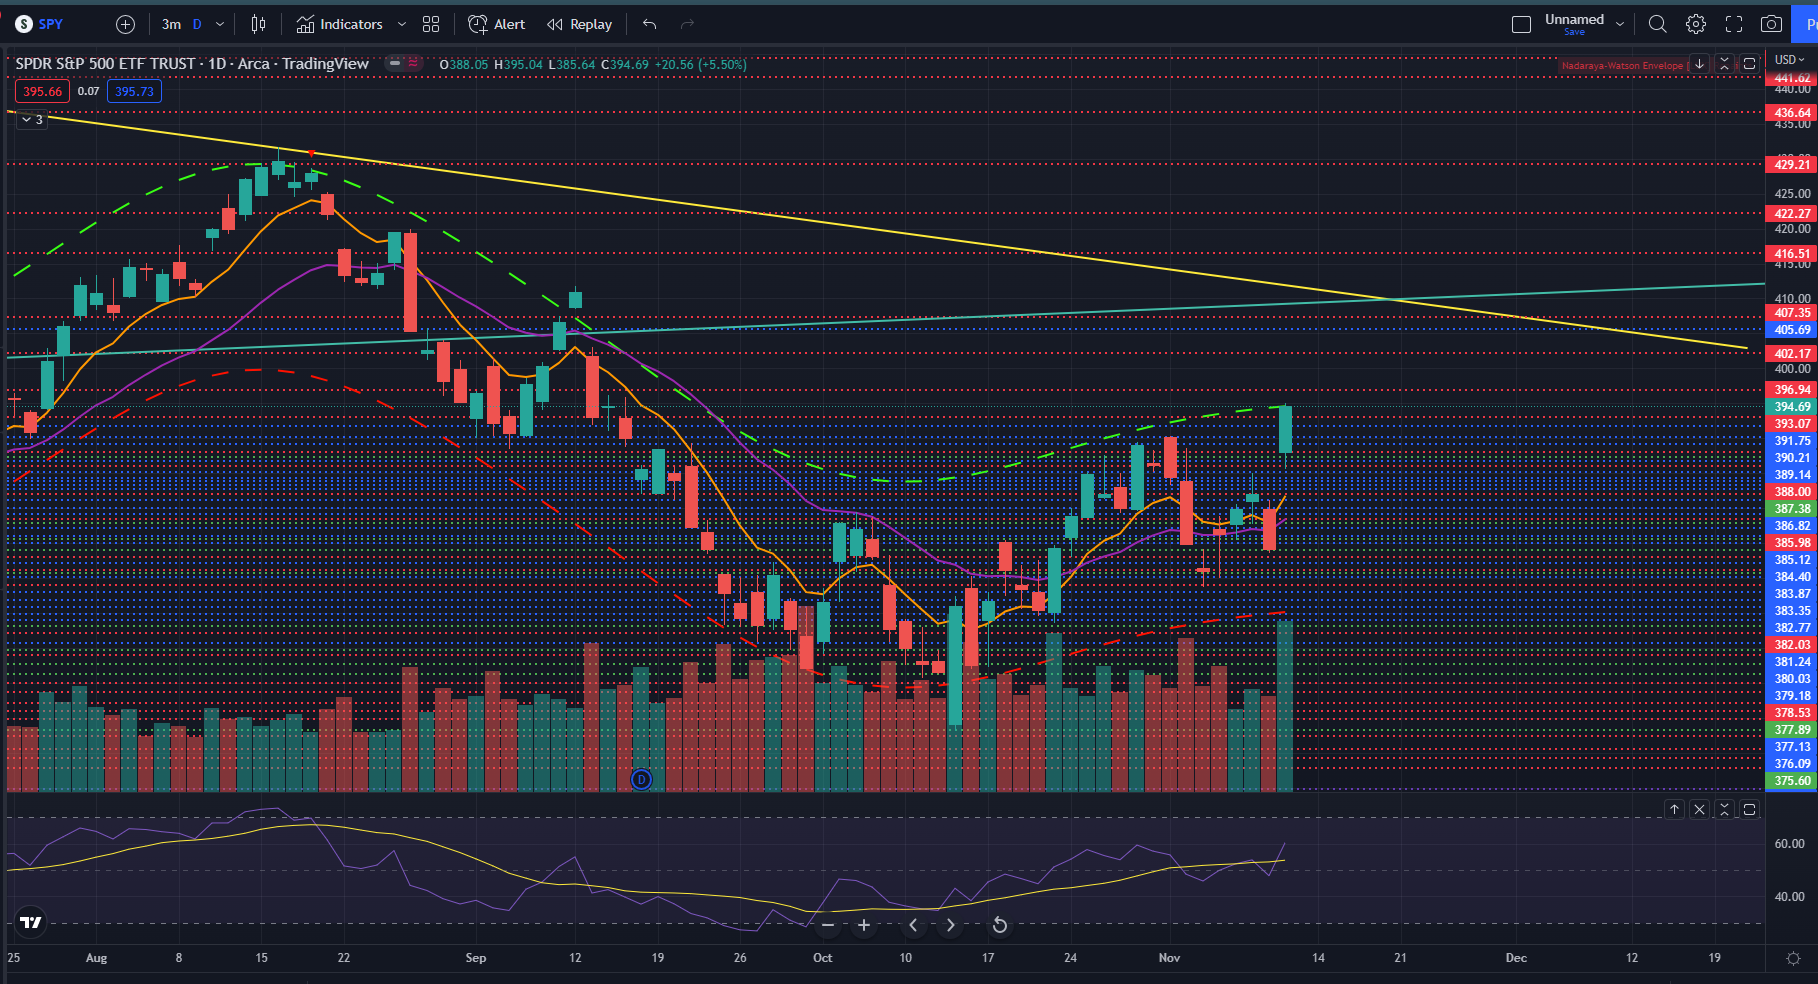
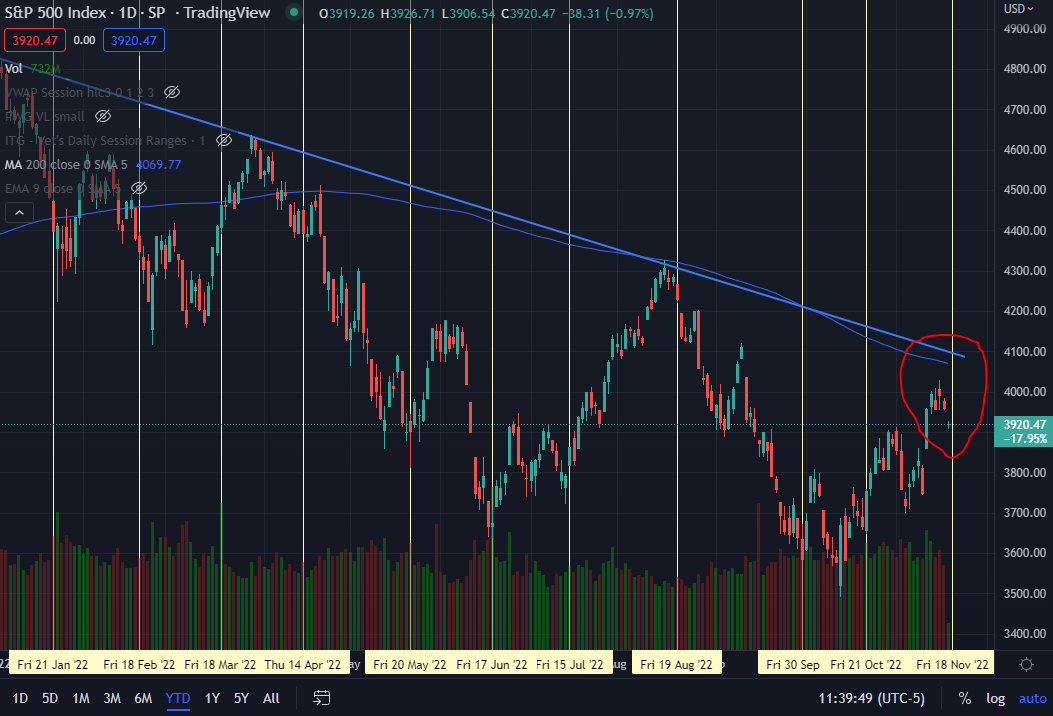
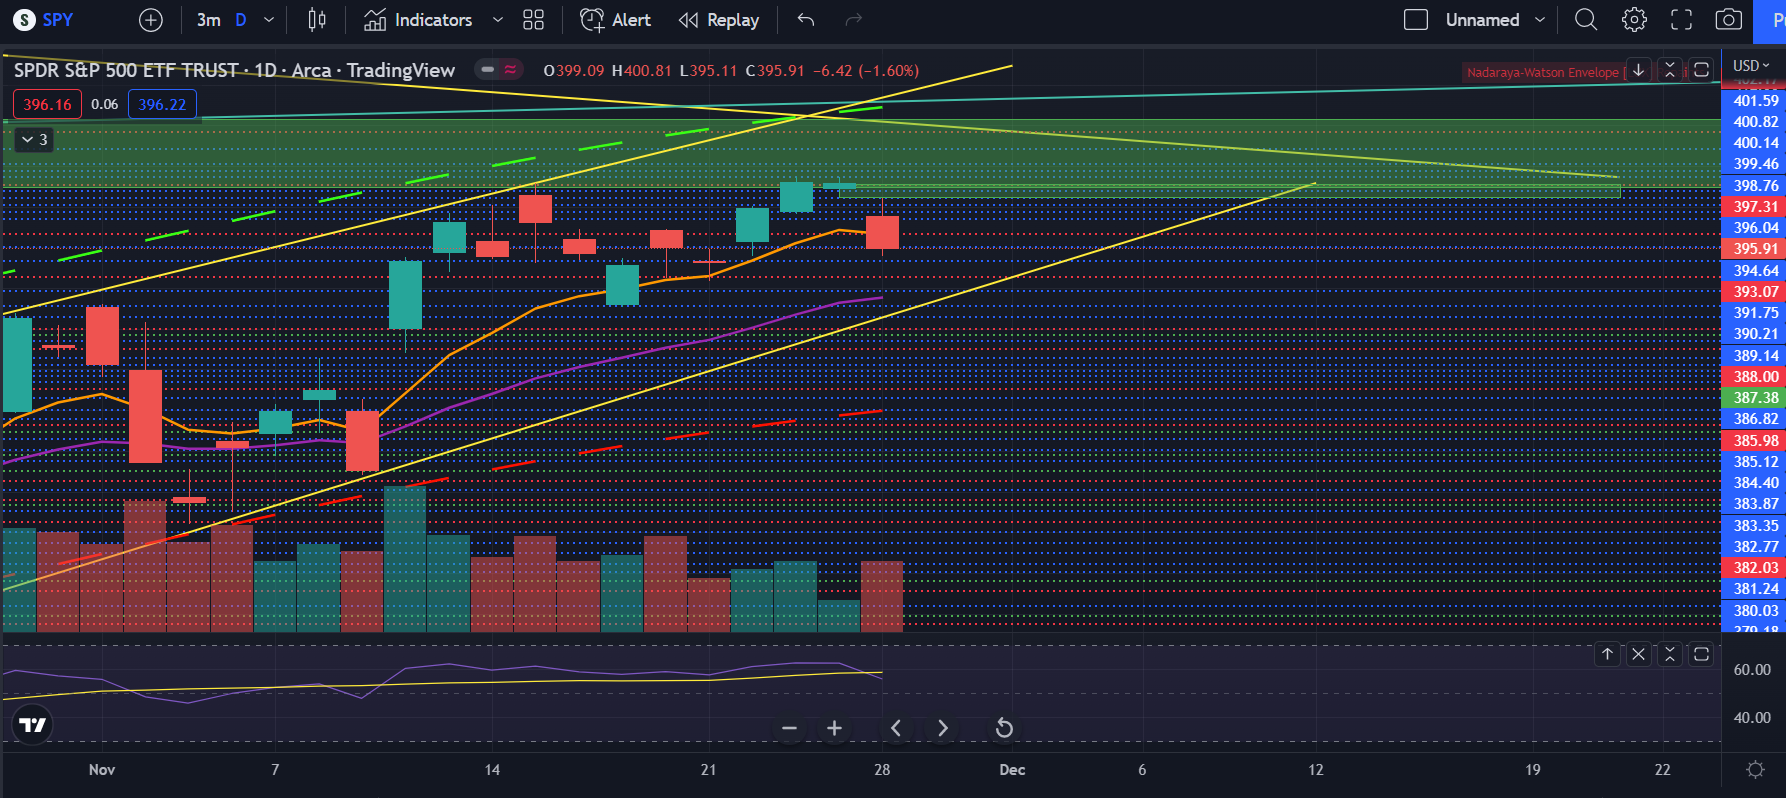
Looking at the SPY daily, we’re in a strong uptrend and bouncing off the 8 EMA. Volume has ben very low and trending up on low volume. Makes sense since this has been a holiday week, but because of the low volume, this doesn’t really convince me that this rally will continue on much longer. Also on the daily, we’re nearing the 200 MA and the major downtrend line this year. There is going to be lots of shorters there and bears looking to bring this shit back down. This is going to be a big inflection point to see whether we continue up or if we take a shitter back down. If we do break past the 200 MA and the downtrend line, I would have to imagine that technicals wouldn’t matter anymore and we’ll have a huge short squeeze to 440 at least. Tbh I don’t think that’ll happen, but we’ll see

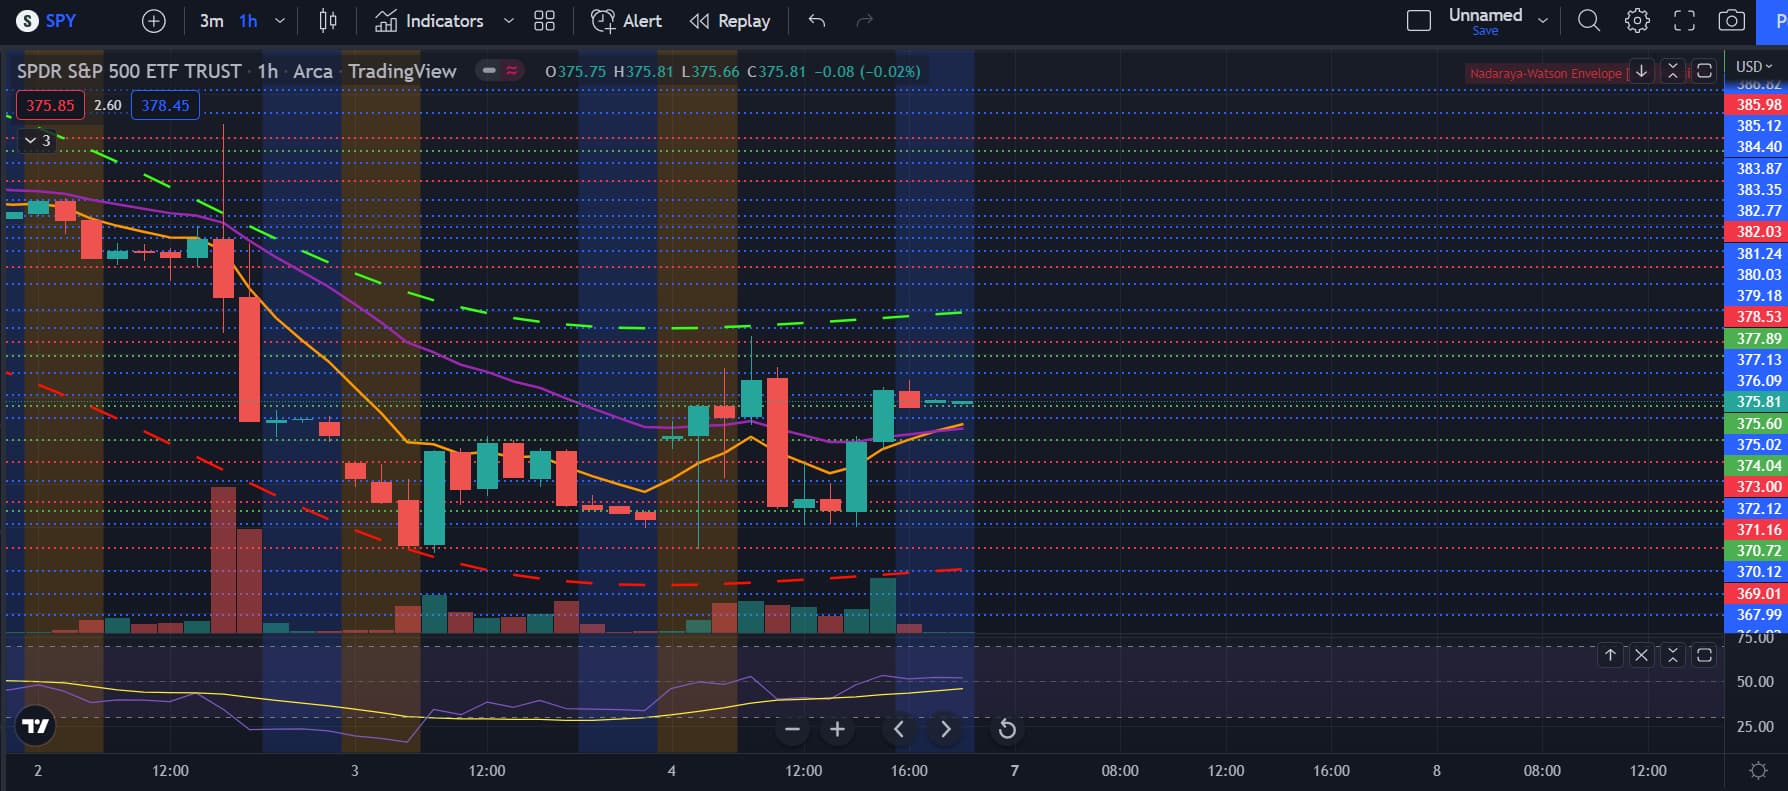
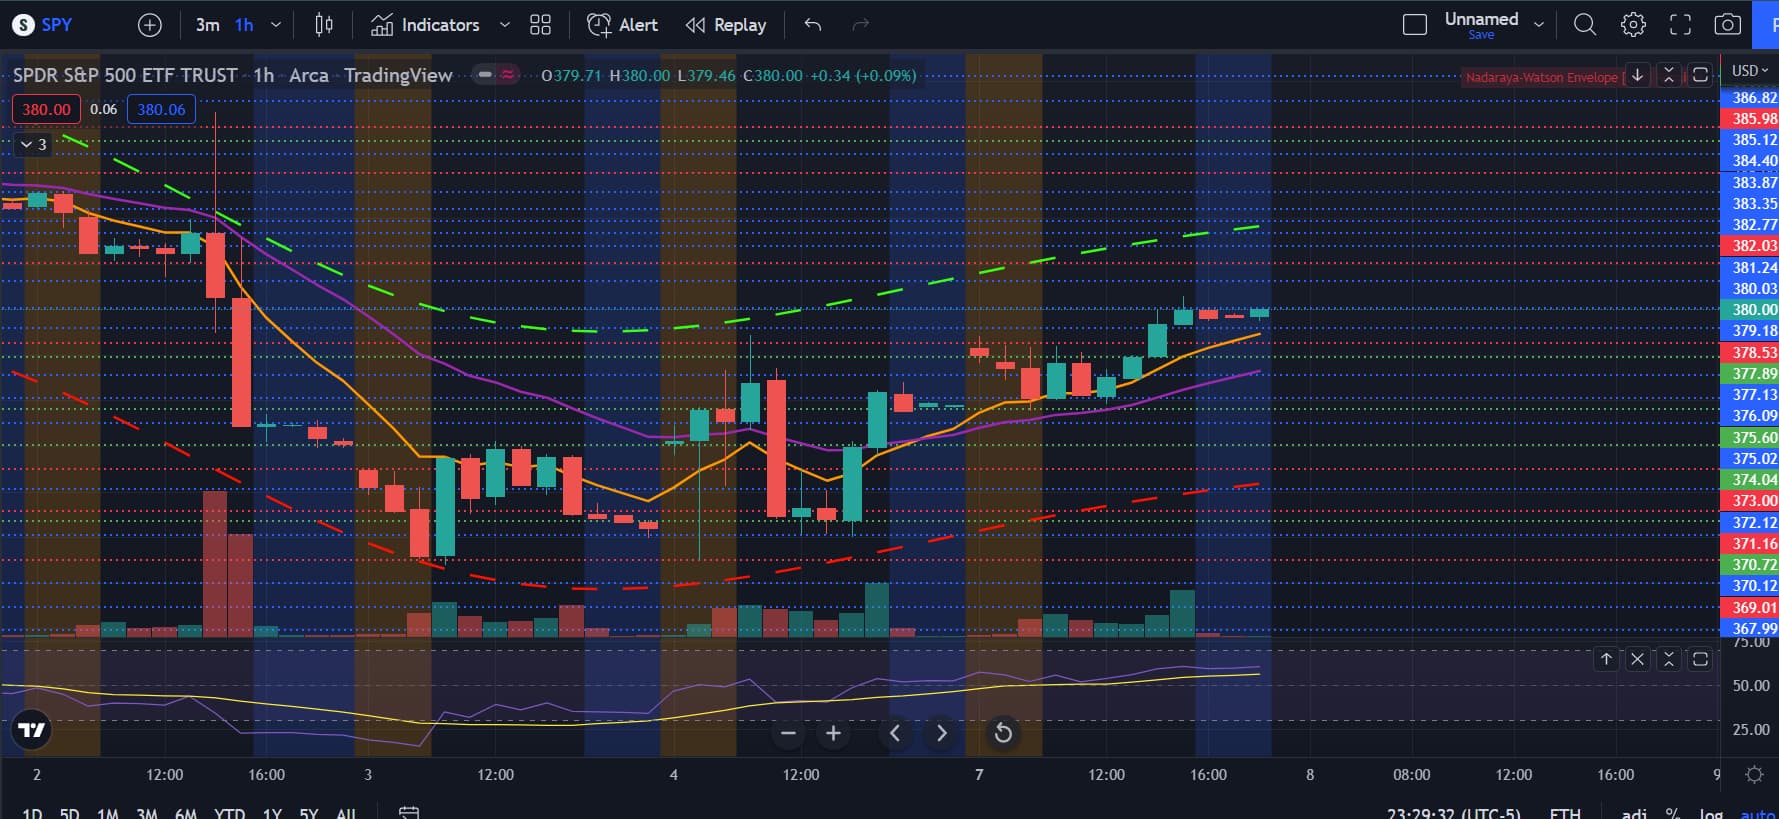
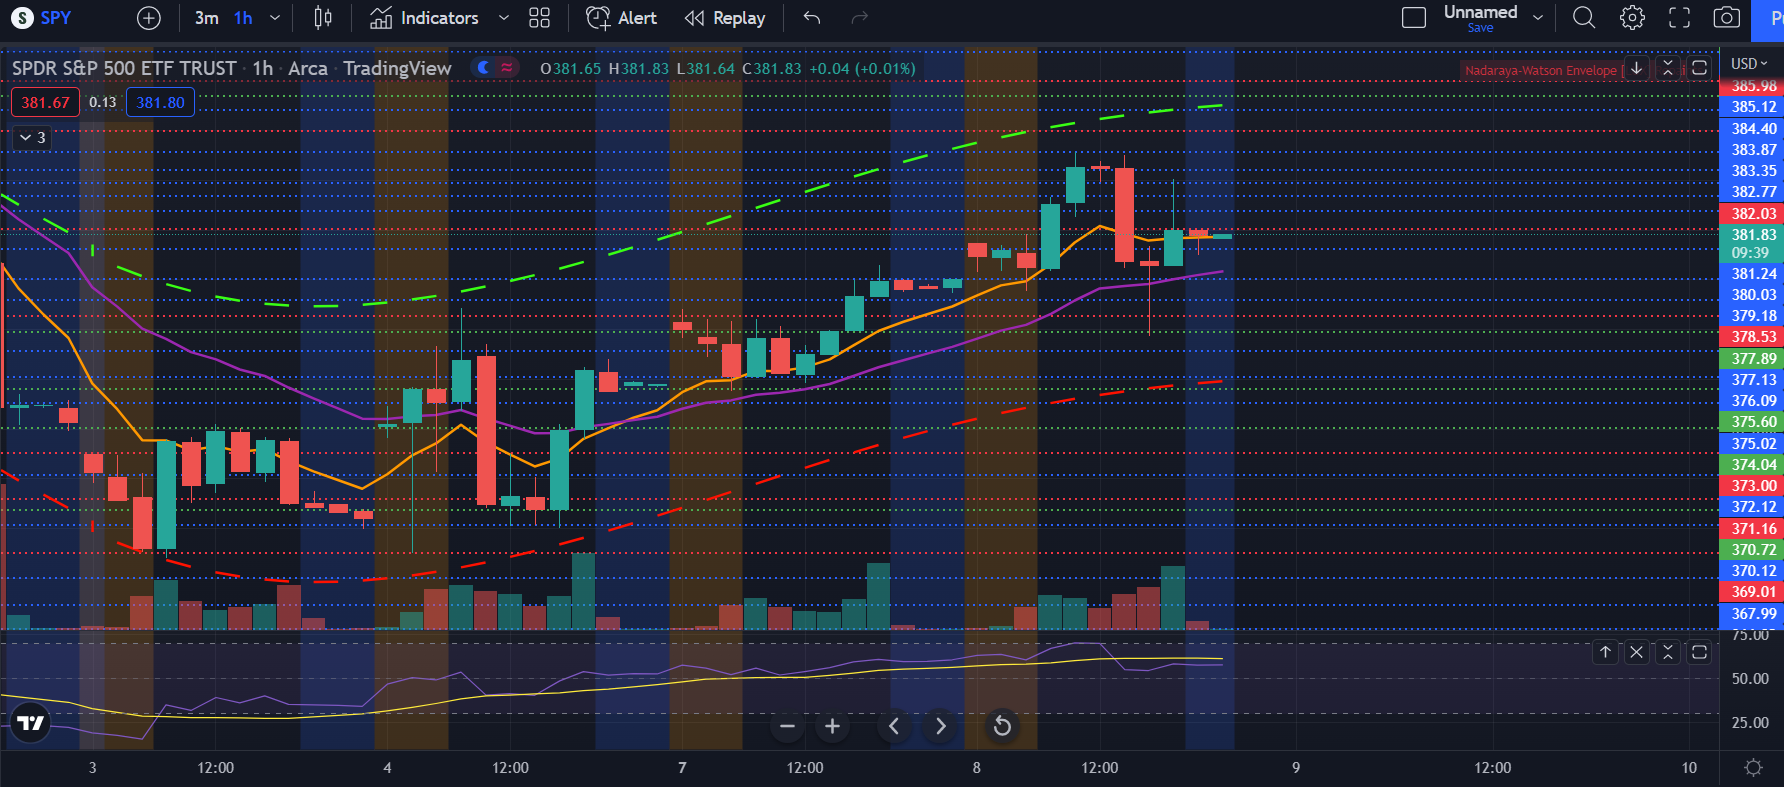
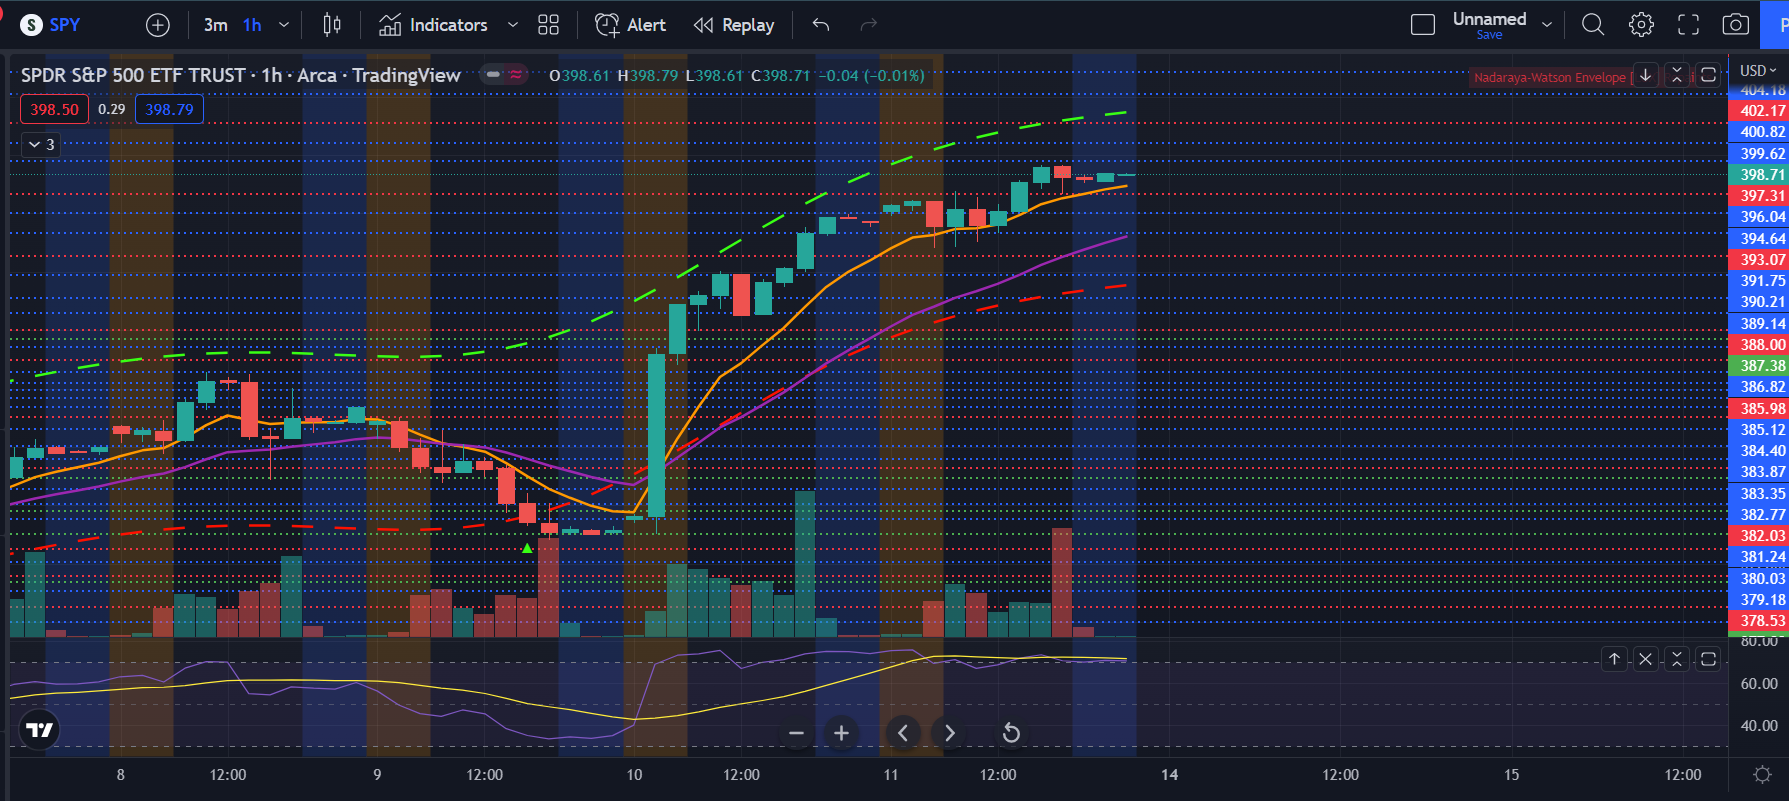
Now on the hourly, we’re forming a bearish divergence and in the overextended range on the RSI. We’re still bouncing off of the 8/21 EMAs and climbing up. I think that we’ll at most have a little dump to the 21 or 8 EMA again and then try to hit the 405-410 level which is the 200 MA and the downtrend line. I’m bullish for Friday, but leaning bearish for the weeks ahead.

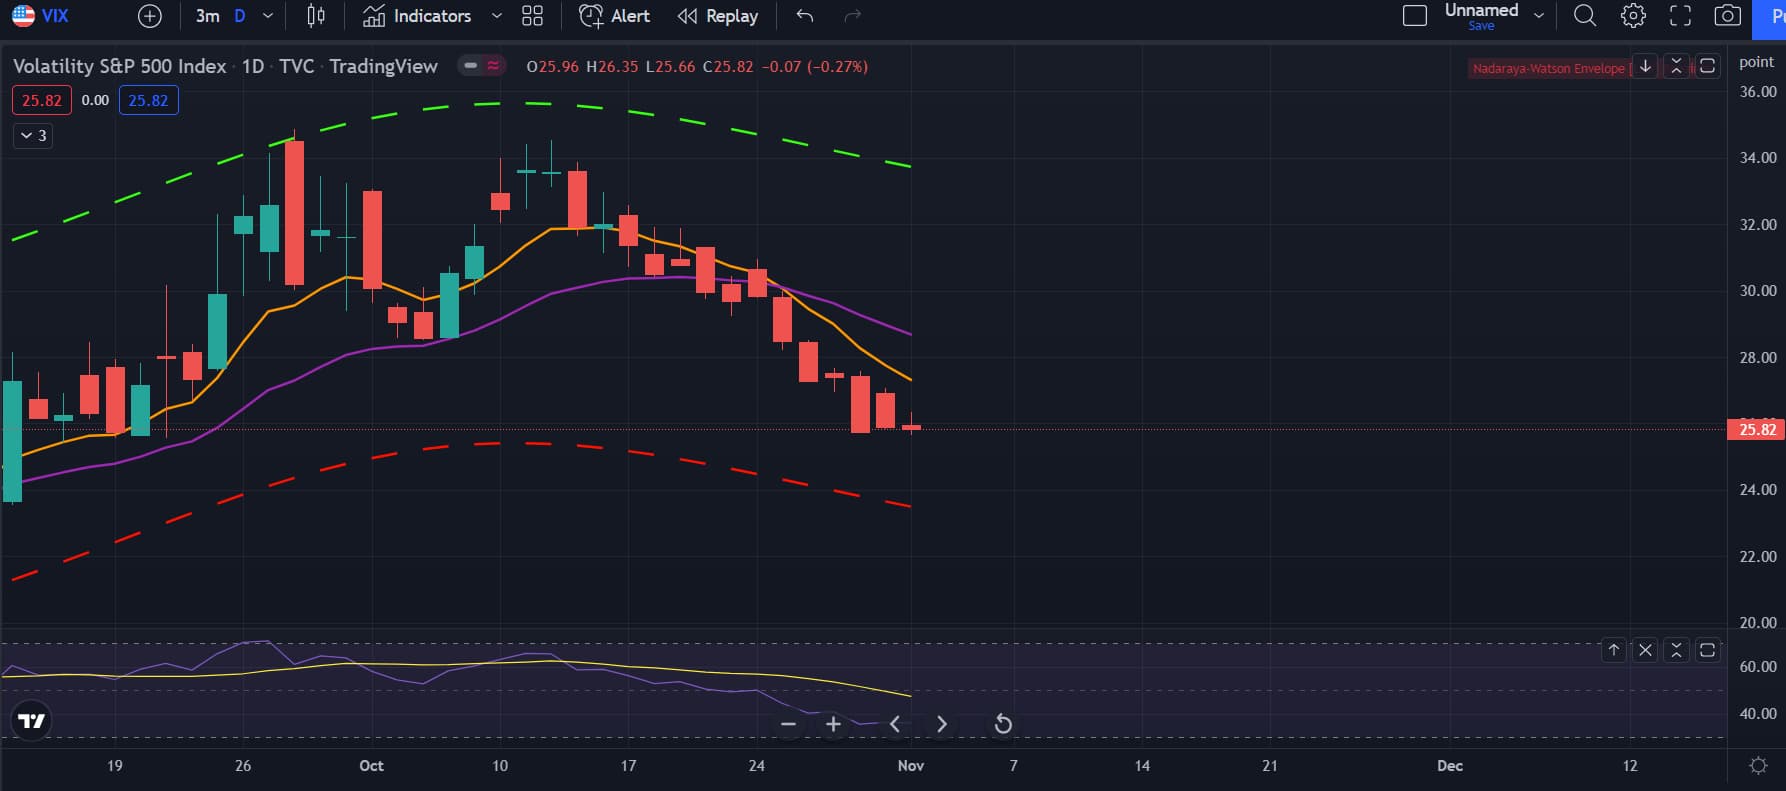
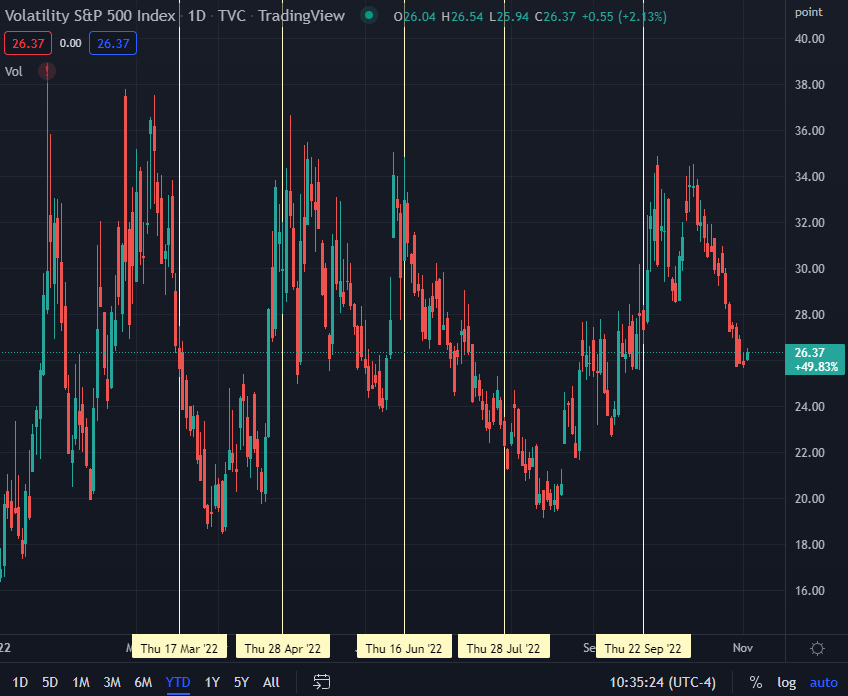
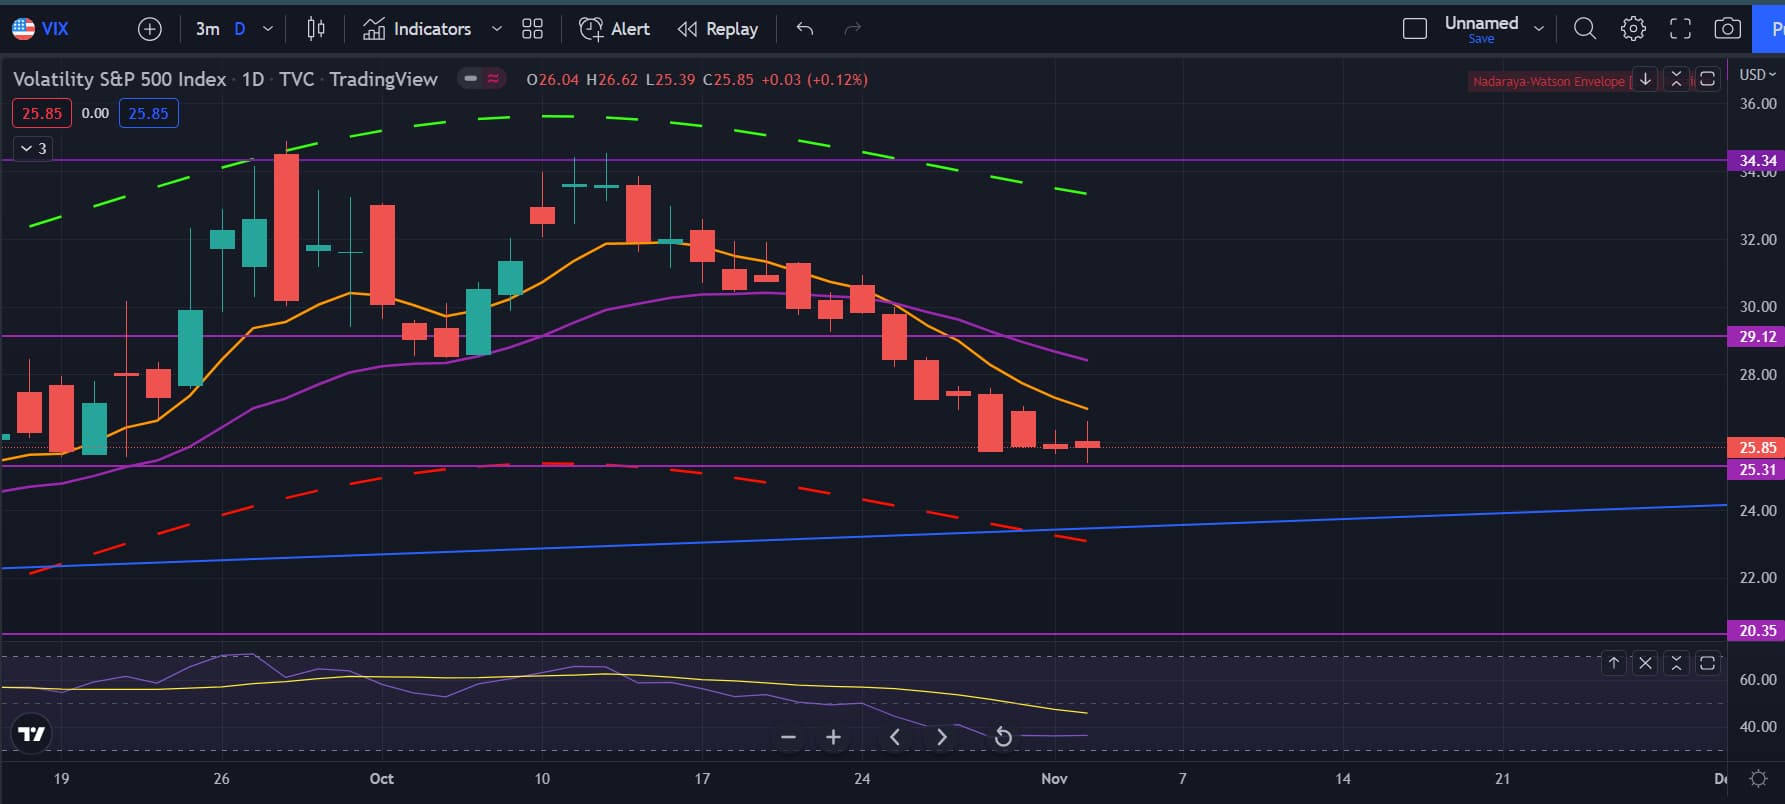
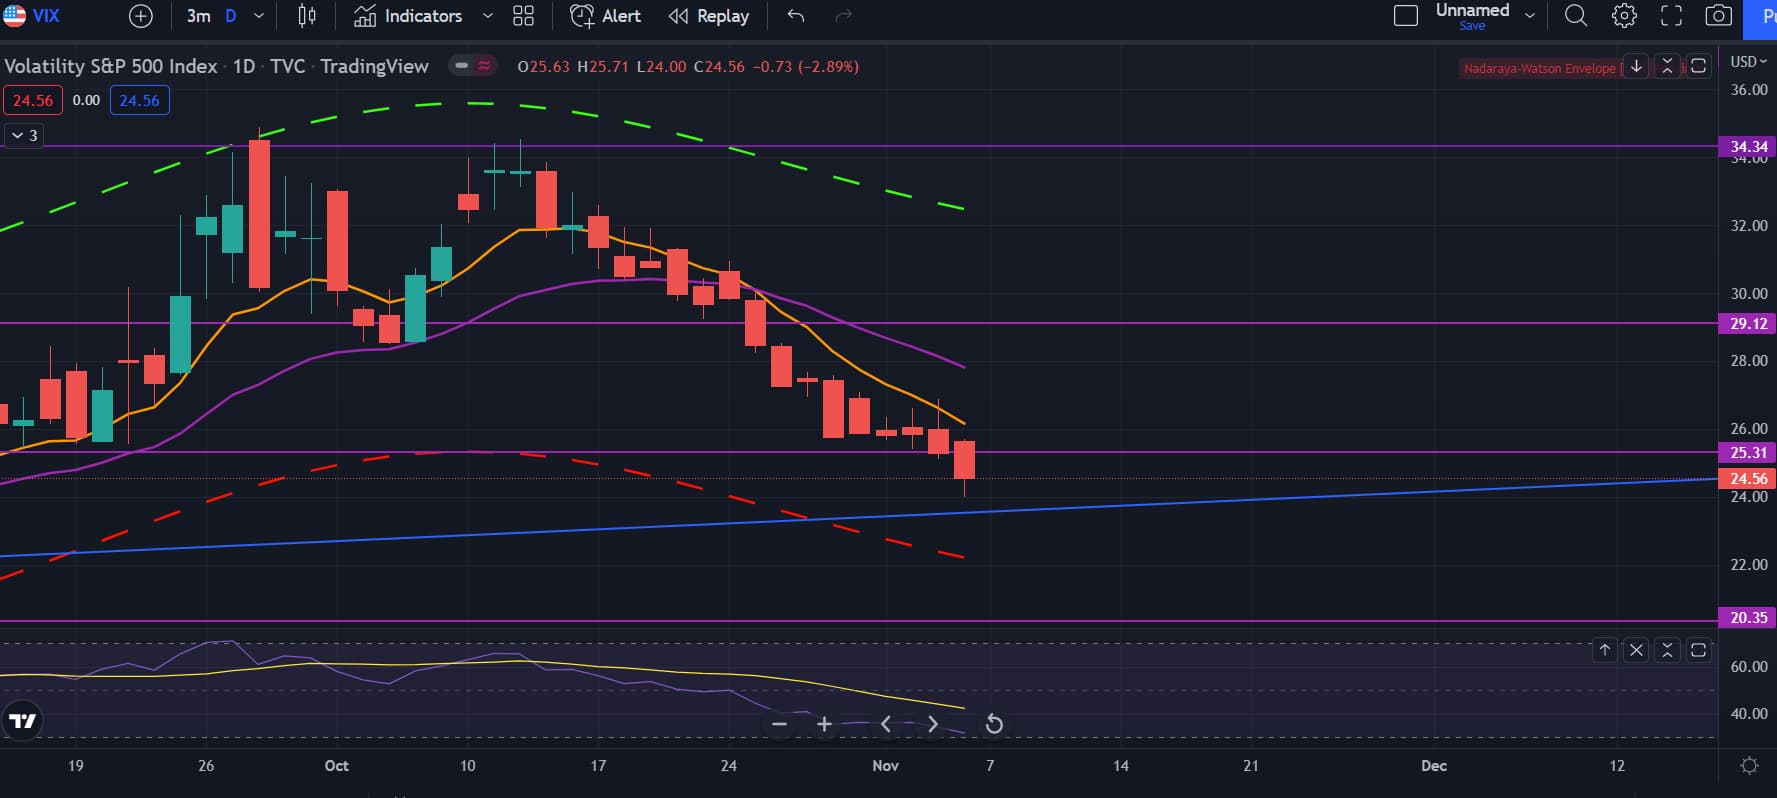
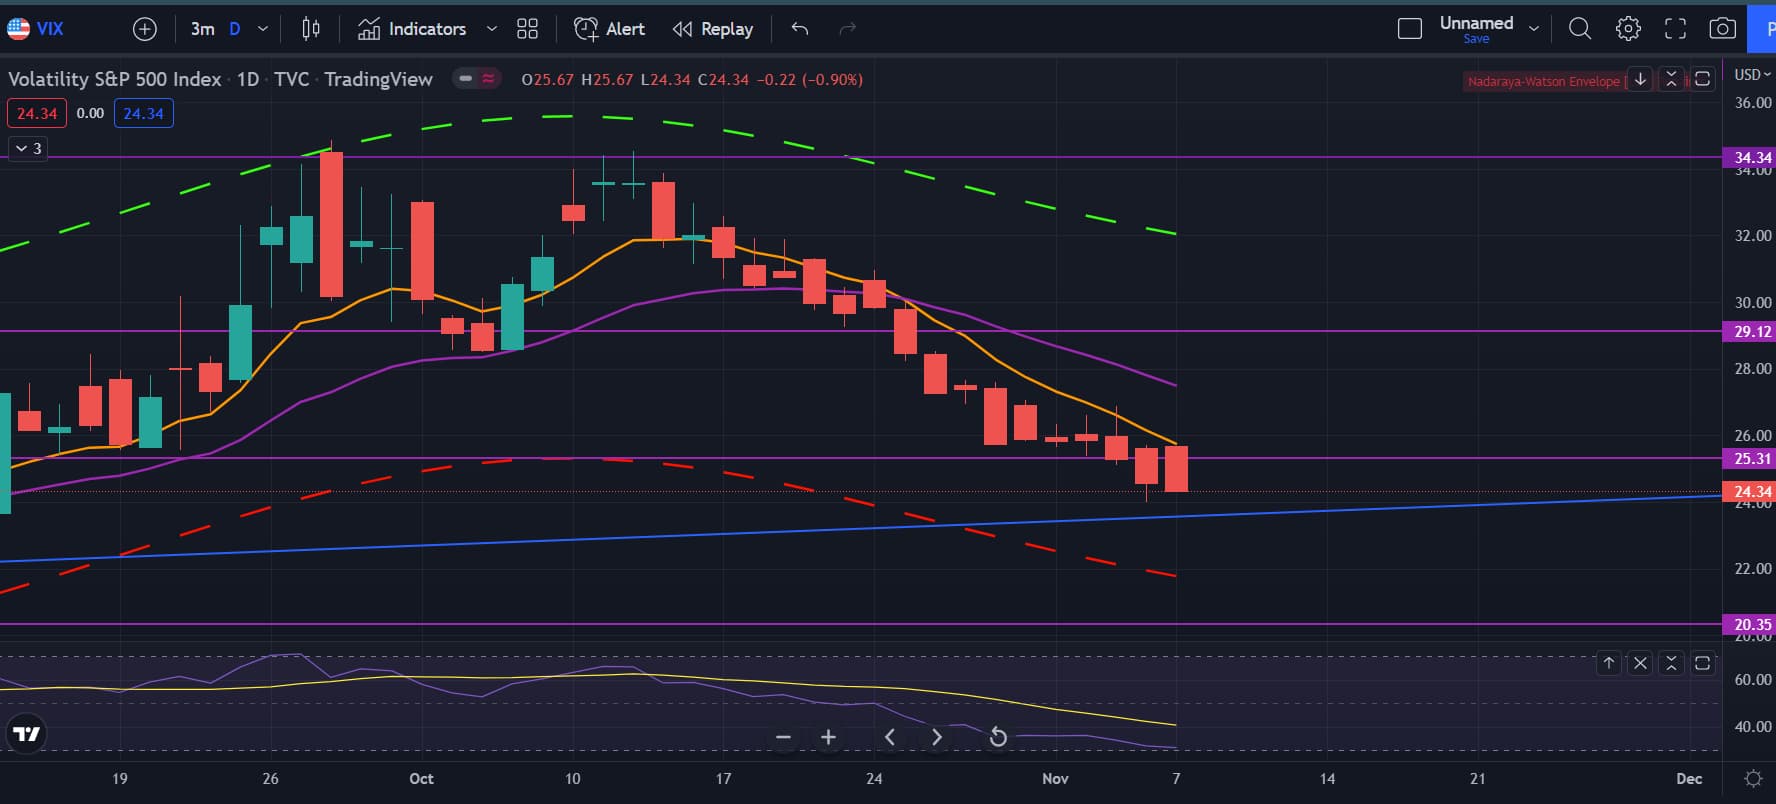
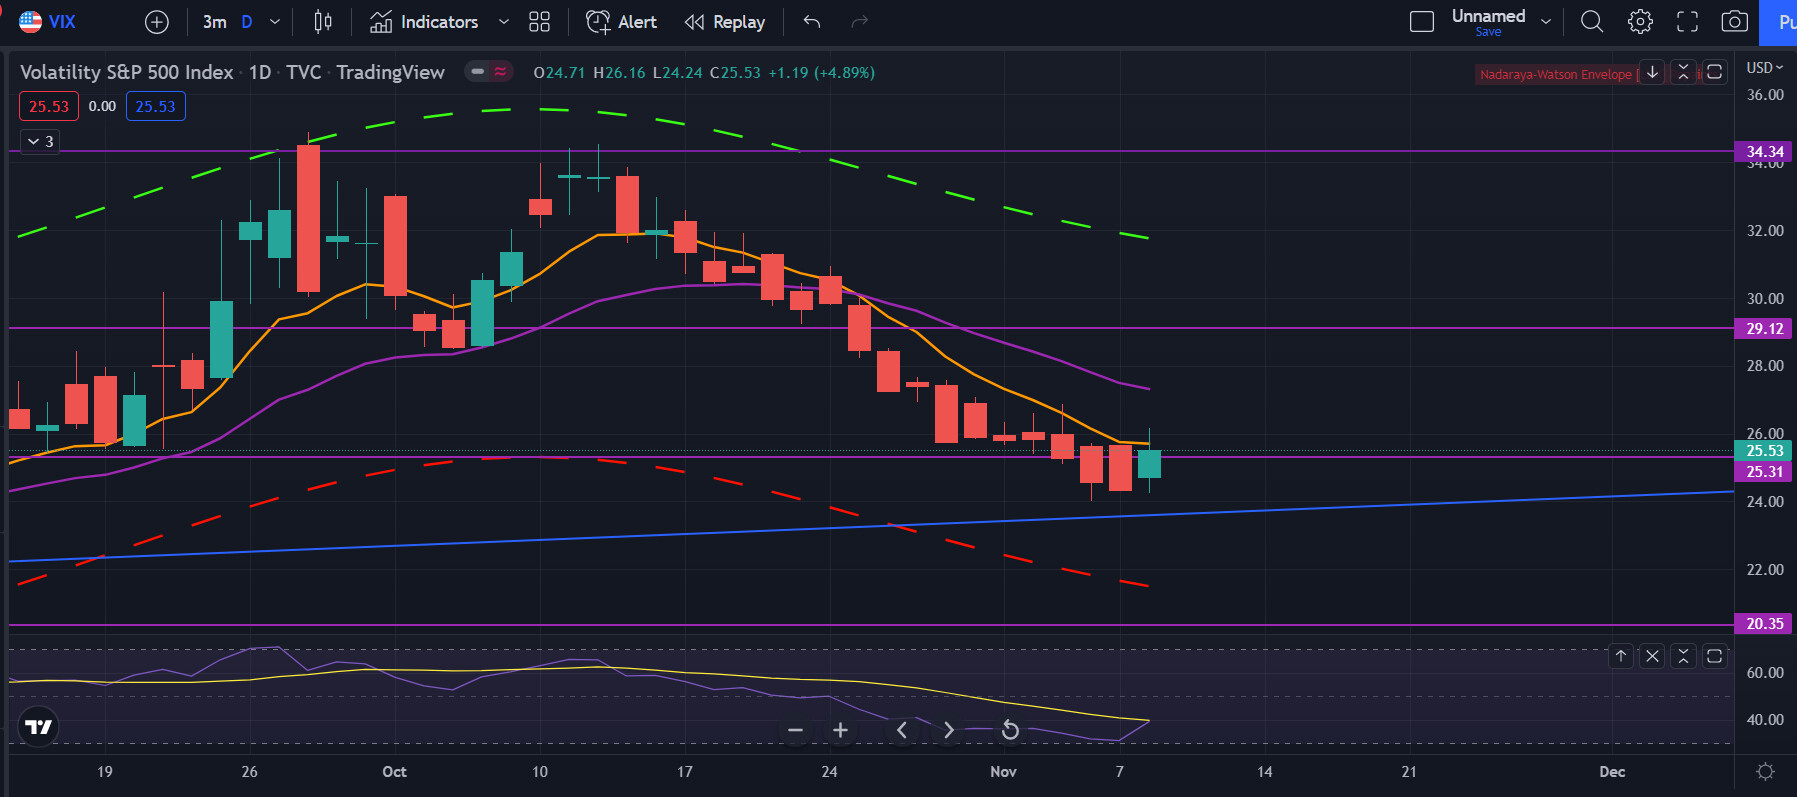
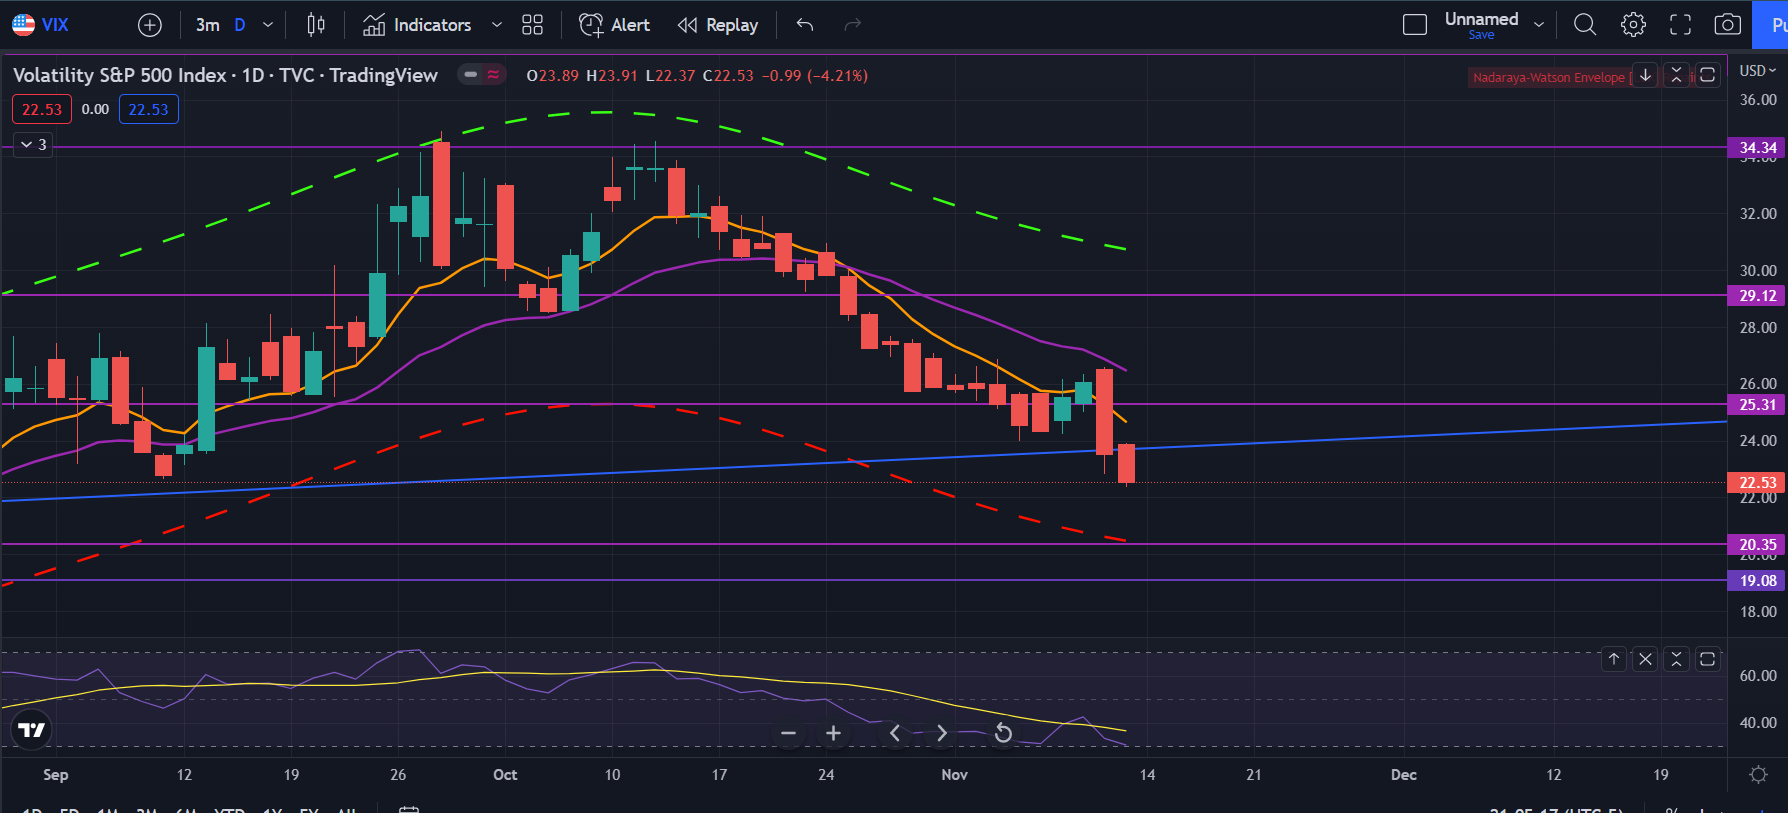
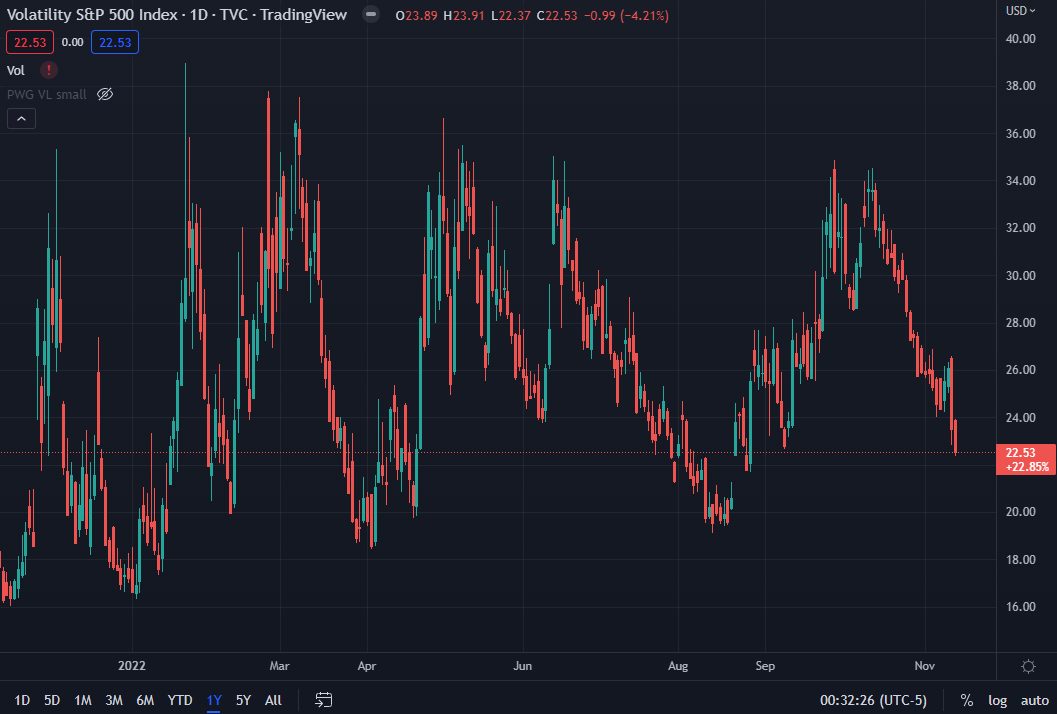
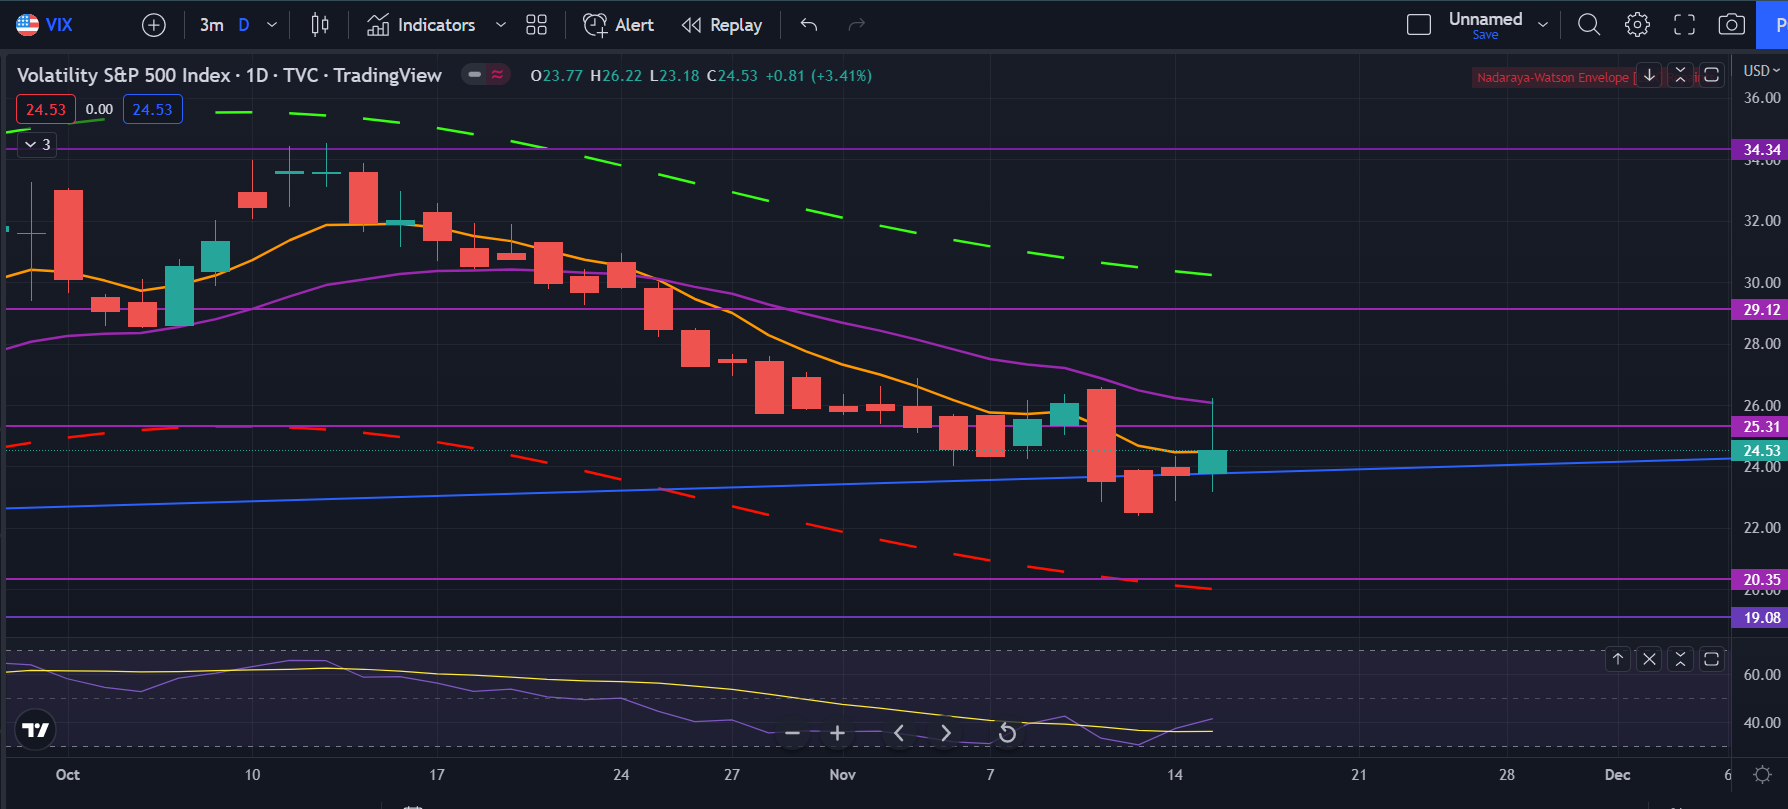
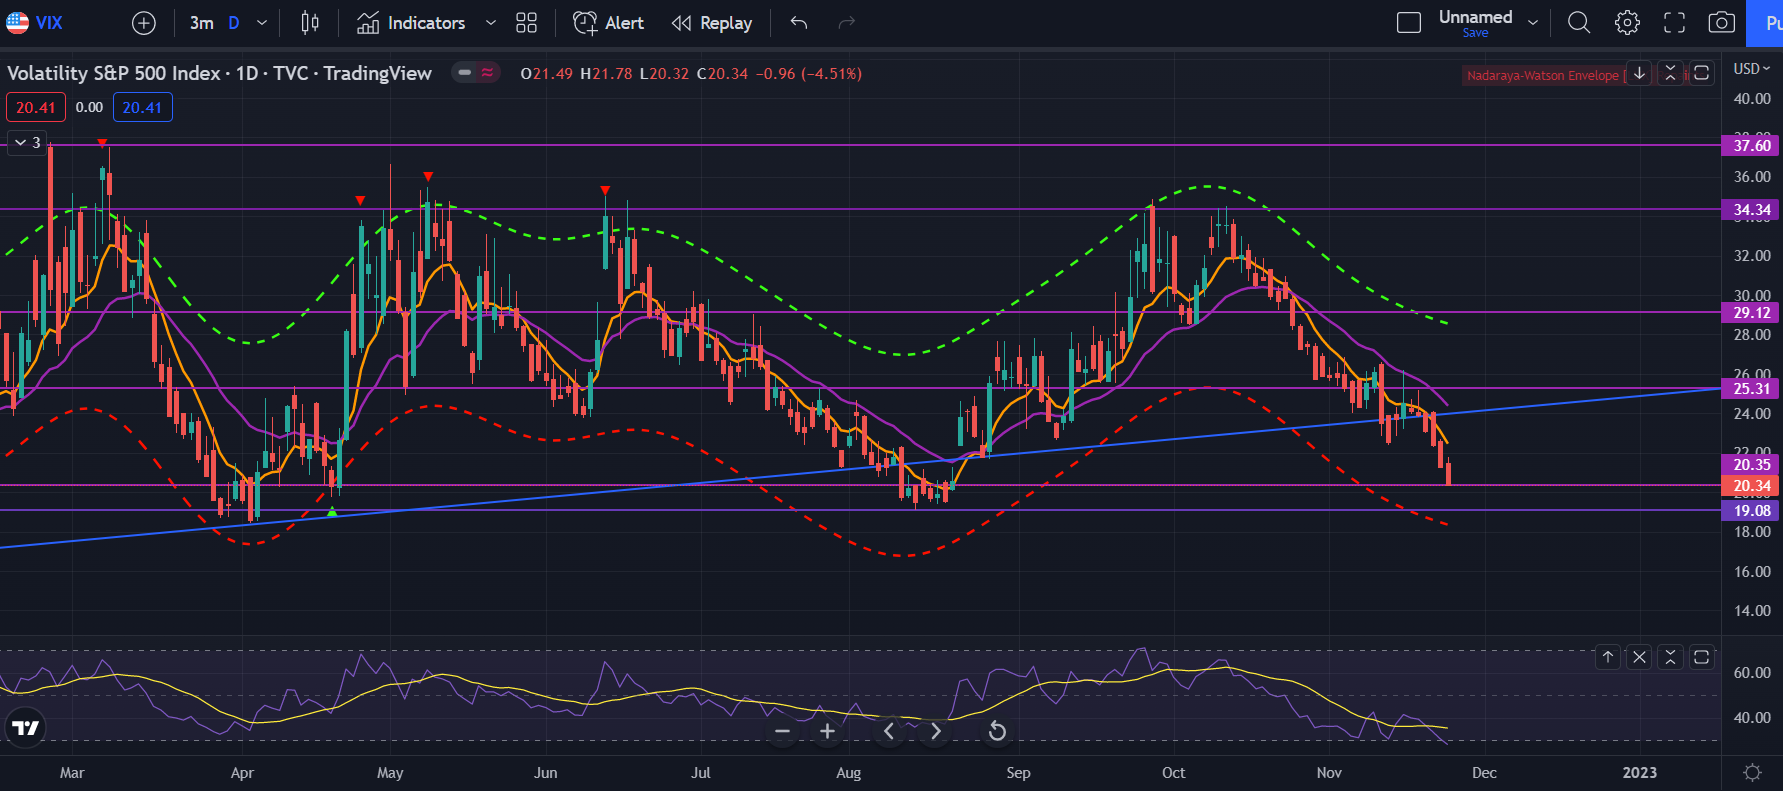
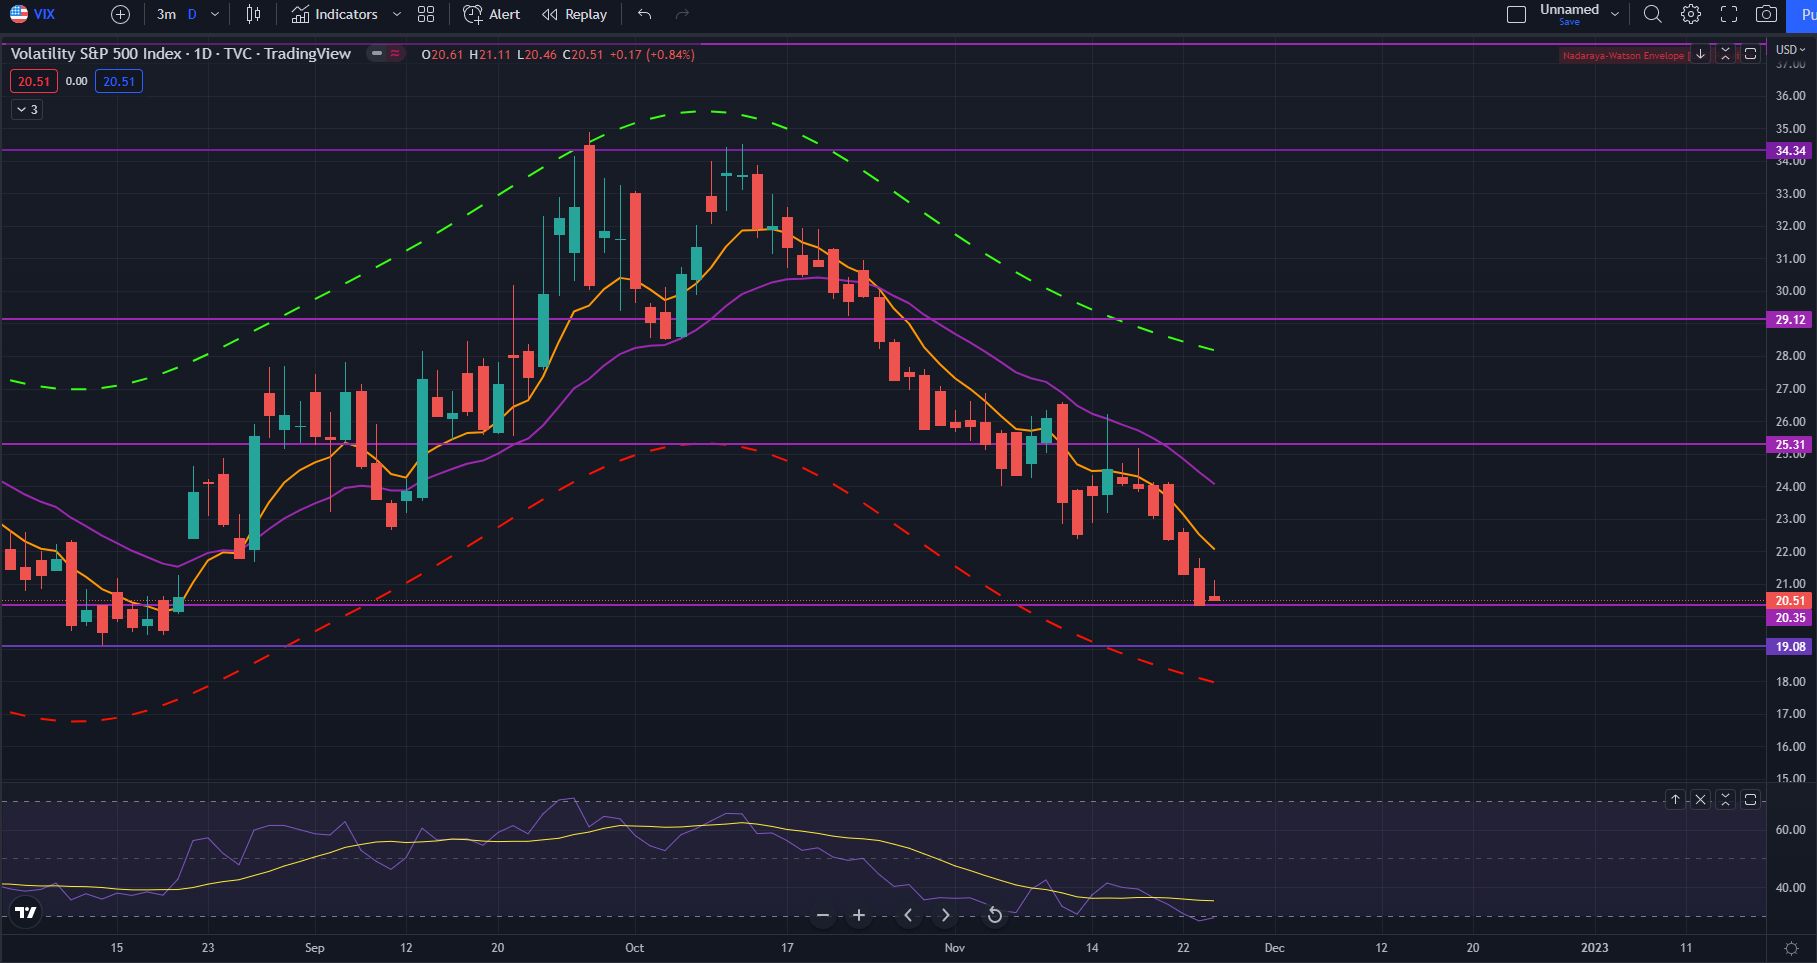
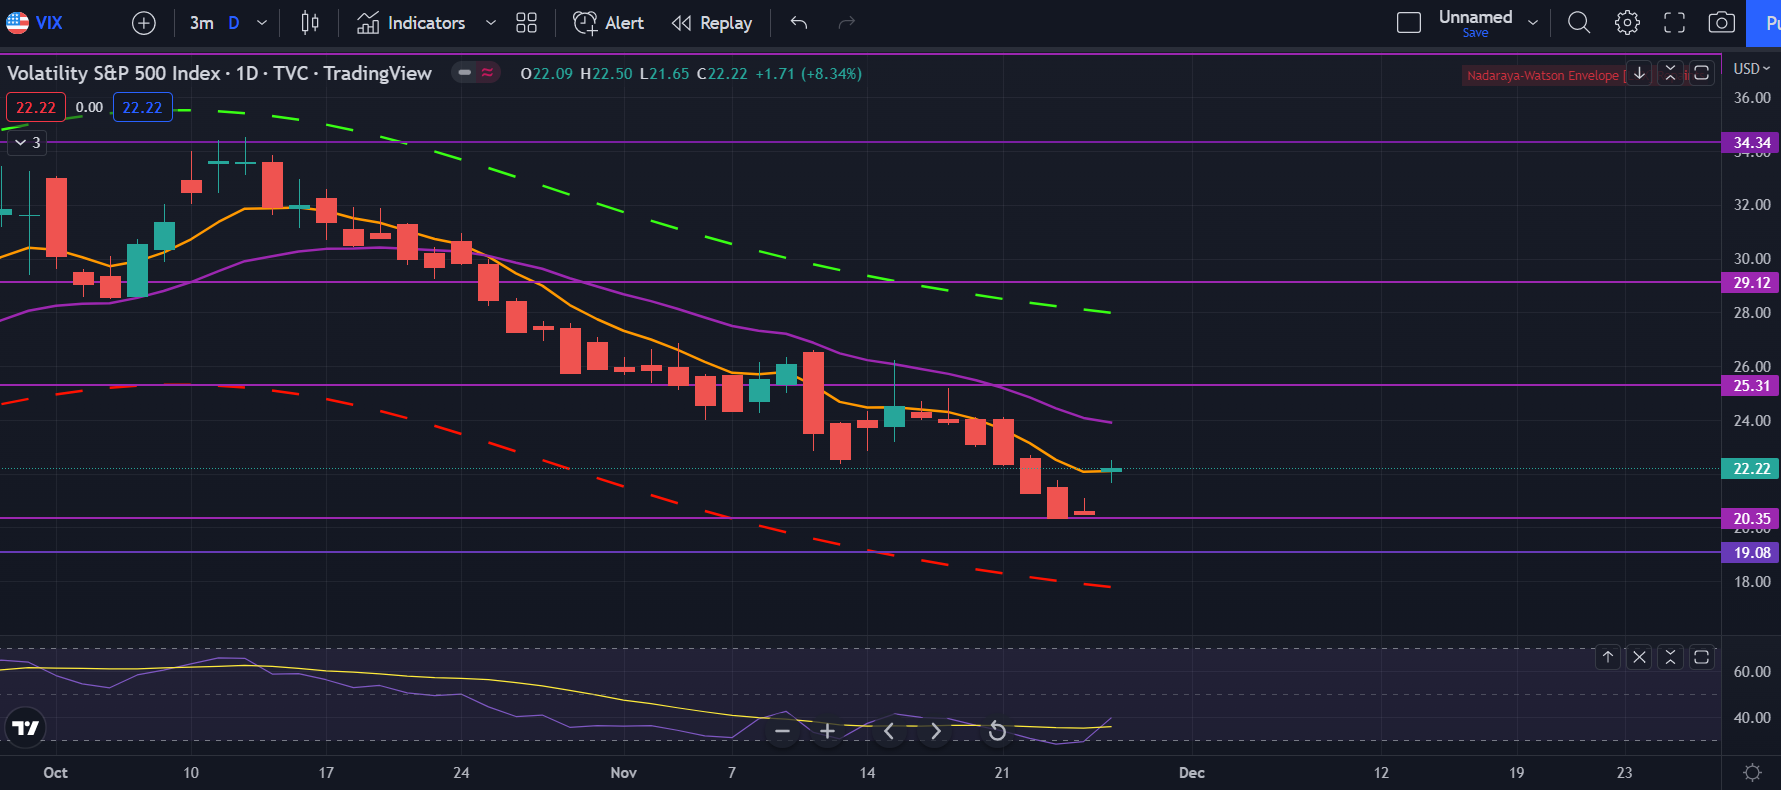
Looking at the VIX, we’re at the levels where markets typically top. Whether it’s just a pullback or the start of the next leg down, we don’t know, but VIX being at 19-20 is around when markets are starting to get overextended and due for a pullback.

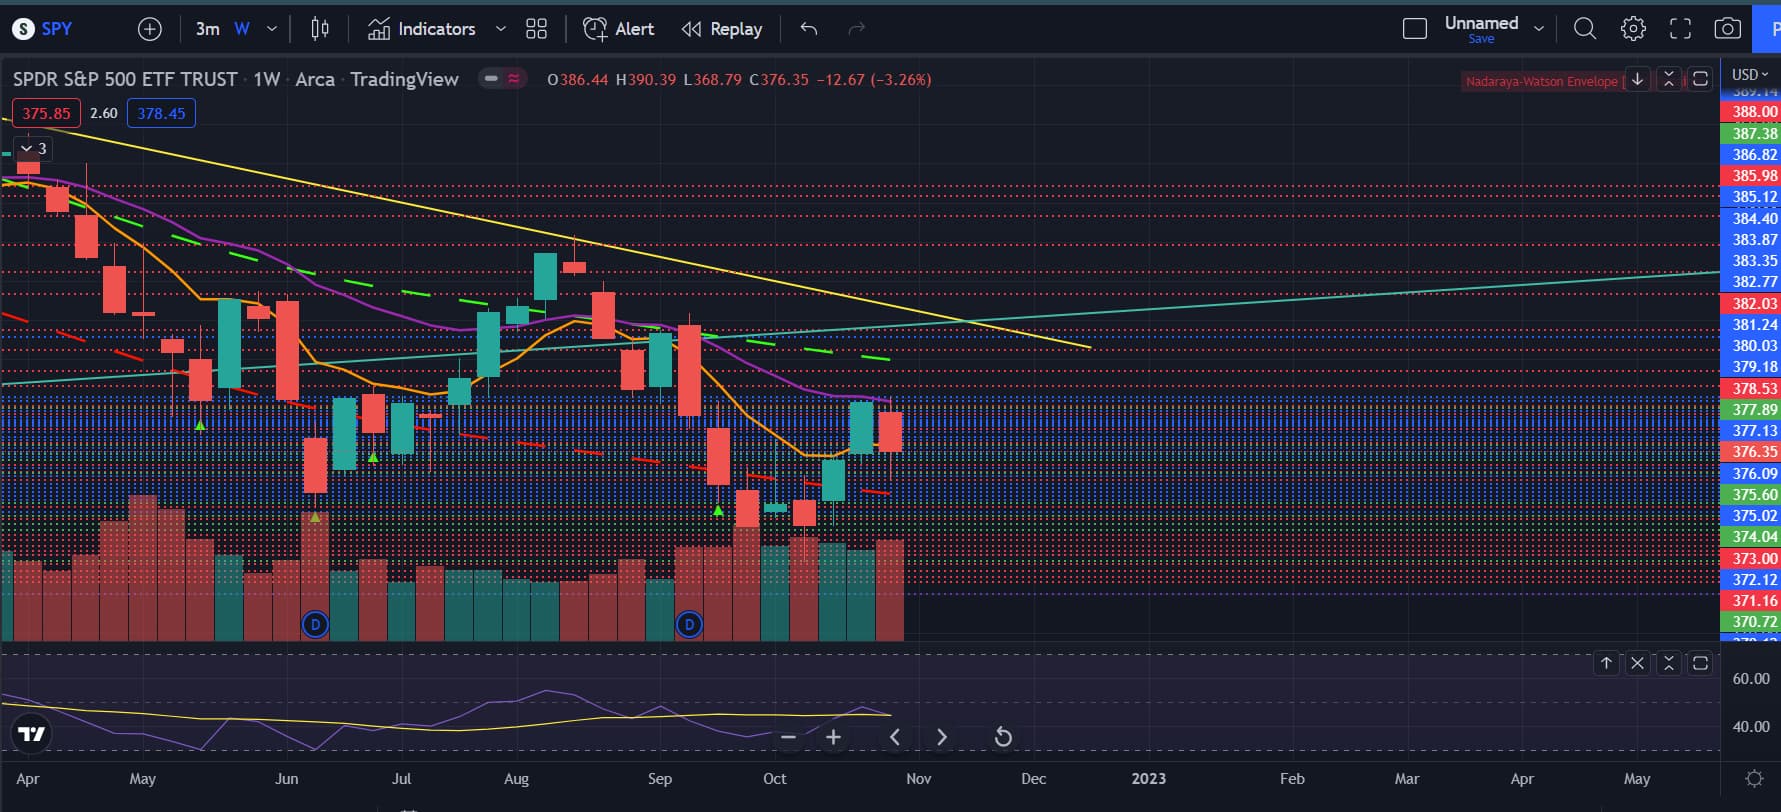
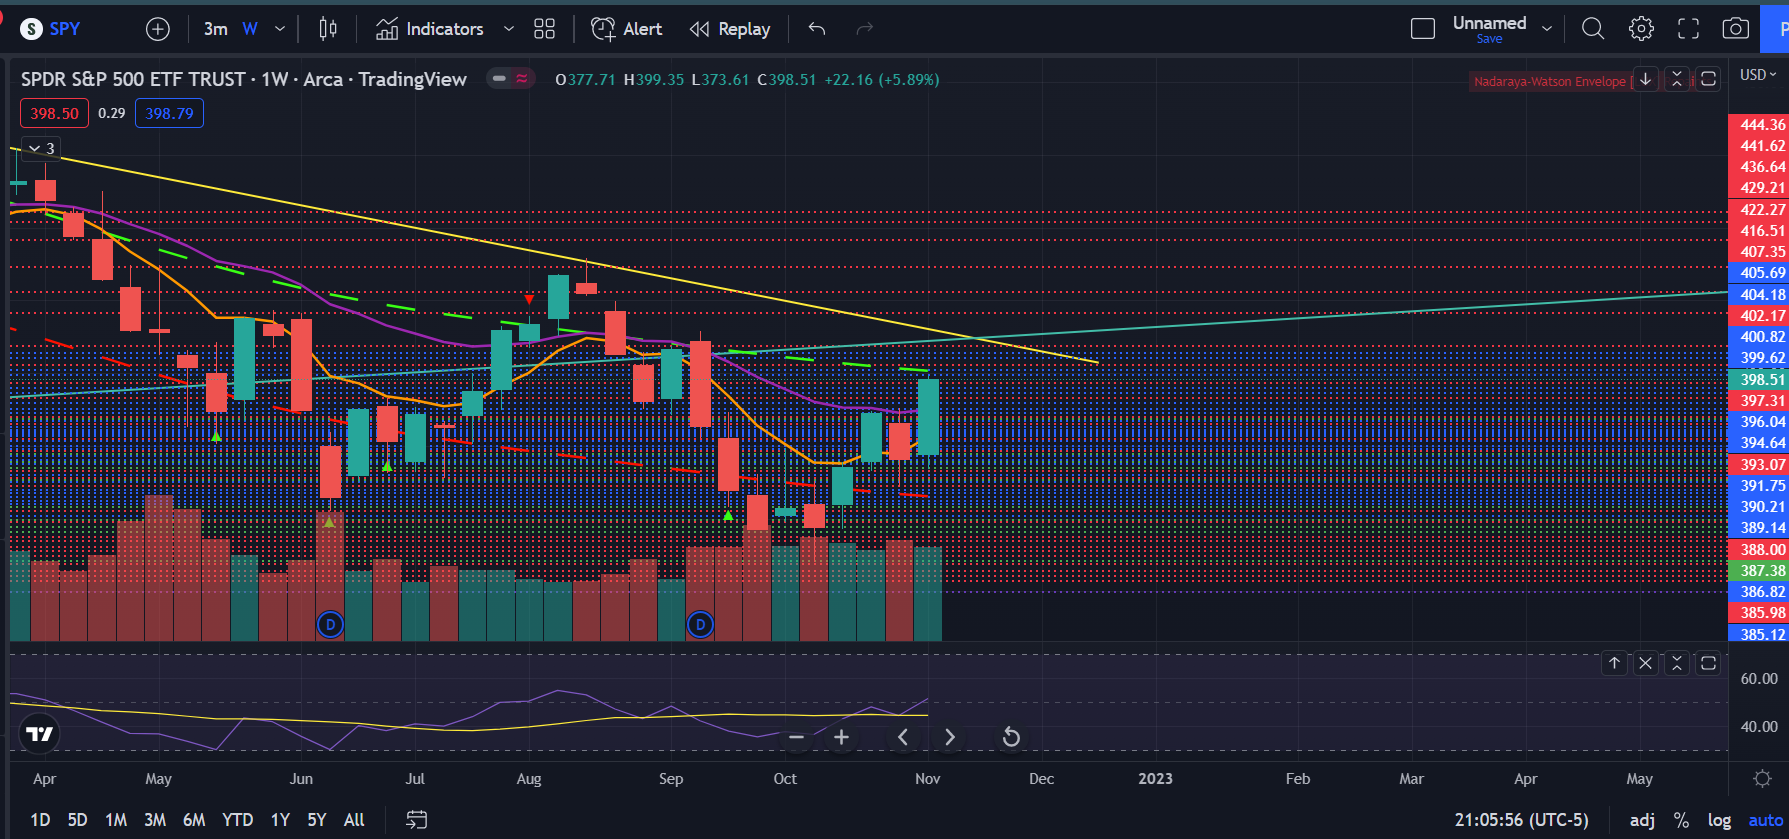
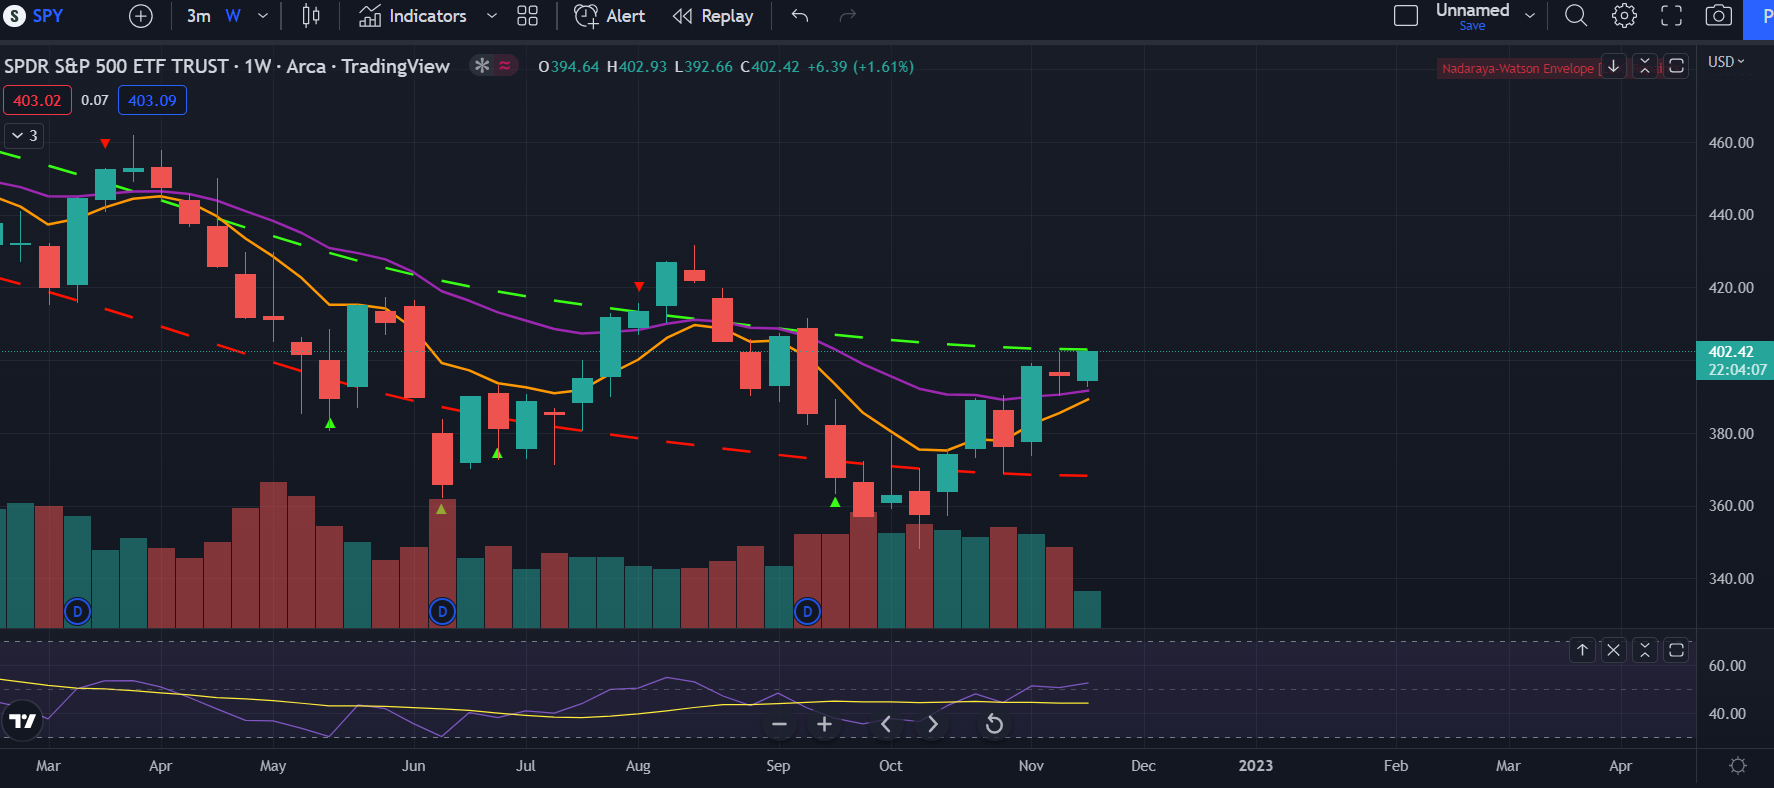
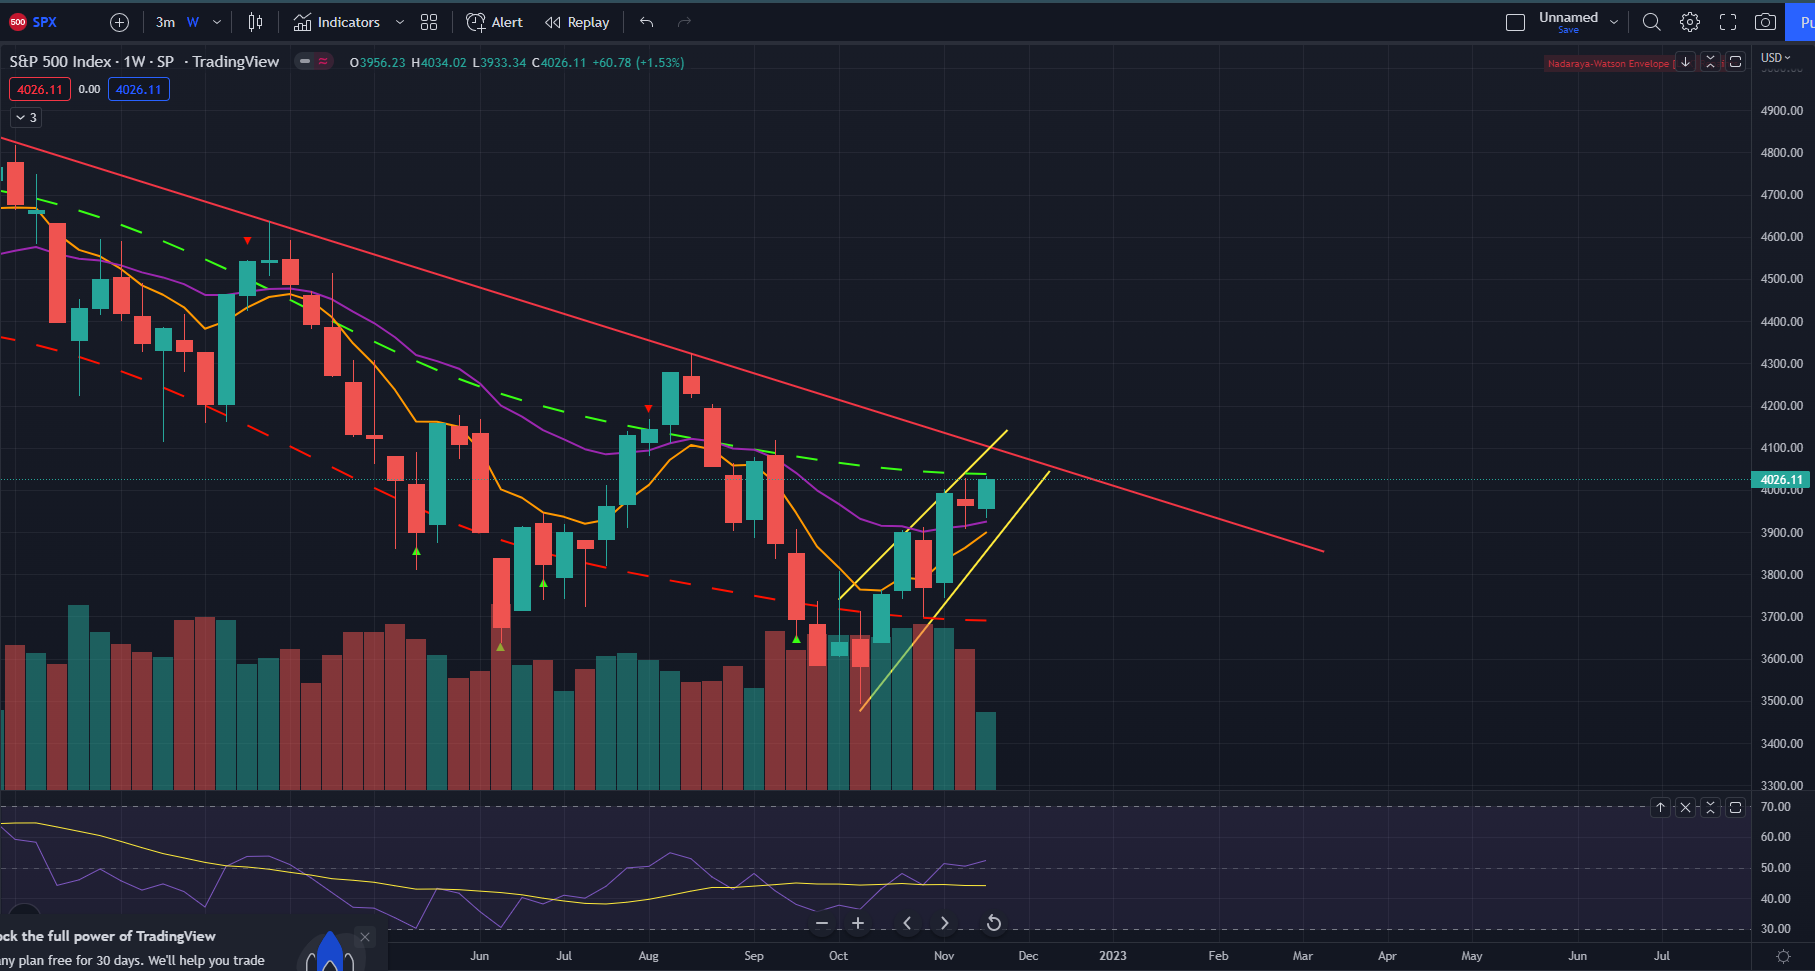
Also on the overextended narrative, look at the SPY weekly chart. We’re moving up on lower and lower volume - not good. Also we’re nearing the overextended levels on my chart and whenever we near these over extended levels, we typically tend to reverse here. We’ll see if this happens again.

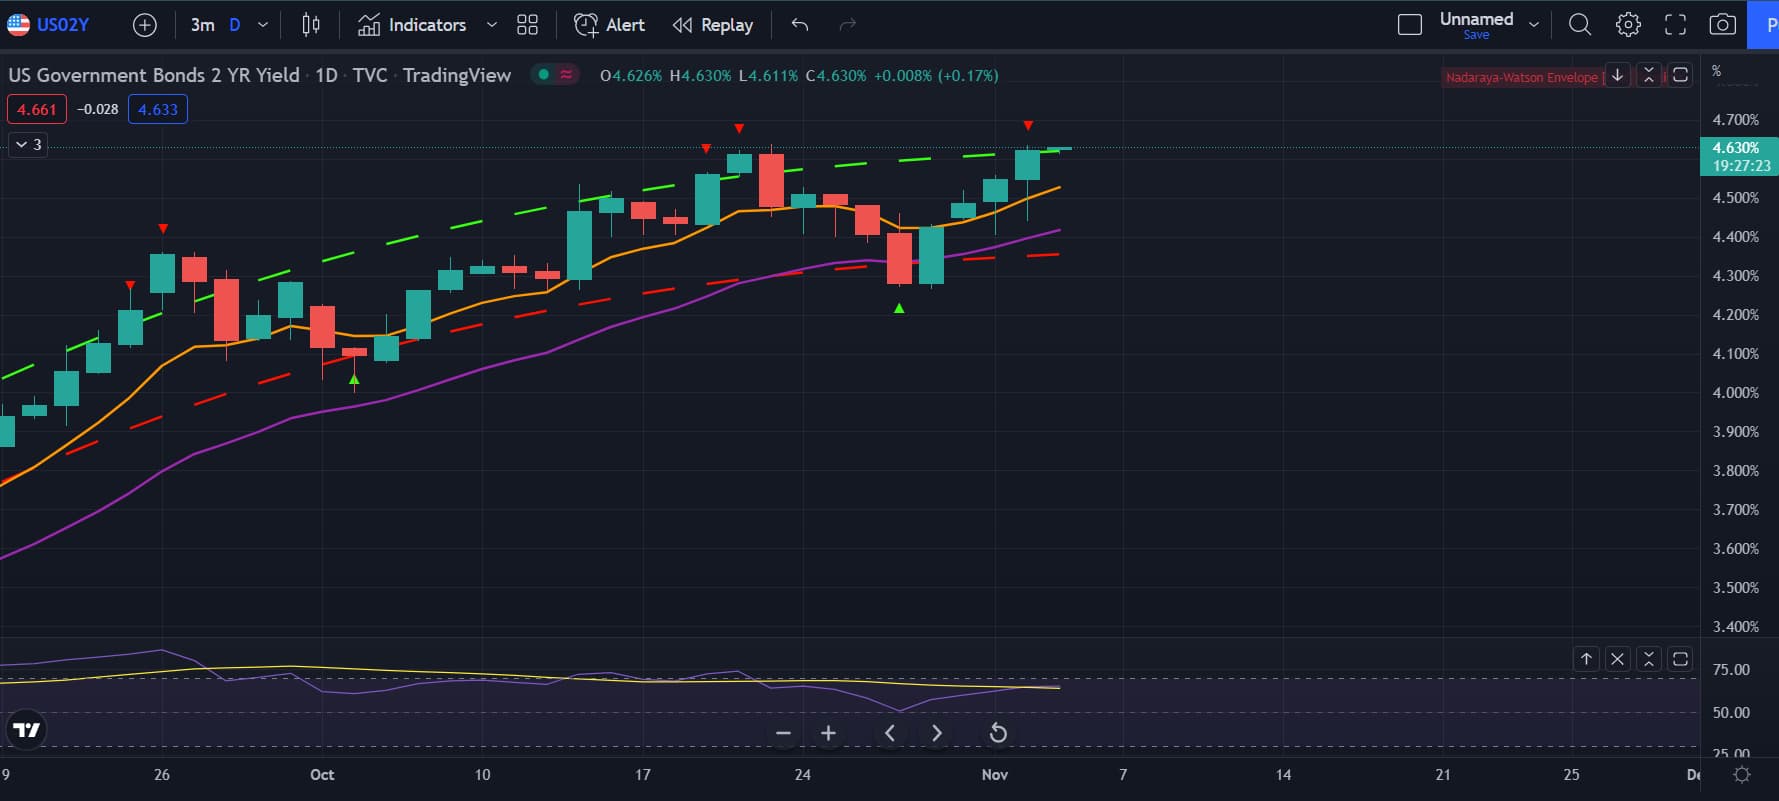
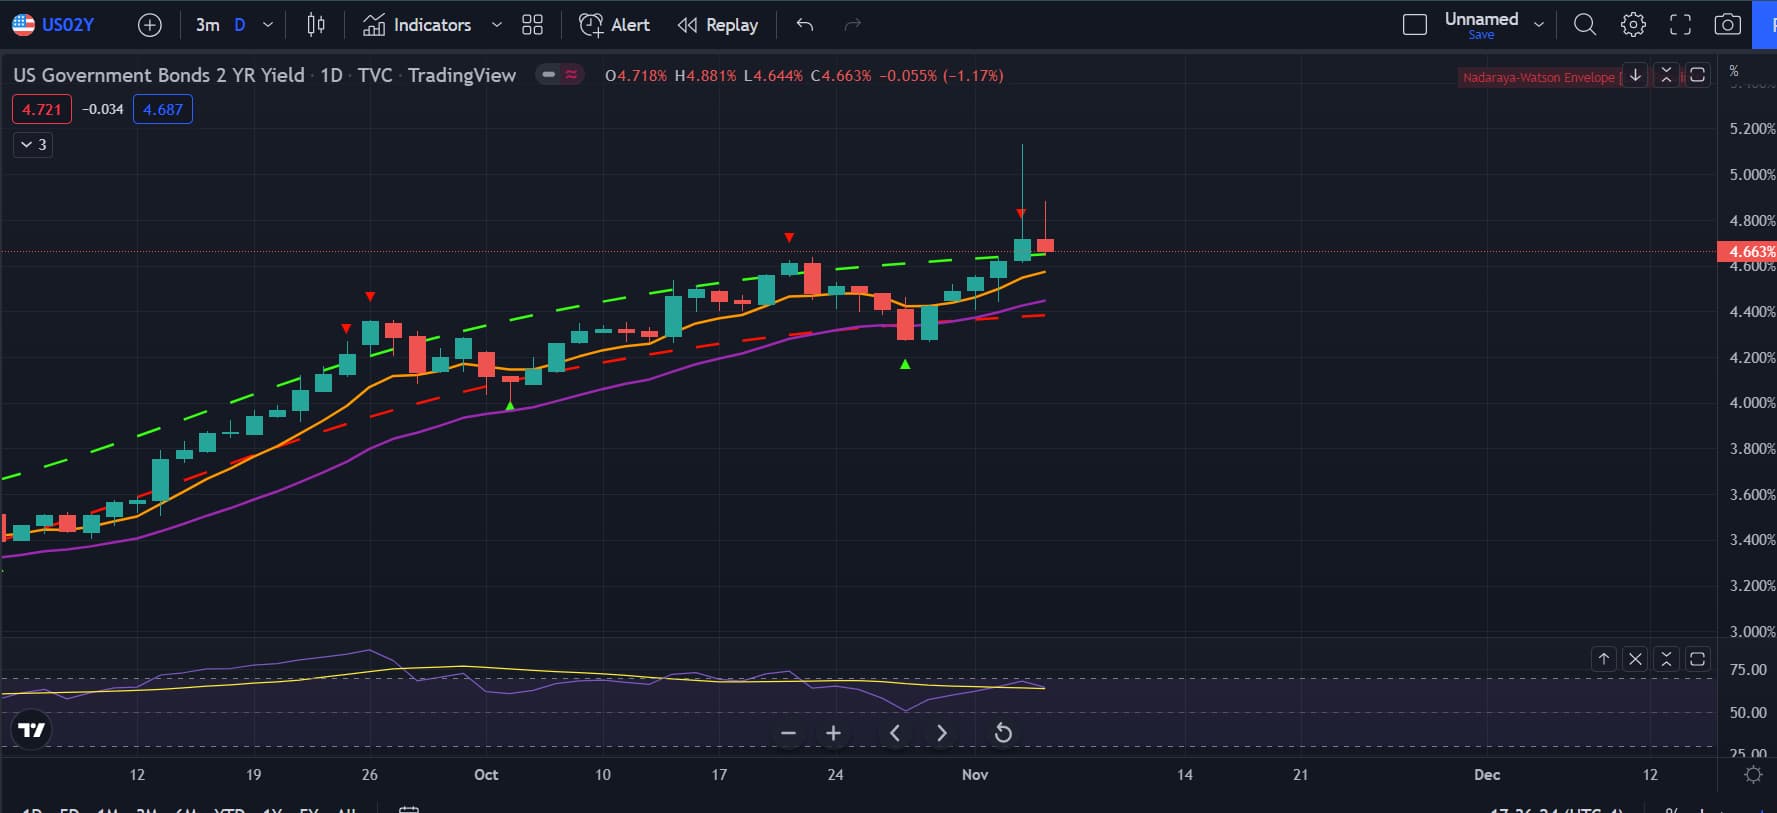
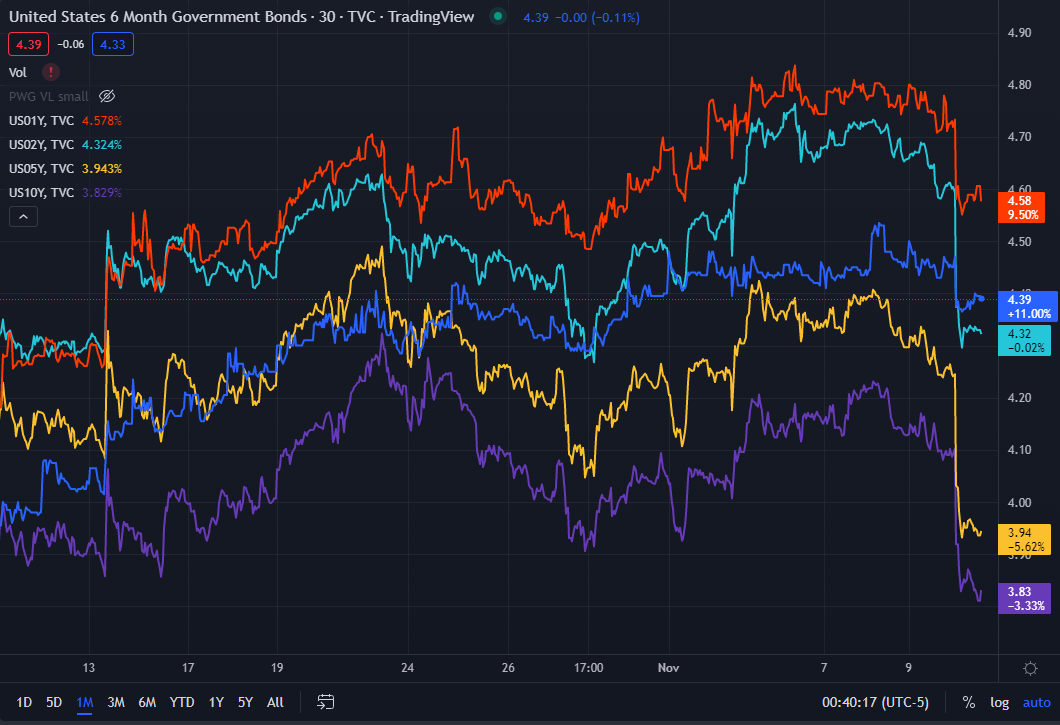
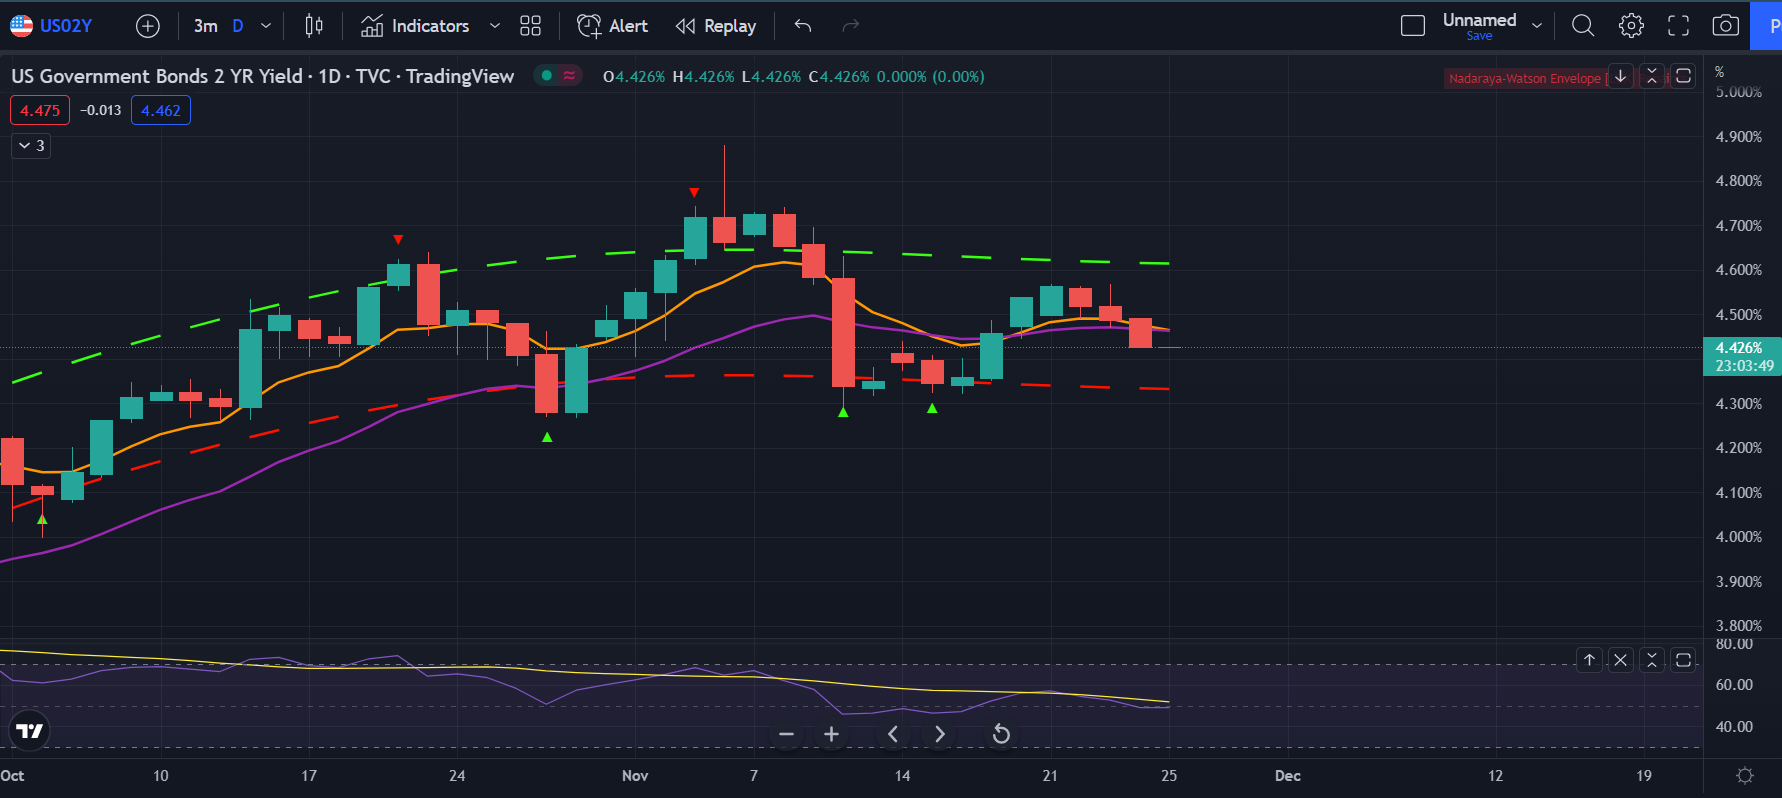
Now here are some more bullish signs. The 2 year yields seems to be forming a head and shoulder pattern. If this continues to play out, then there’s a chance that markets continue to rally and we get the huge short squeeze. This is looking bullish, but we still have to play out this pattern and have the 2 year yields roll below 4.32%. Until then, this is just a pattern that can be invalidated.

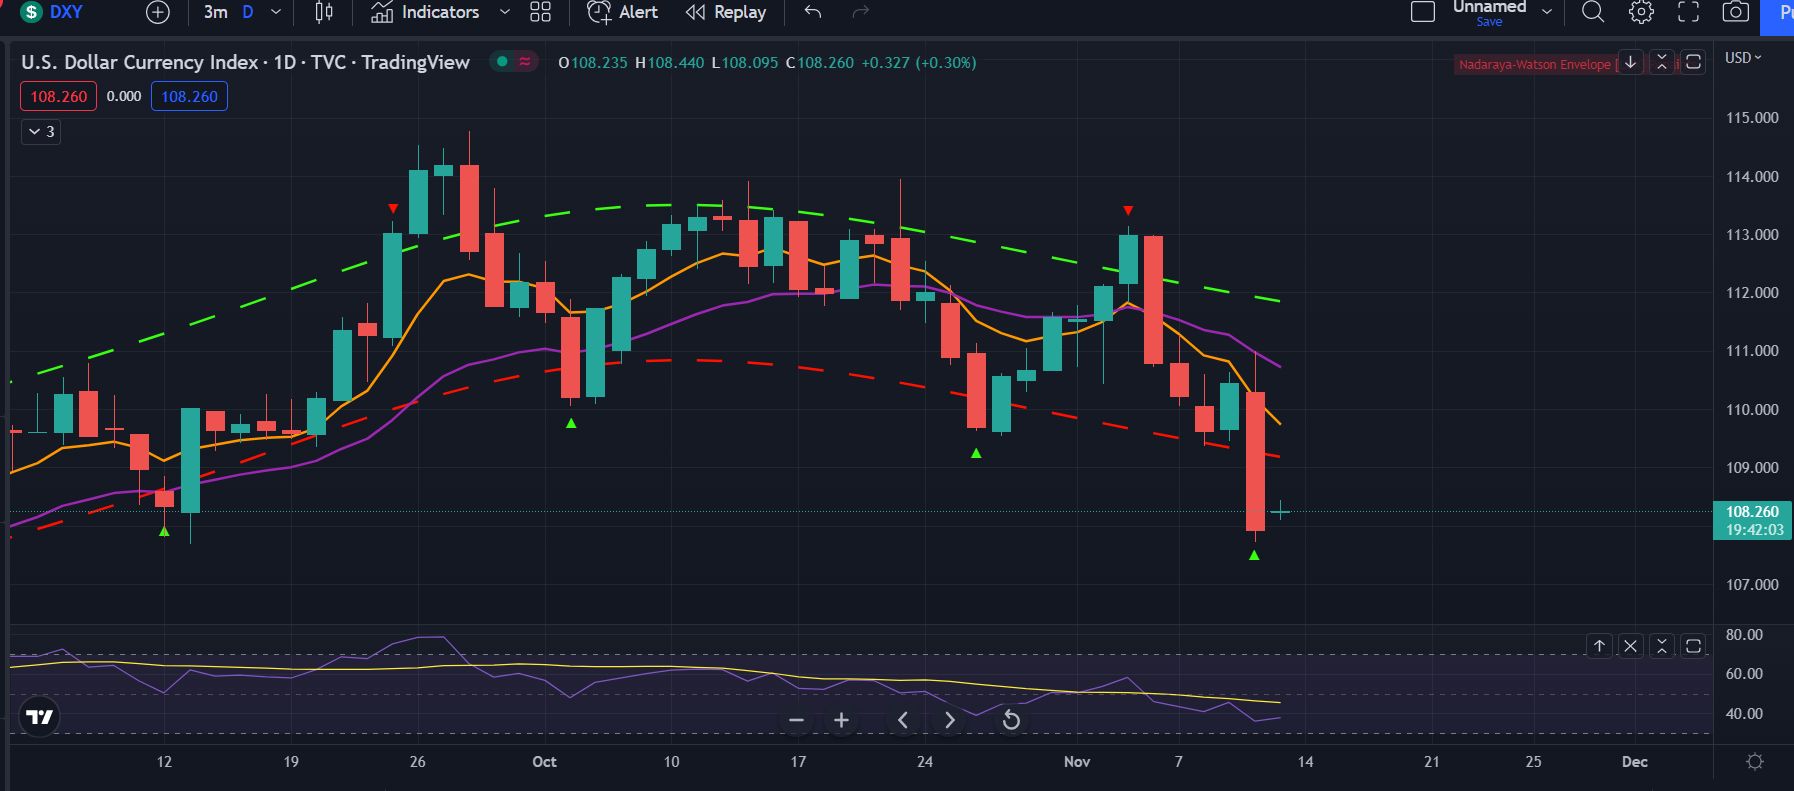
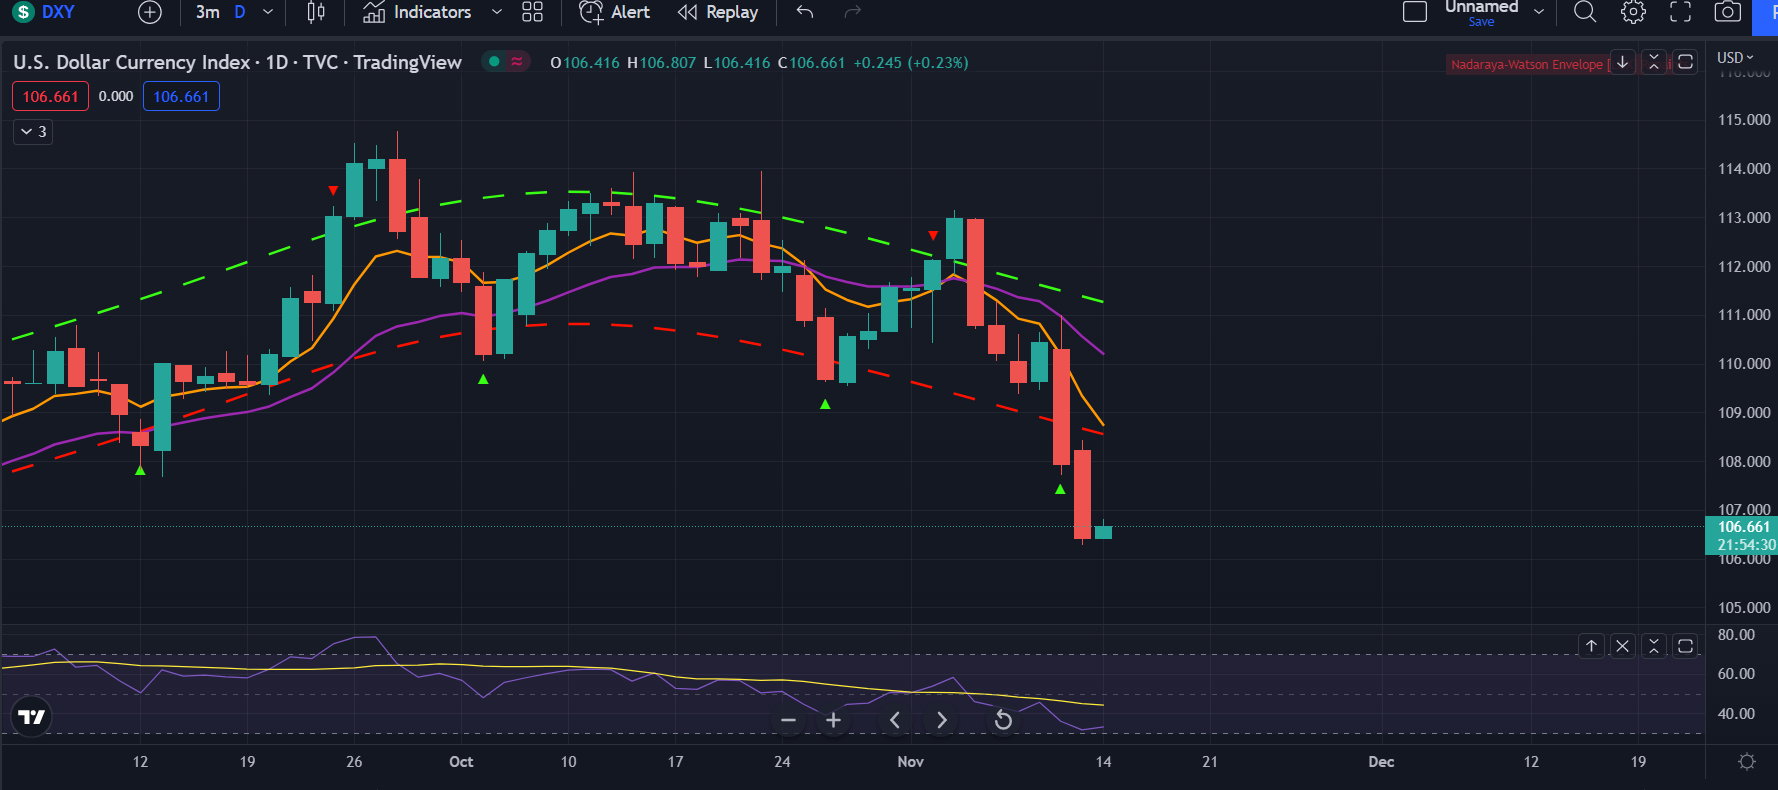
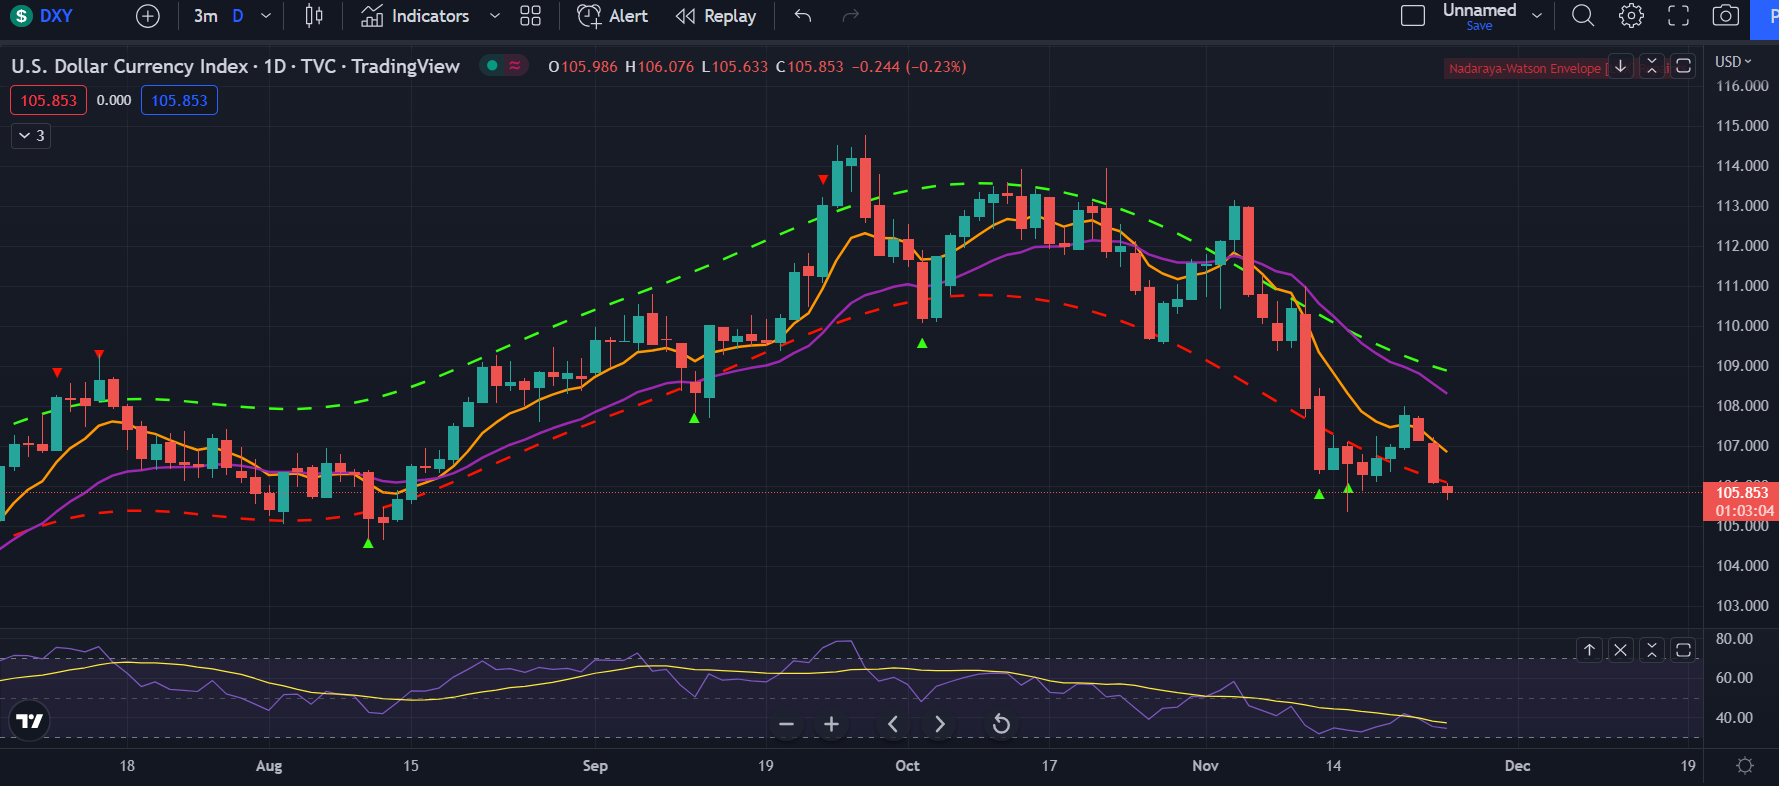
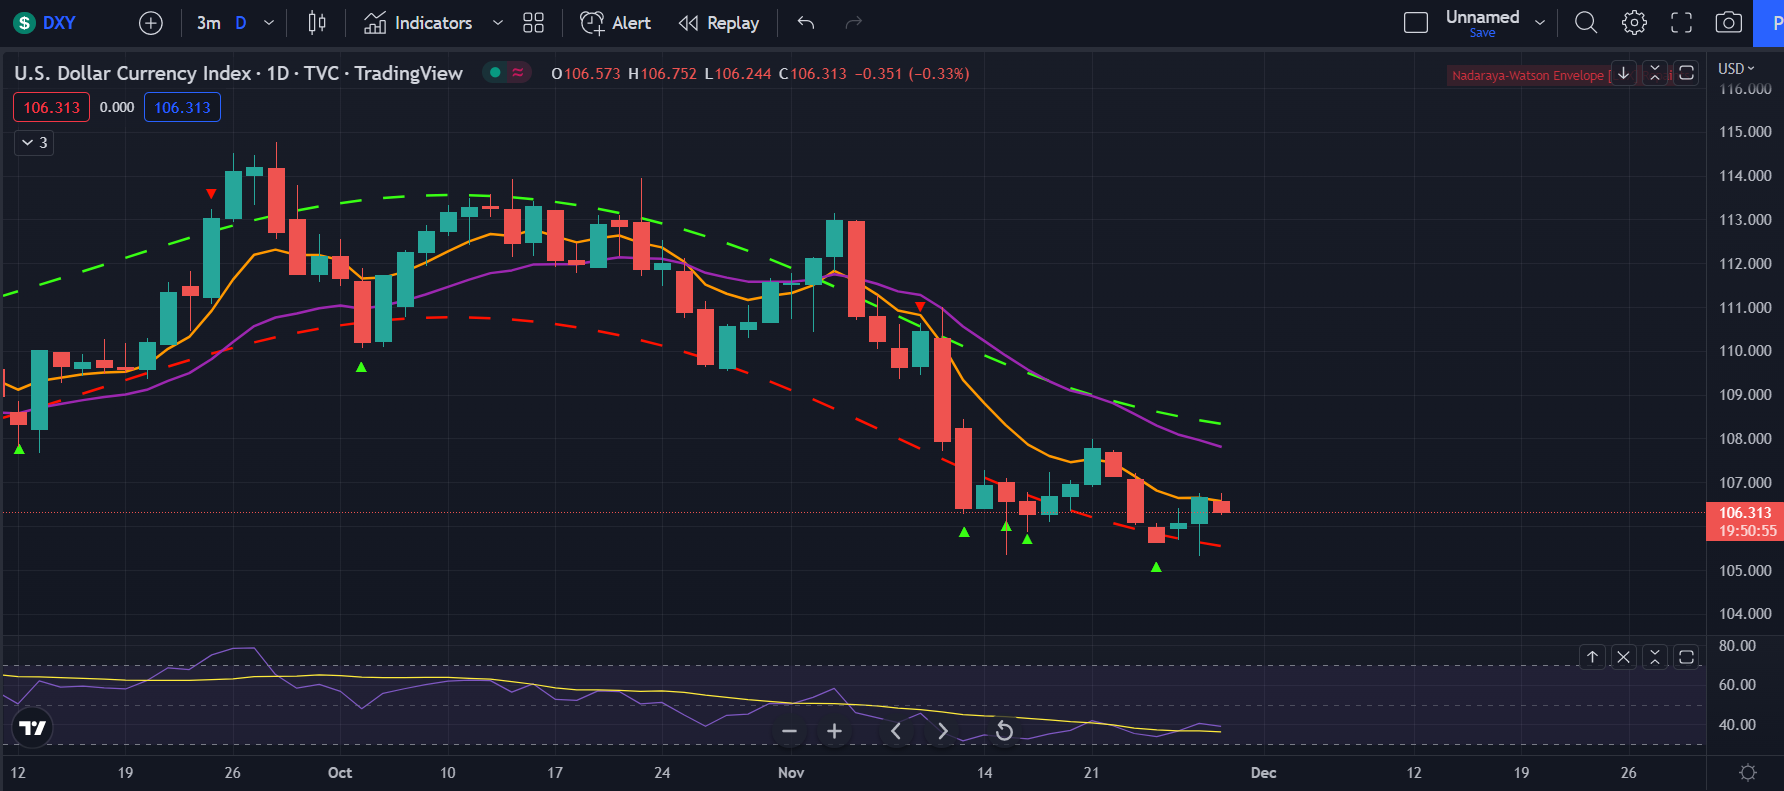
Now looking at the dollar, it’s taking a beat down, which is bullish for stocks. But something to watch for is how there seems to be a support formation here. There are multiple bounces around the area we’re at and bottom wicks. There’s also a bullish divergence on the RSI. I wouldn’t doubt that we start to bounce off here and put more pressure on the markets, pushing us into a pullback or a next leg down.

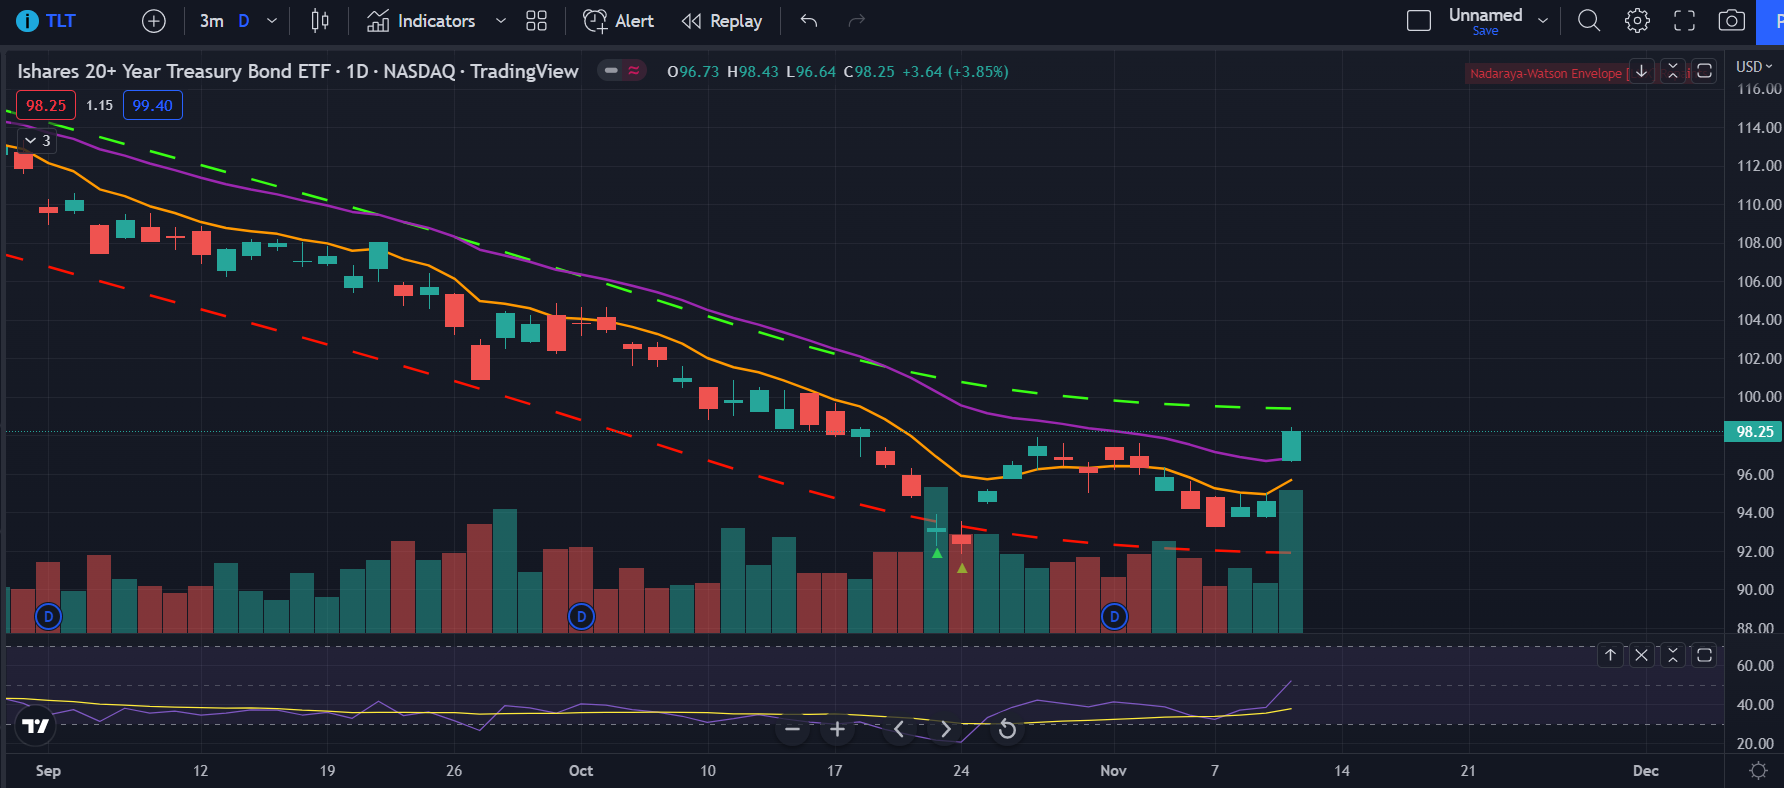
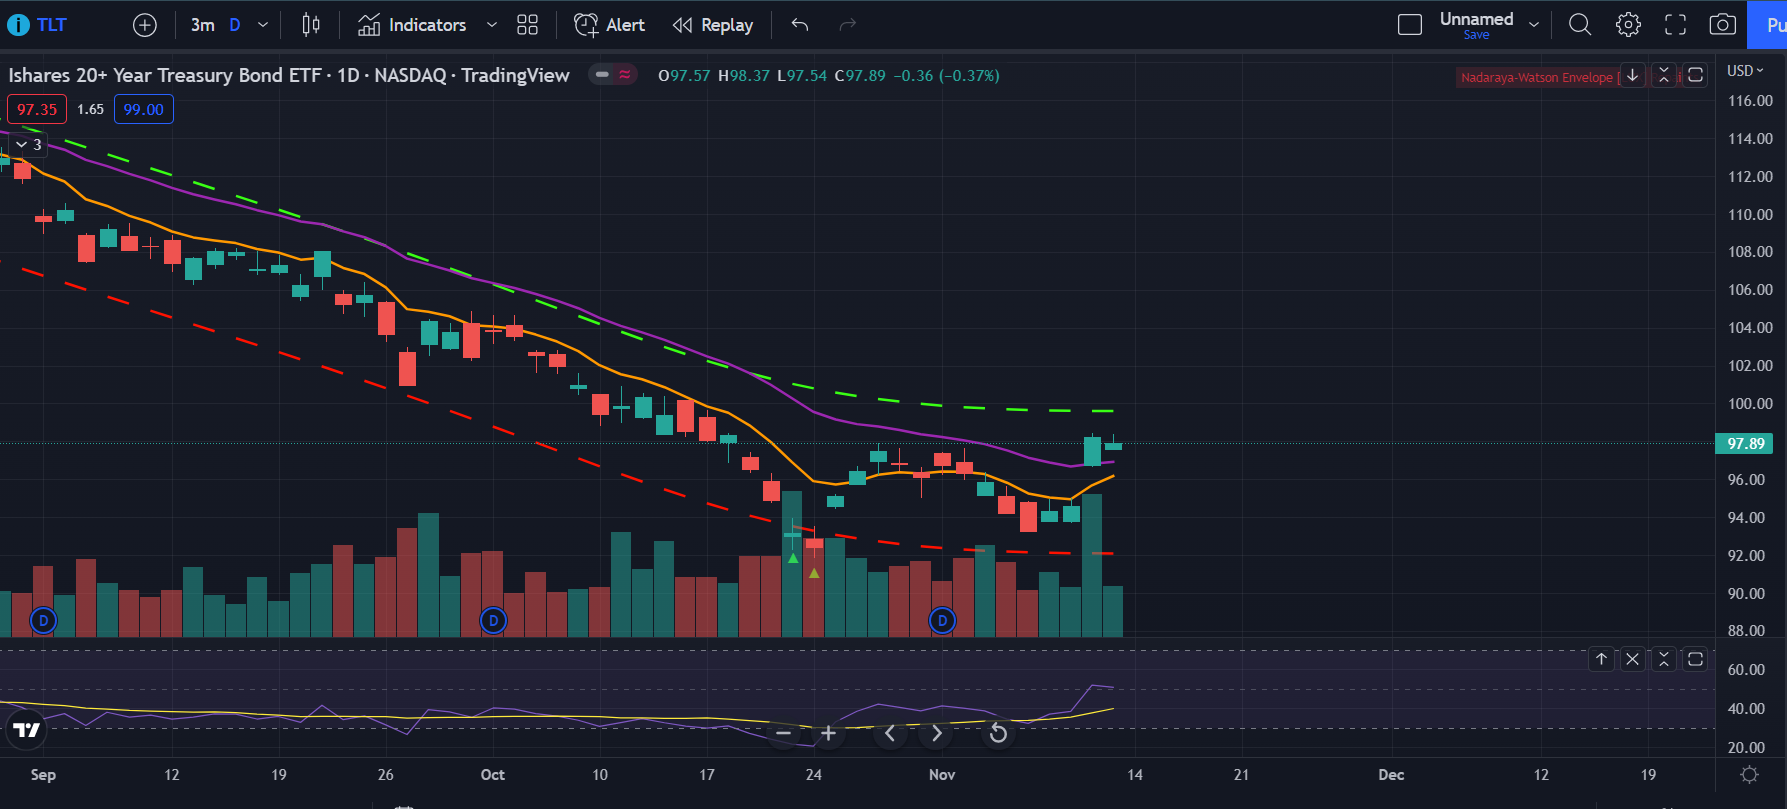
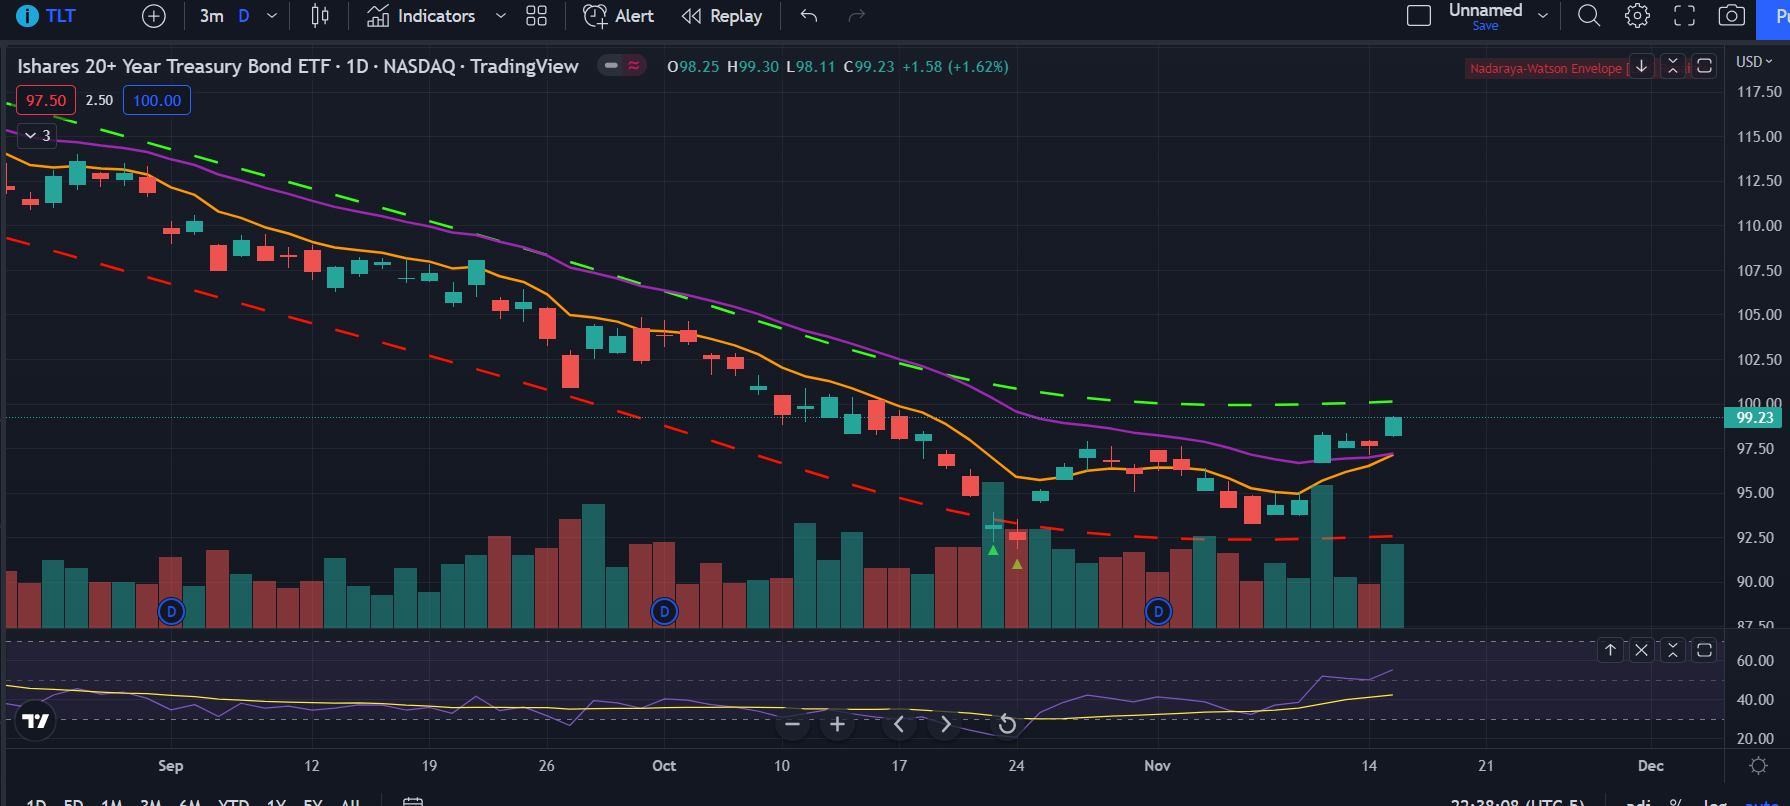
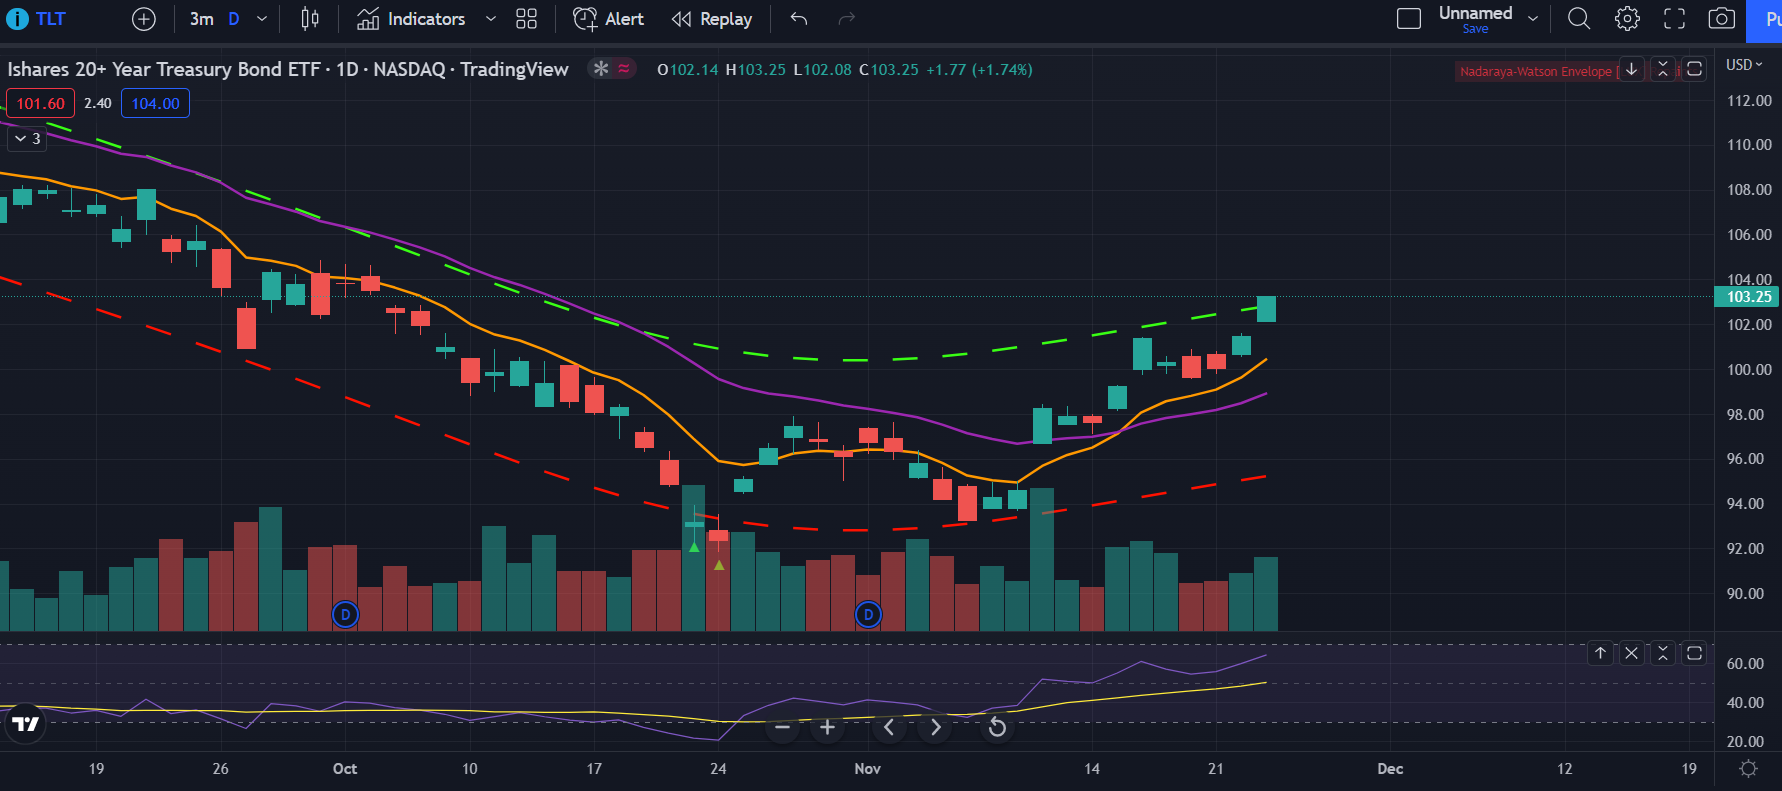
Now for more bullish signs. The bond market is starting to recover. This is a great sign, and potentially a sign that the bottom is in for now or we’re due for more room upwards. Either way, the fact that bonds are moving up are showing that buyers are getting more confident to take risks and buy equities. Good signs for bulls.

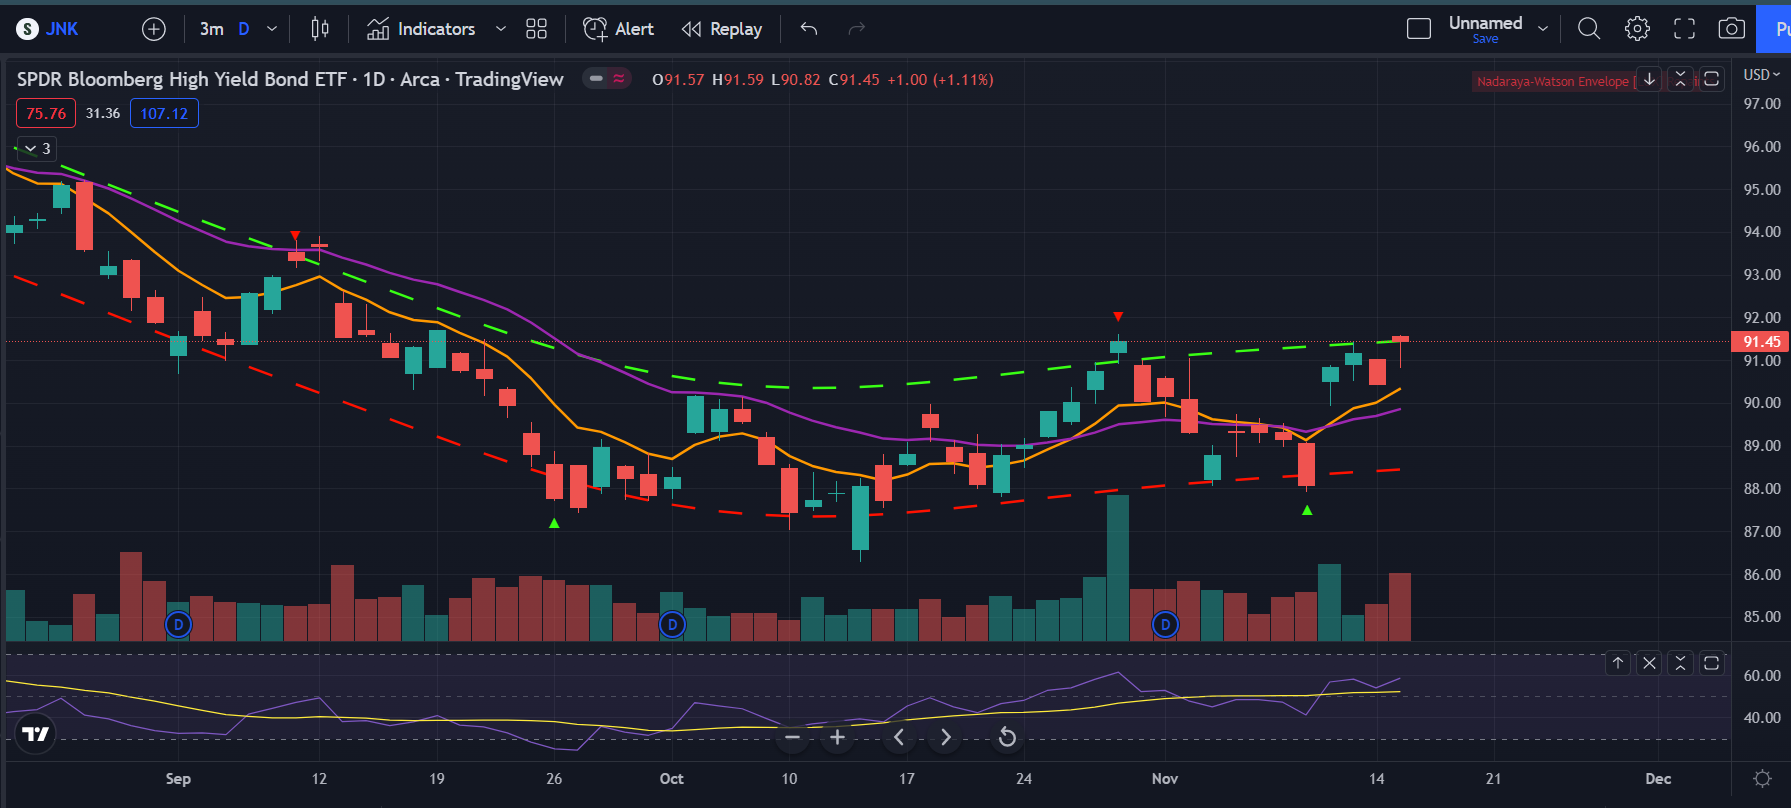
Junk bonds, which are like small caps and show the “health” of the market (imo), has been showing some red flags. Very low volume compared to regular bonds and rising on declining volume. Also it’s not going up as rapidly as the bonds, showing that we’re potentially looking at a bull trap. But the fact that we’re making higher highs is a promising sign that maybe the markets won’t go into a free fall right now.

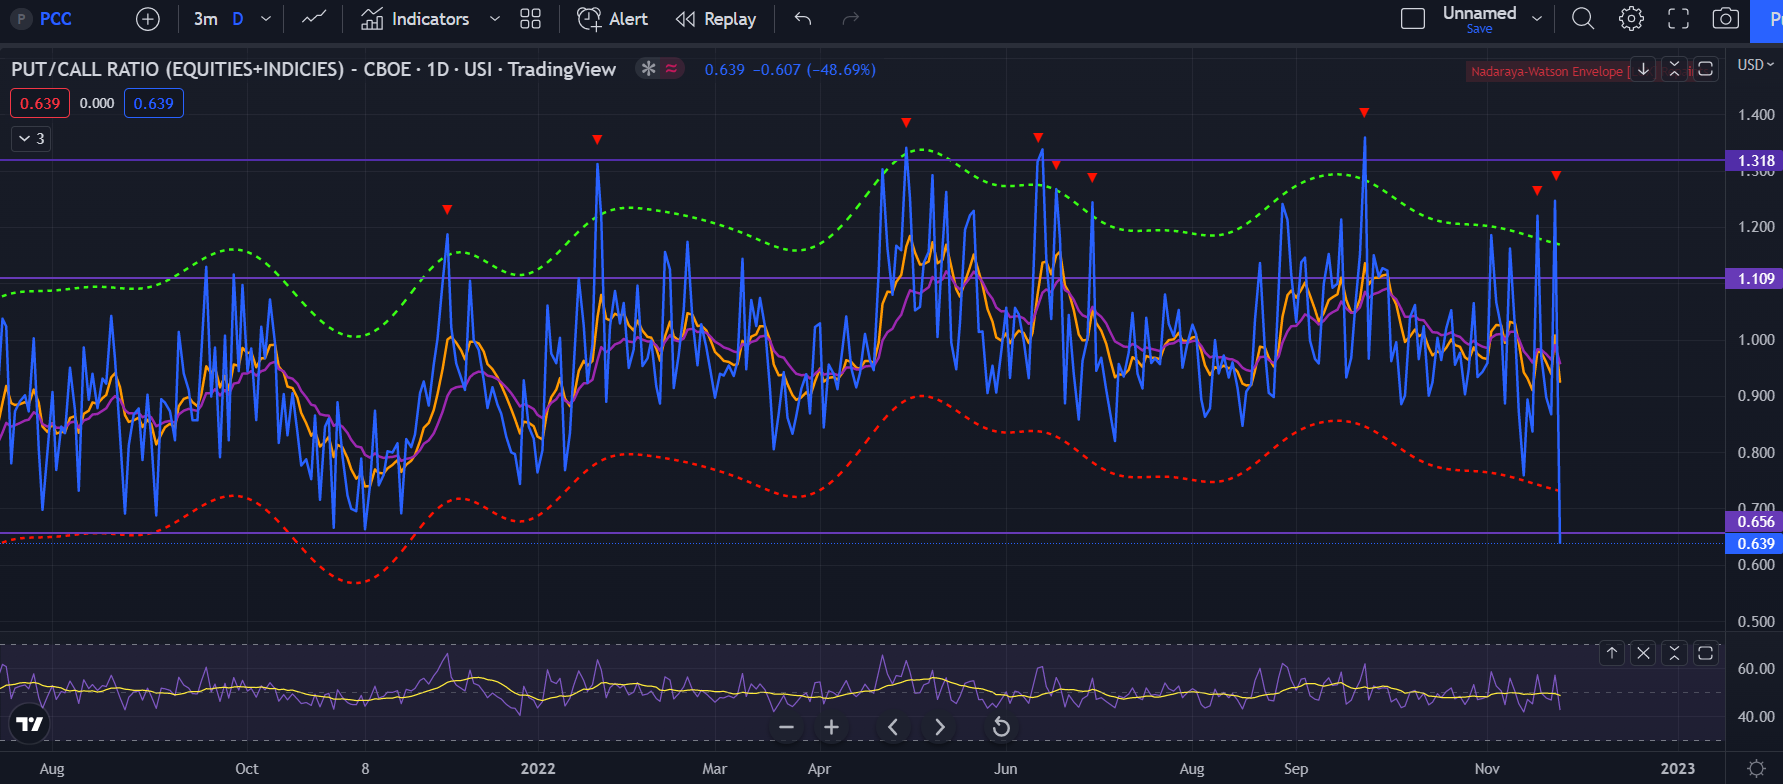
Now for some bearish shit. Looking at the put call ratio, we’re heavily extended to the call side. We haven’t seen this much money into calls all year. And typically, the PCC being at these levels have called tops. We’re at the level where we should be taking profits or entering shorts.

Again, looking at the S&P 500 percentage of stocks above their 50 day moving average, we can see that we’re at levels where markets tend to have a pullback or take a shitter down. This year, it’s been the next leg down. Will this change? I don’t know and maybe it’s just a pullback this time, but it’s showing that markets are becoming overextended to the upside and we should be looking for a pullback.

Overall, it does seem like markets may be providing signs that the bottom may be in for now and we have more room to move up. BUT there are signs everywhere showing that the markets are becoming overextended and due for a pullback. How deep this pullback will go will show us if the market has more room upwards or if this bear market rally is done. Look out for the levels at the 405-410 level because it seems like SPY is gravitating to that area for a huge move to either side. Good luck everyone and happy thanksgiving

6 Likes

TDLR: Same thing I said in the last post. I still expect us to go to the 405-410 level and then get rejected.

Now looking at the weekly chart, we can see that volume is declining on this move up. Yes it was the holiday weekend, but even looking at the previous weeks, the volume is dropping off. The last time this happened during a bear market rally was during the August rally. We’re nearing overextended levels, nearing the trend line and the 200 MA on the daily. We’ve also reached the 50 level on the RSI, which typically marks the ends of these bear market rallies. If we do continue to push up here, I’d expect it to be a violent short squeeze rally.

Looking at VIX, it’s near the levels where we top and it doesn’t really seem like it’s going to end up going much lower before volatility returns.

Additionally, the FOMC minutes shows that the Fed isn’t pivoting and is at most just slowing the rates. That’s not bullish, that’s just less bearish. Once the markets realize this, I think we’ll drop for a pullback and maybe we shrug it off and roar higher or make the next leg down who knows.

Another reasoning is because China is going back into Covid shutdowns. This will impact economies again and I think markets might start to sell off once this starts to become more known or if we start to see the impacts of these.

Now let’s look at the smart money flow. The top graph is the price of Dow. The Dow is making higher highs, which is good because it might be saying that the markets may be bottoming soon. The bottom graph is the smart money or big money and what they’re doing. We can see that the big money is not buying into this rally. These divergences mark tops and show that we are going to drop, not go higher. I don’t expect this rally to go much higher due to this as this seems just like retail buying the hype and fomoing in while big money is selling or cash.

Overall, I see a very limited upside from here and then a big drop. I either see us forming a higher low to confirm a bottom for now or making the next leg lower. Good luck all.

5 Likes

TLDR: Seems like we’re not going to reach the trend line but I think we’re starting the pullback, plus I think that Powell’s speech on Wednesday is gonna be hawkish, leading to further selling.

SPY on the hourly has 2 gap fills above. The gap today and the gap on the CPI release a couple months ago. The hourly is very bearish, switching the trend. I think we’re going to rally back to the gap or the 21 EMA before resuming the downtrend. The RSI is near the oversold levels now and I want to see the lower high develop.

On the daily, we can see that SPY broke the 8 EMA, showing that the downtrend may be starting now. Also look at the gaps above that we still have to fill sometime. I expect some kind of rally tomorrow and then sell off into the 21 EMA or the uptrend line that we’re in. I’ll see what happens afterwards, but those are the levels I’m looking at right now.

The VIX is now moving. Maybe it stays flat tomorrow while the market rallies a bit, but we’ll see what happens. If the VIX continues to rally, I’m going to stay that we keep dropping to 390 and then to fill the gap at 382.

Additionally, the dollar is looking strong. Lots of bottom wicks and looking like support is forming around here. I expect the dollar to continue to rise. I am looking into buying UUP (dollar tracking stock) calls, but the spread is so wide, idk if I’m comfortable buying it. We’ll see.

Overall, signs are pointing towards another stock market dip, and if Powell does come out saying “fuck bulls” I expect a much further dip downwards. I’m going to reposition into my bearish positions, betting that we’re going to see some kind of rally. I’m going to buy at 397 and 399 if it reaches there. We’ll see if I’m right and don’t blow up my port (again). Good luck all

4 Likes