SPY Tech Anal: Is July Going To Continue Pride Month?

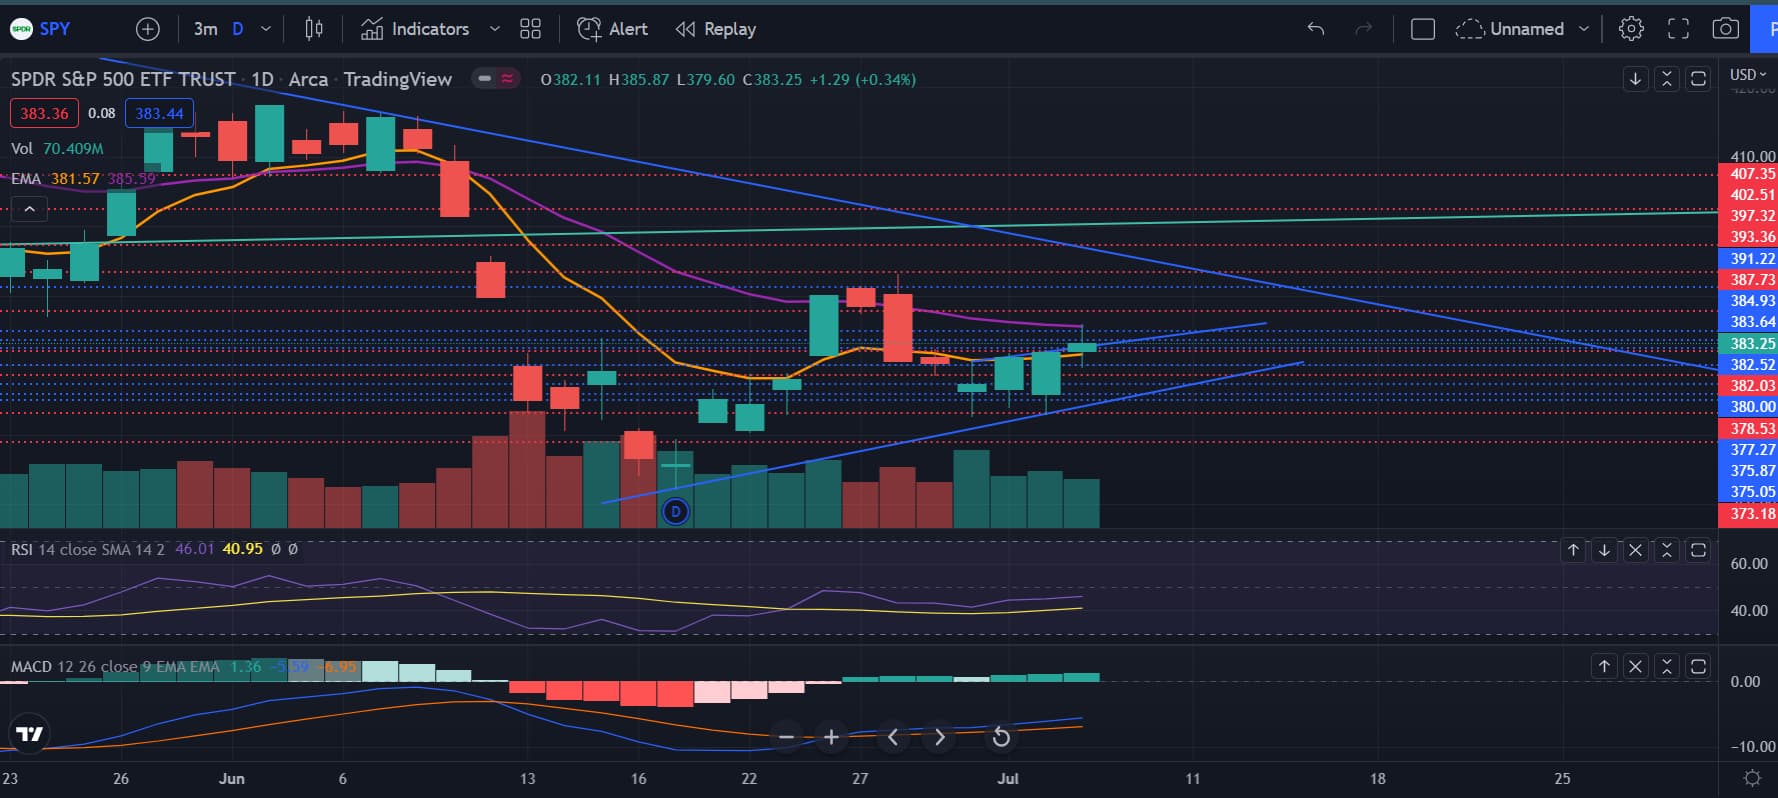
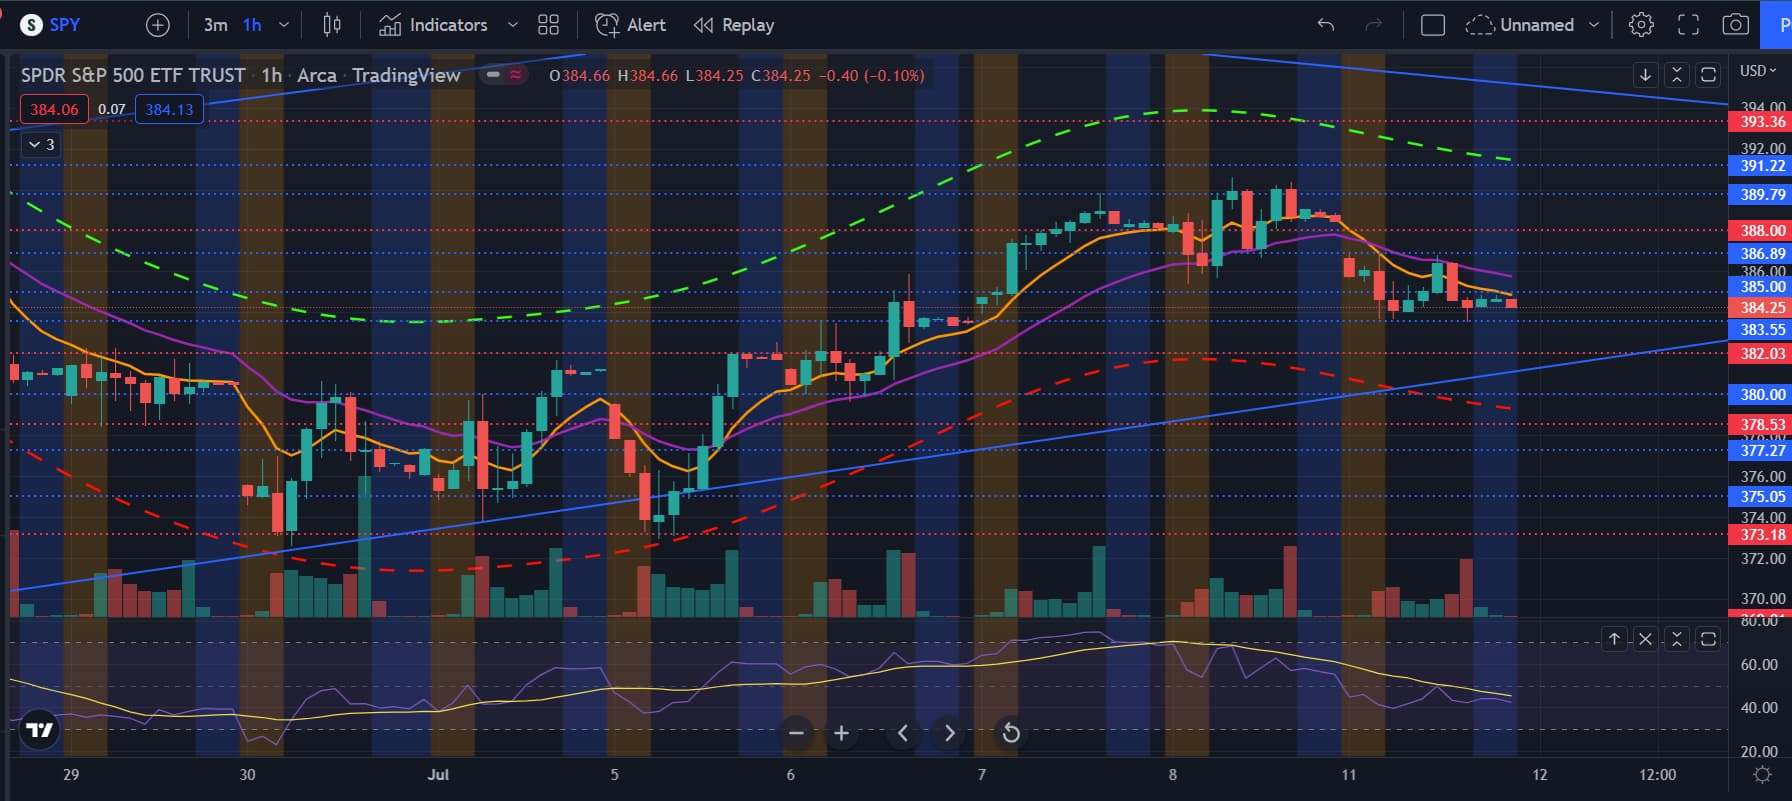
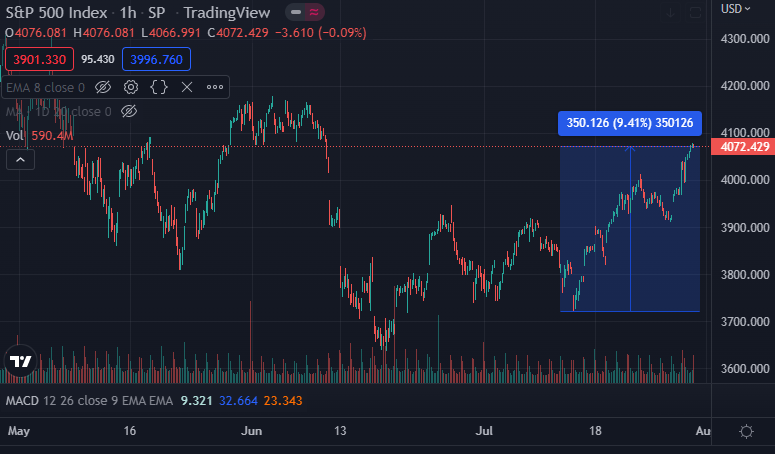
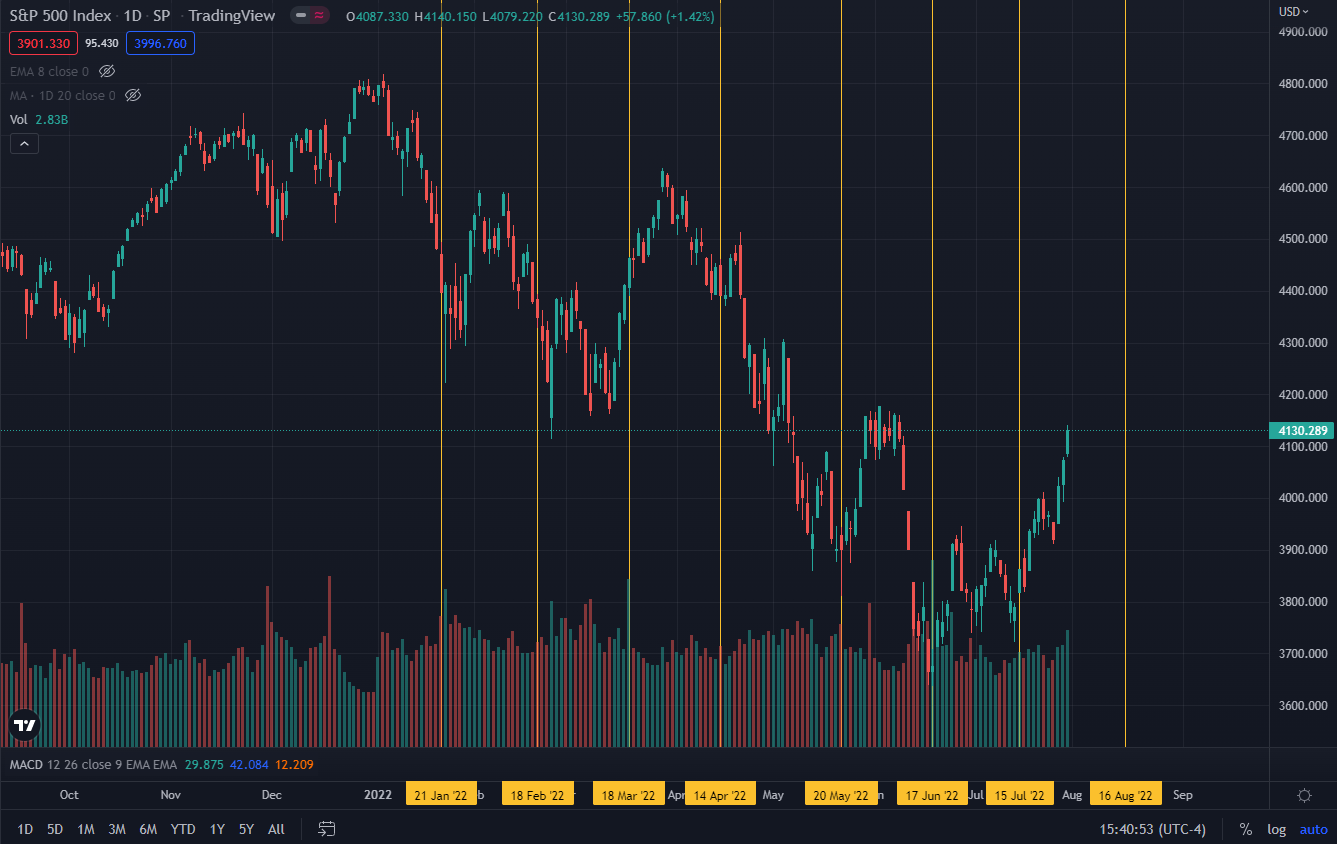
TLDR: I think we’ll see some more upside, possibly to 387 which is my next major resistance to make a lower higher before we go test the 200 MA on the weekly which is at 351.

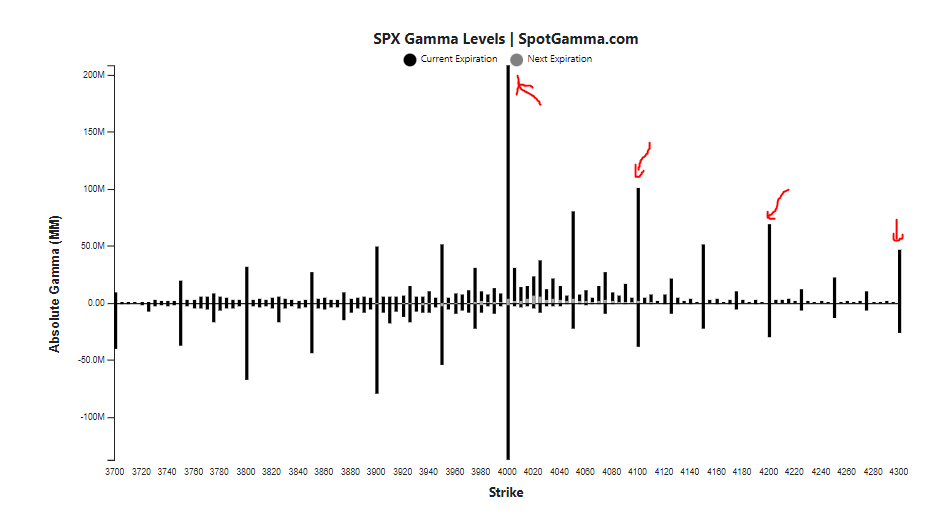
SPY on the hourly is back at the top of the channel where we couldn’t break through again today. 382 is a very strong resistance based on volume profile and previous days. Break past and I think it should be a quick trip to 387-388 because based on volume profile, there is little volume from 382 to 387-388. Another thing to note is that the 8/21 are bullish and we’re now above them strongly with bottom wicks on the recent candles. Based on the RSI, we should have a lot more upside, enough for 388ish resistance. One thing to note is that this could be a bear flag on the hourly. If this is the case, we should start to get rejected off the 382 area and then continue on downwards.

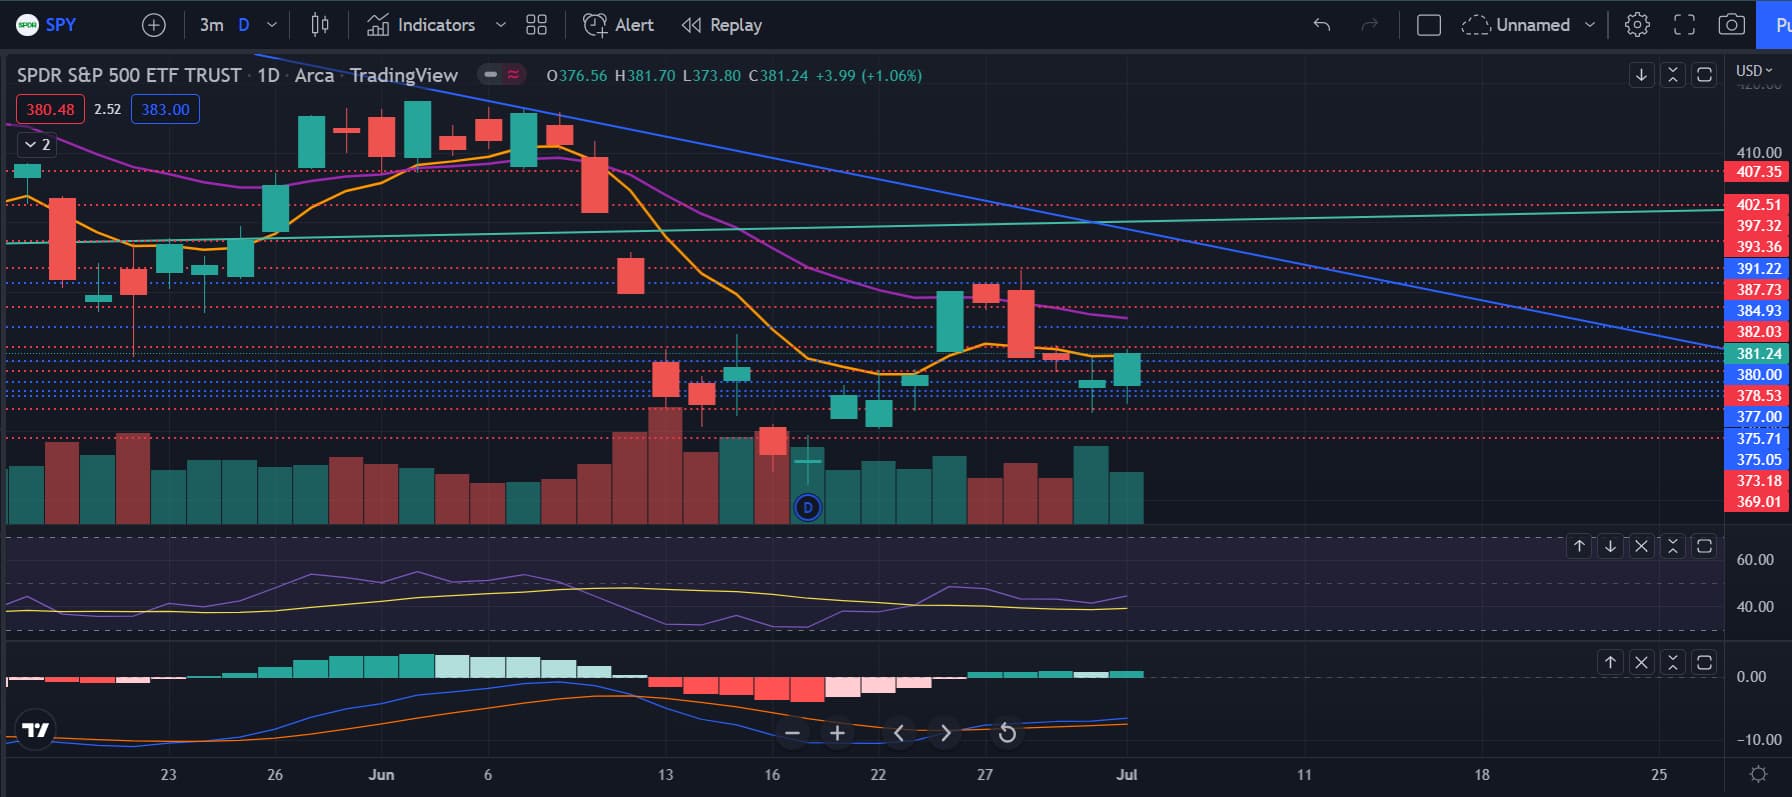
On the daily, we are back above the 8 EMA which is bullish. The volume was low, but the last few bullish rallies have been on low volume. Another thing to note is that the 388ish resistance is around the 21 EMA which typically where we have topped recently. Another thing to note is that the MACD is still bright green, showing that a continuation of this bull rally is likely. Another possibility is that we go test the downtrend line in blue to make a higher high. If that happens and there’s no bearish divergence on the RSI, I’m going to assume that we bottomed at 363 and then have a rally to the 50 MA on the daily. If there is a bearish divergence, I expect us to make a new leg lower, although I don’t think we’ll reach that high in the first place.

Now looking at the weekly chart, we have a strong bottom wick. Whether that means bullish for next week we’ll see, but so far during these rallies, we have been rejected off the 8 EMA which lines up kinda well with the 388 area, although it’s currently at 393.66. Overall, I do expect another leg lower and if we do make a lower low and there’s a triple bullish divergence, I’m going to expect a very strong dollar.

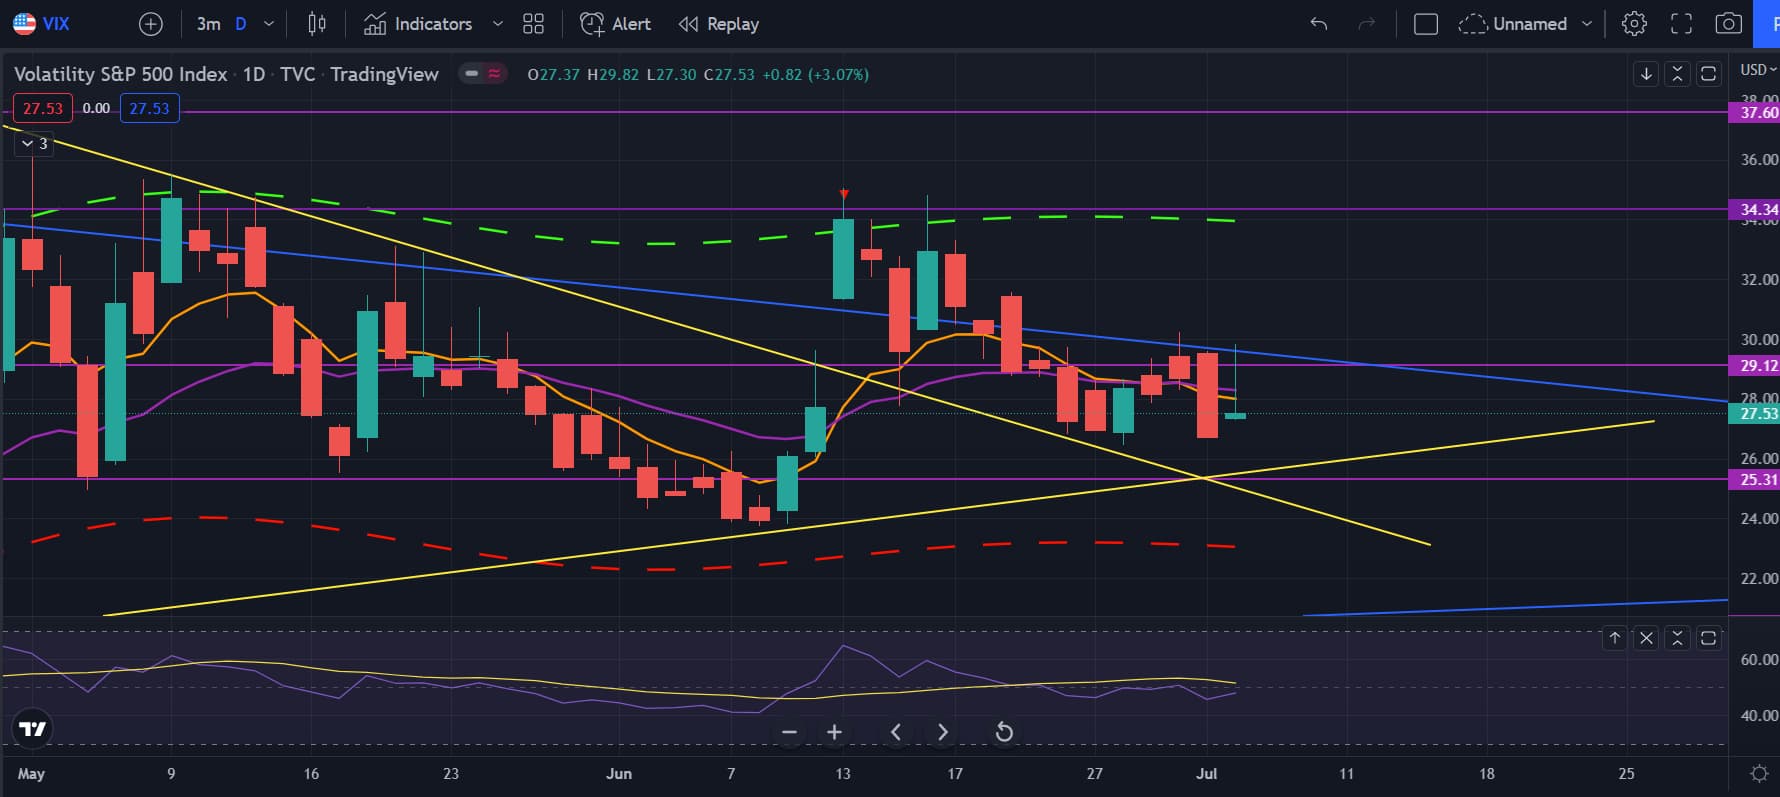
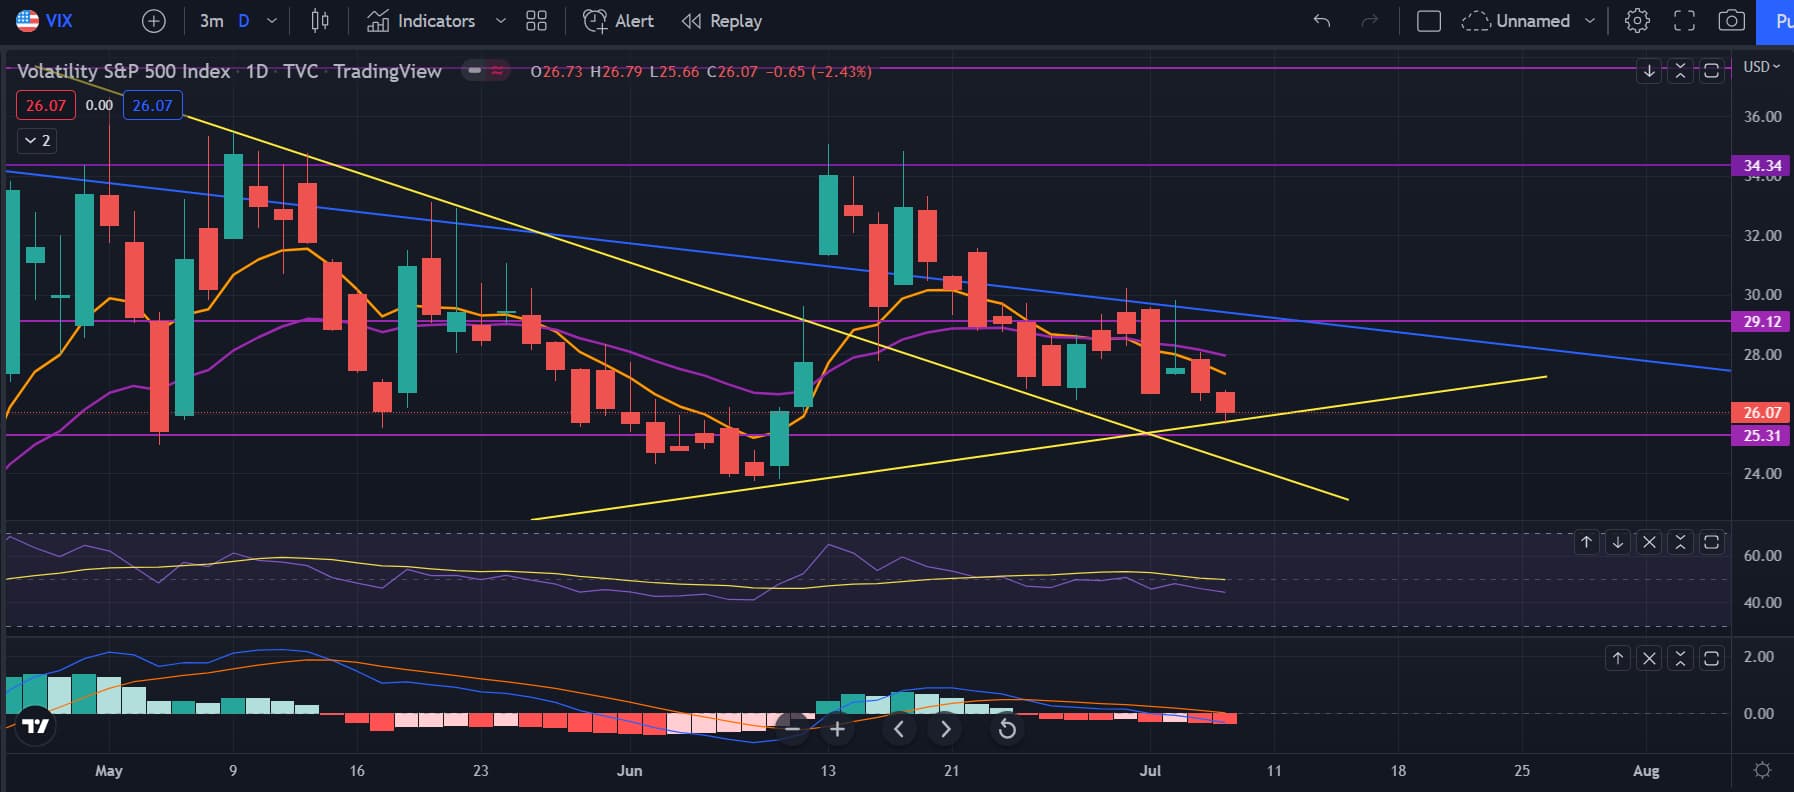
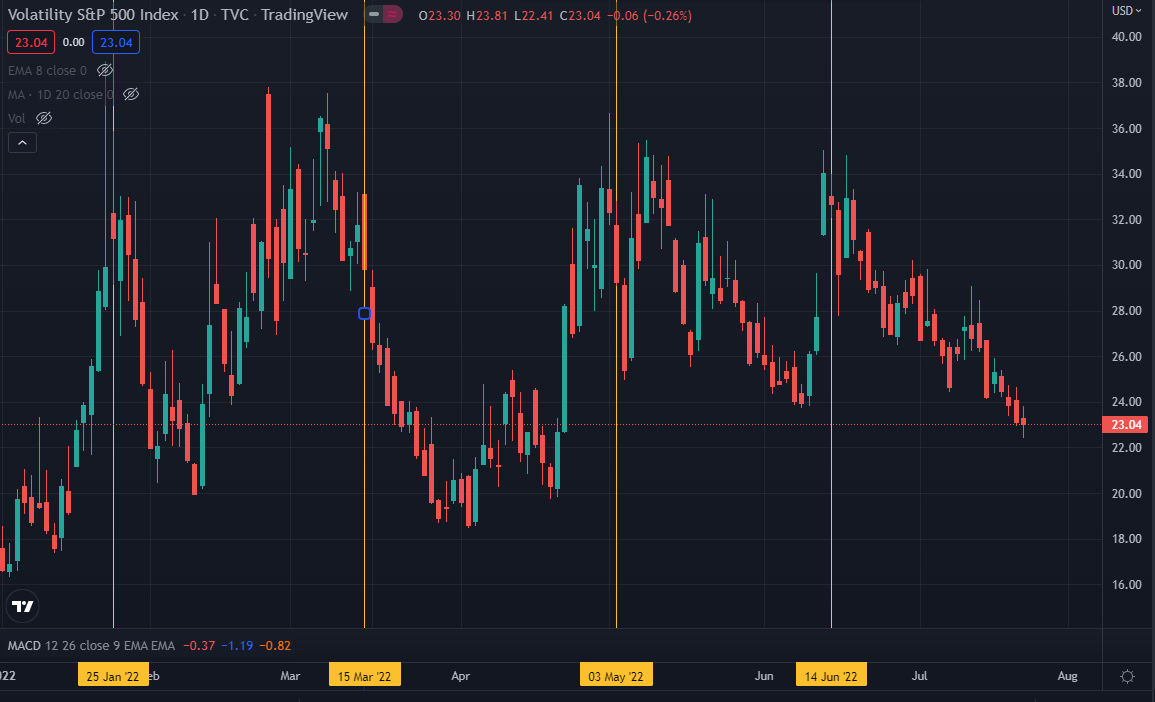
VIX has broken below the orange line which is bullish. The next support I’m looking at is the yellow uptrend line, which is where I think SPY should top. I think this should give us enough room to go to 387-388, or maybe even to 393.6. I’m going to follow VIX and most likely start a put position when I see it near the yellow line.

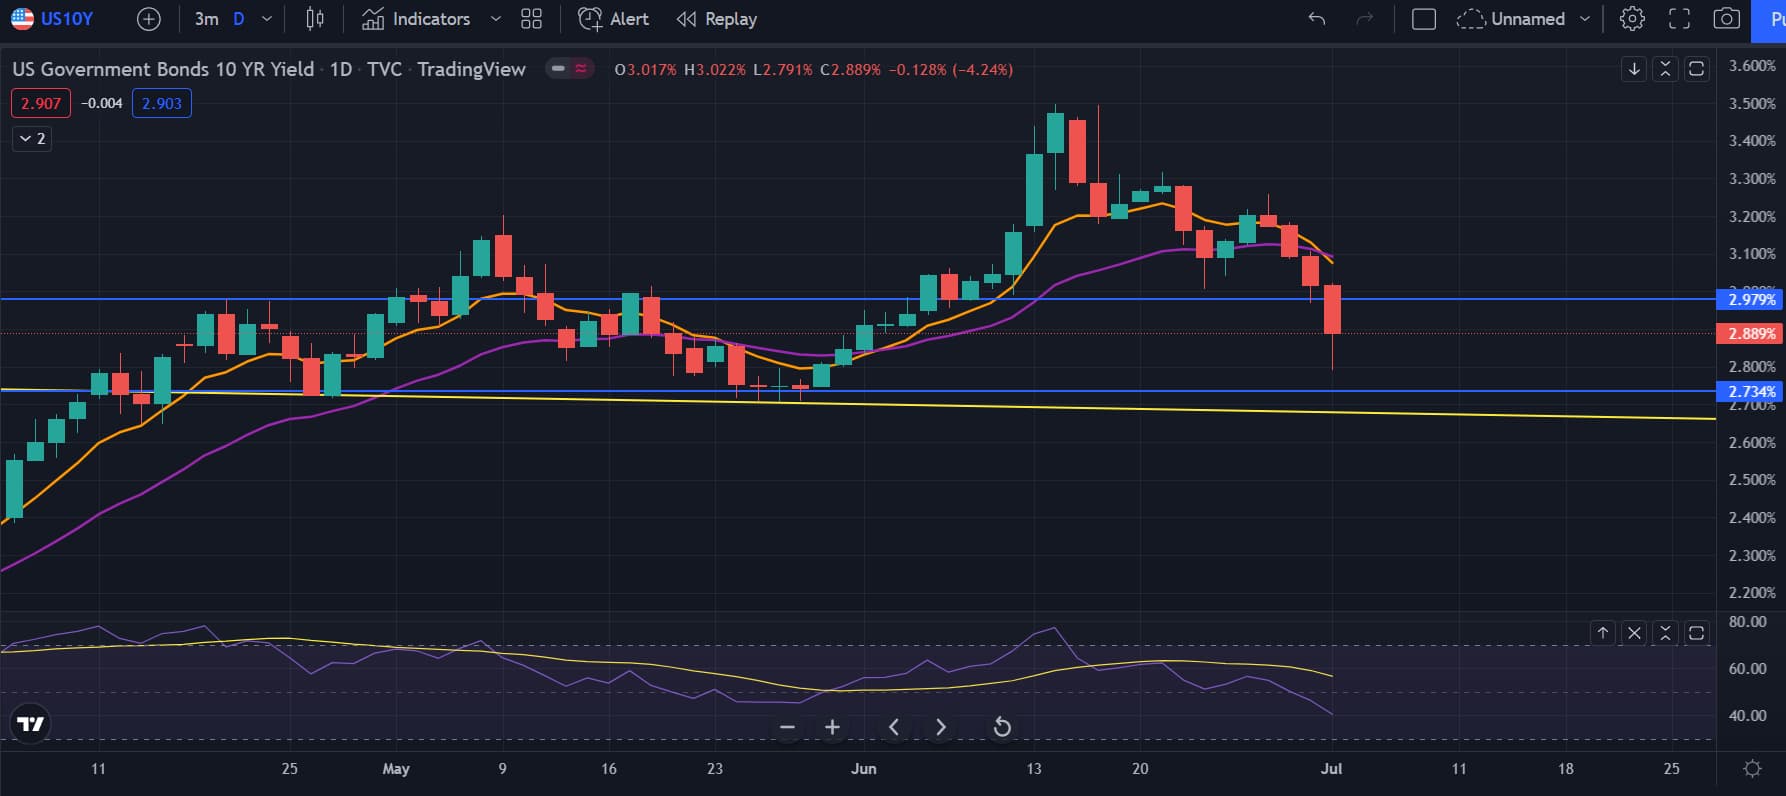
The 10 year yield got crushed hard which is bullish for stocks, although NI did mention this could be kinda be bearish based on the reason why it’s dropping. There’s a big upwick though, so something to look out for, but this is giving more signs that stocks could have a good rally in them.

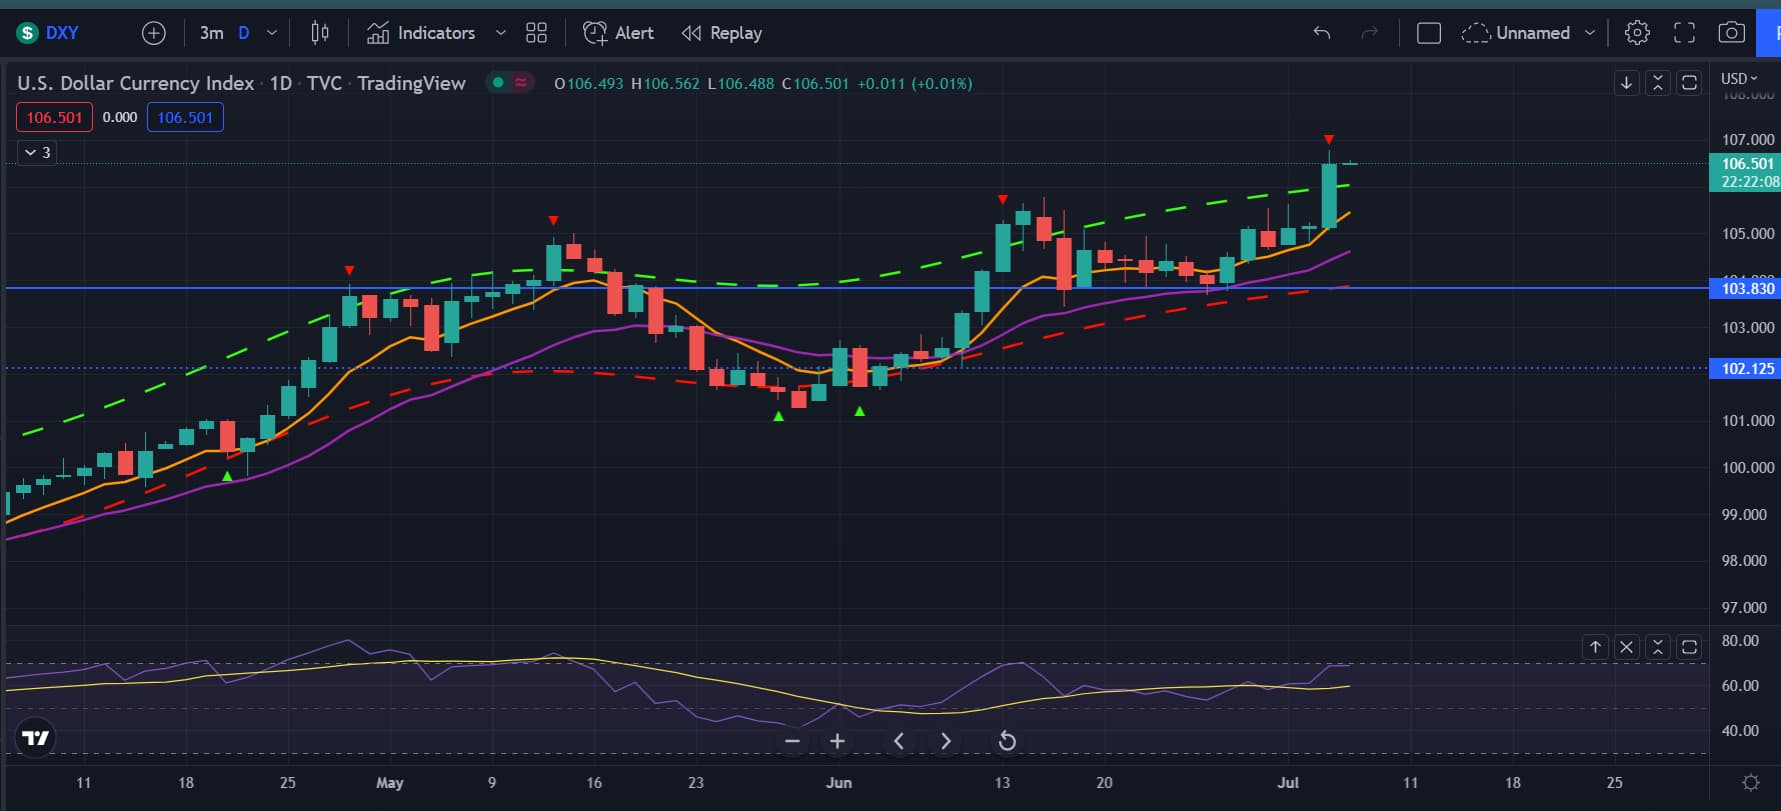
So the dollar made a tweezer top which is bearish. Also there’s a bearish divergence on the hourly which is playing out so far. If this continues to play out, we should see a good rally in the stock market, again giving more reason why we should expect a rally.

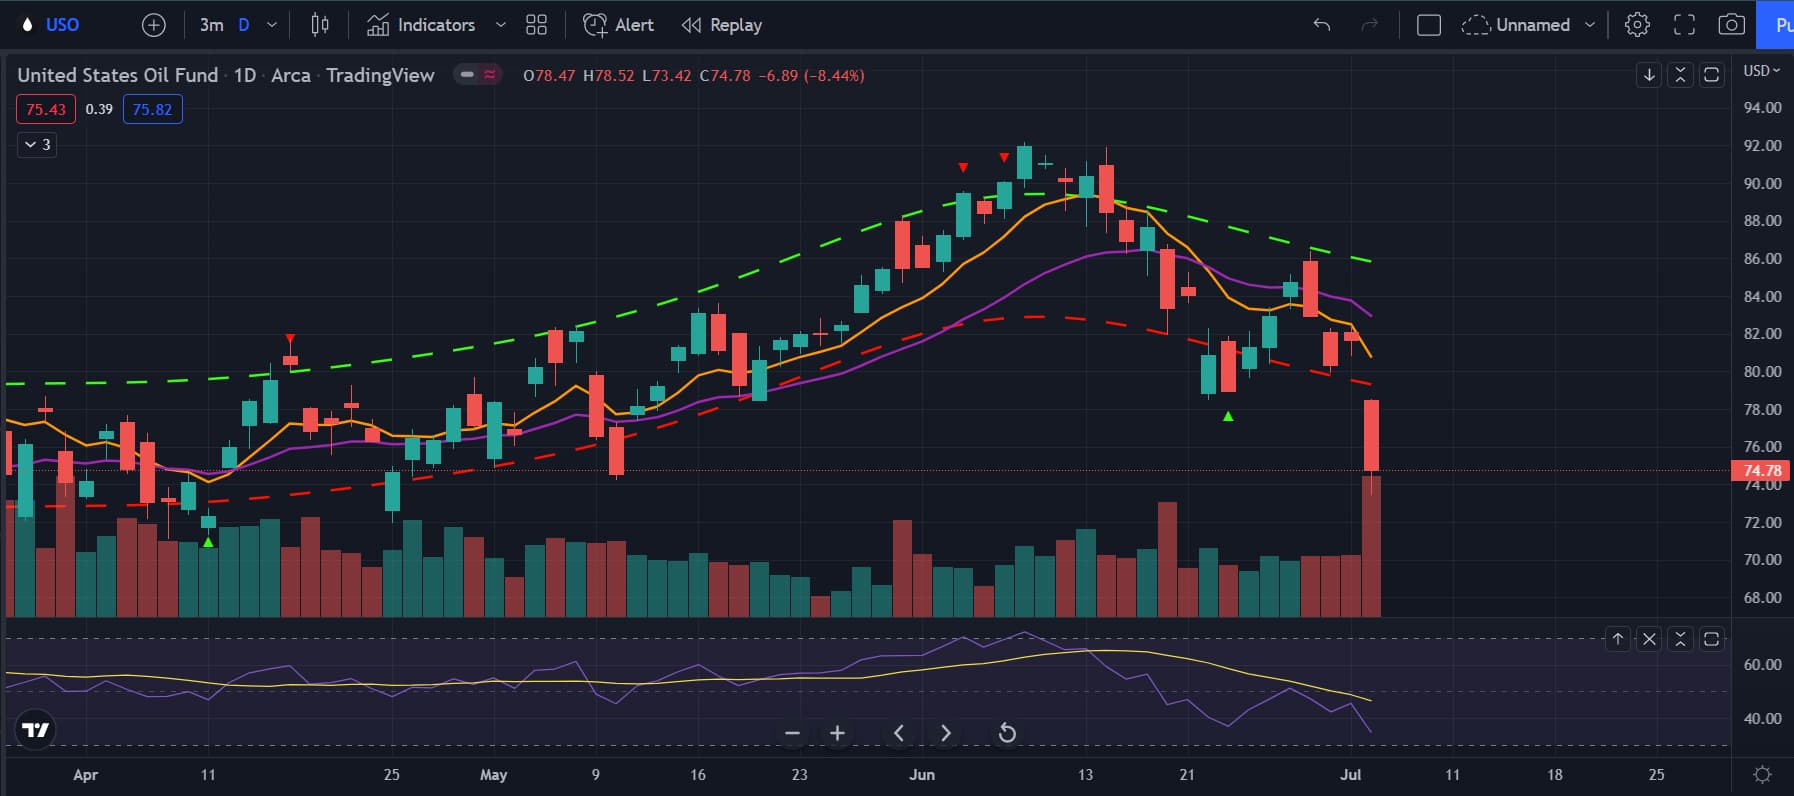
Oil was up today, got crushed and then rallied again. Kinda bearish, but at the same time, this just seems like consolidation, so until I see oil start to surge up, I’m going to keep this as neutral or bullish.

PCC shows that there is more puts entering the markets. Once I see it at the other extreme, I’ll begin to get bearish again and hopefully that lines up well with the 387 area. But overall, PCC is neutral.

In conclusion, I do expect a rally up to 387-388 before we start to show weakness and then shit down. But if we do go higher, I’ll be looking for signs if it’s a strong rally or a weaker rally looking to get rejected at the next major resistance. SPY did form a doji and then a move upwards, which could mean that there’s a continued move upwards. Overall, there’s many situations available, but I’m leaning towards short term and then continue on to be bearish into the 350 area.

Are you retards ready for another FOMC minutes release? Here’s some updated stats

5/25/2022
Bottom Time: At open, but another bottom was 9:48am and 12:27pm, bouncing off hard at 393
Top Time: 10:39am or 1:36pm
Top to bottom percentage: $3.97 from 9:48 bottom, $1.65 from 12:27 bottom
Minutes pump top: 0.49% - $1.92
End of day move if you held: 0.78% - $3.06

4/6/2022
Bottom Time: 12pm
Top Time: 1:45pm
Top to bottom percentage: 0.5% - $2
Pump top percentage: 0.5% - $2
End of day move: 0.6% - $2.5

2/16/2022
Bottom Time: 12:30pm
Top Time: 1:15pm
Top to bottom percentage: 0.36% - $1.5
Pump top percentage: 0.48% - $2
End of day move: 1.16% - $5

1/5/2022
Bottom Time: 11:30am
Top Time: 12:30pm
Top to bottom percentage: 0.2% - $0.89
Pump top percentage: 0.24% - $1
End of day move: -1.57% - $death

11/24/2021
Bottom Time: 9:30am - sometime in the open
Top Time: 1pm
Top to bottom percentage: 0.88% - $3
Pump top percentage: 0.15% - $0.6
End of day move: 0.25% - $1.35

10/13/2021
Bottom Time: 10:30pm
Top Time: 1:30pm
Top to bottom percentage: 0.88% - $3
Pump top percentage: 0.31% - $1.35
End of day move: 0.13% - $I don’t care

I’m not gonna do averages this time cause I’m not doing that shit again.
So here’s the average time around 11am for the bottom and 12:30pm for the top

Anyways, for tomorrow, look for a 382 break. If that huge resistance breaks, there is very little volume until 387 so I’m gonna guess that we moonshot to 387 during the morning, although I do have 385 as my minor resistance. If we shit at 382 again, look for 380 and then 378.5

If you’re going to play the minutes release, make sure to buy the contracts like 3-5 minutes before the release because you can capture the IV rush with that as well. Another thing to do is set a sell limit to be safe. If you’re doing SPY, 50% is a good target to set, if it’s SPX, I’ll guess 100% is probably easily achievable. If you’re not setting sell limits, make sure you don’t just smack the bid because you’ll get fucked by the spread. Just keep it at the mid or do the ask you retards and sell quick because it’s hella volatile and quick.

Important shit if you want to enter calls after 2, give it at least like 10 minutes because IV crush will fuck your ass raw if you buy during that release. Also don’t be scared and panic sell if you see hella red because every minutes release had green candles that you can sell at. Also the last 2 times, the minutes releases was hella red at first and then hella green so just relax and either reset your sell limits or sell at profits as soon as you see it.

1 Like

TLDR: Charts for me look bullish, but I’m not ruling out that we absolutely shit the bed tomorrow. Main thing for tomorrow is the FOMC minutes release.

So on the hourly, we broke out of my bear flag and then immediately went back in for round 3 for 382. We didn’t manage to break through and so far in futures, we are not breaking through either. If we do break through tomorrow, this is going to be an explosive move upwards because there is barely any volume between 382 and 387. Because there are also many shorts at 382, I would assume some short covering would happen. Another thing to note is that there is no bearish divergence on the RSI, which is a good sign.

So on the daily, volume was up and higher than the red days that we had. This is a good sign and points to more moves to the upside. I personally think we get rejected near the 21 EMA area, but we’ll see. We broke through the 8 EMA and just range trading for now. Nothing much else to say other than hopefully we break out tomorrow. One thing to keep in mind though is that small pump did post something about how when VIX has a random spike intraday, it leads to a massive shitter the next day. Maybe we reject off 382 again and then completely shit the bed tomorrow. Who knows.

VIX thing
https://forums.ascendedtrading.com/t/vix-leaking-future-volatility-in-2-trading-days/14239/3

So VIX got crushed hard today which is bullish and got crushed at the blue downtrend line. I still want to see VIX at the yellow to mark the top of the rally or even at the blue uptrend to mark the top. Overall, VIX is showing more upside to the markets, although I don’t know how accurate that will be given the random VIX spike on Friday.

Yields are continuing to get dicked down and giving more room for markets to run. We can see this in Nasdaq (QQQ) especially because they are having some amazing outperforming days. Another ETF that’s doing well is the TLT. Maybe something to look into. Overall, seems bullish. Big elephant in the room is that we are right at the 0 line for the 2 year and 10 year inversion. If we start to invert, that’ll mark the signs that we are in a topping process and nearing a recession. If this inversion goes on for weeks, I’m willing to bet we make a new ATH. But if we start to spike up on the inversion, I’m willing to bet that we top near the 50 MA and then go into a full on recession.

So the dollar is hulk dicking up. Not a good sign for the markets, esp when the markets rallied hard, but the dollar did not come down. Something to note is that we have a triple bearish divergence on the dollar now. This is extremely bearish and could signal that the dollar has peaked. If this is the case, I’m willing to bet that we have a huge rally in equities.

Something to note is the crude oil. It got absolutely shat on today. The volume was huge too. This is capitulation and giving more fuel for stocks to have a bullish case. Something to note also is that for the month of June, it’s down heavy. It’s down 7% so could this signal that the CPI data will show signs of peaking and retracting? If this is the case, then maybe the markets will rally even harder.

Something minor to note is the PCC. It’s in no mans land which is kinda good for bulls because it shows that there is a lot more room to run up. But this is also typically the level where we topped so we’ll see what happens tomorrow.

Overall, lots of bullish signs, but until these play out, these are just signs. I want to see us break 382 and then the downtrend line for me to become bullish that June was the bottom.

1 Like

TLDR: I expect more upside until 388 when volume starts to come in. The 382 to 388 zone has no volume so I’m going to guess now that we broke above 382, we’re going to see 388. I personally think we top there and then make another leg lower, but we’ll see.

So fuck this FOMC minutes. Absolute pile of dogshit.

Hourly looks bullish still. RSI is above the MA, not overbought and even though we had the huge shit down, we still bounced at the 8 EMA and holding above the 382 level. If we do come back to retest it, I’m going to enter calls and ride until 385 and reposition because I think we’ll see 388. Something I’m looking for is a bearish divergence forming on SPY to show that we are going to make a new leg lower. If we don’t then there is a possibility that we saw the bottom and it’s up from here.

The daily looks kinda bullish. We got rejected hard at the 21 EMA which isn’t good, but we are above the 8 EMA and the MACD is still bright green. We are inside of the channel still, but we’ll see if we’re able to break out or just shit down. I personally think we get a false breakout to 388 and then shit down, but we’ll see.

VIX is partly the reason why I think we’ll see a top soon because it’s nearing the yellow uptrend. Once VIX reaches that level, I think we’re going to see some aggressive selling coming back into the markets. Another reason is because SPY’s daily RSI still isn’t above 50, which it shows that this move up still isn’t super bullish. I’m going to look for call scalps tomorrow and put swings soon.

Some things to mention is that the 10/2 year yields are now inverted and if we continue to stay inverted, I believe that we’re going to rally up and go through the topping process, which would be making new highs or testing the highs. If the inversion yield start to spike up fast, then I think we won’t make new highs and we’re going into a quick recession, so probably another 20-30% down.

The dollar was up today, which makes me believe that we’re not done selling off. Yields rose today, giving more reason why I think we’re going to sell off. PCC shows nothing and we’re in the middle zone of calls/puts. Oil recovered pretty well from its lows today.

Overall, I expect another push up before we fail. This is because we broke the big 382 zone and then next big zone is 388. Given the yields inverting and the dollar being up, I think we’re going to head into another sell off soon. Good luck everyone

3 Likes

TLDR: I still think we’re going to shit down, but idk where we’ll top anymore.

On the hourly, SPY looks bullish, although I would start to look for a top soon. The RSI is starting to become overbought and when the RSI MA is in the overbought region, we’re nearing a top. What I’ll be looking for is a bearish divergence if we make a new top. Another thing to note is that the MACD is becoming very weak. It’s still bullish and can turn back green, but just something to note. Now that we busted through the no volume zone above 388, we’re in a big volume zone. This probably means chop incoming and range trading days honestly. Unless we just get hard rejected.

SPY on the daily is showing bullishness as the MACD is still green and we’re above the 21 EMA now. One thing to note is that the RSI is still below 50. If we can’t bust through that, this will just be another countertrend rally and not a reversal. So we’ll see tomorrow what happens. We are also on declining buying volume so we’ll see if buyers fizzle out here and start to get shat on.

VIX is finally at the yellow trendline. If VIX starts to bounce, then it’ll be a sign that we’re going to shit. I think we will bounce because there is nothing good that has come out that makes VIX fall lower and show that fear is exiting the markets. I’m going to decide if I want to add onto my UVXY position tomorrow or if VIX just decides to die even further.

Other things to note is that oil was up today, but intraday sold off. Dollar formed a doji and yields were up today. PCC shows more calls entering the markets which is kinda bullish, but also starting to enter into the zone where we saw markets top recently. Overall, these are showing bearish signs, although not really strong signs.

Overall, things are looking bullish, but I’m personally looking for a top and entering put swings. My levels are 391, 393 and 395 (right before gap fill).

2 Likes

SG levels from today:

Vol trigger is at 3910 (below that, MMs reinforce directional movement) and zero gamma level is 4000. We can therefore expect some volatility as long as we remain below the SPX 3900 level.

Of concern is the lack of support below the 3800 level - if we breach that, there is not much by way of resistance, and we could keep falling. Especially if induced by news, such as CPI on Wed.

Because I’m gonna in Korea from 7/14 to 7/30, I’m prob not gonna update this thread for a bit. Also cause everyday last week was red for me because my trade immediately reversed me, made me sell and then went my way and that’s pissing me off.

SPY on the hourly looks bearish because we rejected off the 21 EMA and riding down the 8 EMA. Also we’re rejecting off the RSI MA. Even though this does seem bearish, I honestly think that tomorrow is gonna be another relatively flat day because CPI is tomorrow and everyone is waiting for it. I’m still gonna bet on red day tomorrow, although not too much.

SPY on the daily is bearish and something to note is that the RSI is turning at the 50 level again. This is bearish and shows that this is so far not a reversal into a bull market and more of just a countertrend rally. Low key just seems like a bear flag, but we’ll see what happens.

VIX went up today and looking like we’re bouncing off some retard trend lines. We’ll see what happens and if we continue to go up higher. If we go back to the 30+ level, I’m gonna guess we’re gonna be heading towards the 200 MA which is a little higher than 350.

I’m not gonna do much more TA because the main event is CPI Wednesday and that’ll determine the trend anyways. I expect tomorrow to be choppy and flat. CPI is expected to come in hot, but there is some evidence that it will come in better than expected. Overall, until Wednesday, no real point of TA and I won’t update this tomorrow and prob make a last update Wednesday before heading off to Korea to fatten up. Good luck all. To make it clear, I’m personally bearish and think we go to 350 because the Fed is still hawkish and I don’t think markets will bottom until the Fed starts to become dovish. When that happens, maybe next FOMC meeting, I think we’ll have a huge rally like to the 50 MA on the weekly.

1 Like

Updated SG levels - 3800 is the magnet.

2 Likes

TLDR: I think we’re gonna move down towards the 200 MA on the weekly (a little over 350 on spy) before bouncing hard.

So SPY broke out of my bear flag and we’ll see if that plays out. So far SPY is actually holding up pretty well considering the shitty CPI numbers. One thing to keep in mind for the remainder of July is that it’s earnings season again with banks reporting this Friday along with FOMC later on and I think GDP numbers coming up. Overall, SPY looks bearish and this looks like the start of the next leg down, we’ll see how monthly options expiry does to SPY this Friday too.

VIX didn’t spike up too much today, actually ending down which is weird. Maybe a good time to load up on cheap puts while IV is low. But this is something to keep in mind for, esp trying to find exit points of puts since around 35 on VIX has been the local bottoms of this market recently.

Moving on from the brief TA, I wanna talk about why I think we’re going to see a big rebound and not head directly into a recession from here.

Orange is SPX, the candles are the yield inversion.

Looking at the 10 year and 2 year yield inversions in the previous recessions, when the yields inverted, the markets did make a new bottom, but rallied hard soon after and made new highs. This happens when the yields remain inverted for multiple weeks, showing that recession is coming. When the yields start to uninvert, the big drops in markets comes.

In the dot com bubble crash, we saw the same thing happen. Yields invert, market goes lower before bouncing hard. Then when yields start to spike up and uninvert, the crash and recession comes. I think that a similar thing is happening right now where we’re going to make a new leg lower and then bounce hard - whether it’s just making a lower high, but still a huge move up or making new highs.

Another reason why I don’t think we’re in a recession or heading directly into one is because so far, all the states are showing increasing economic activity. This possibly shows that we’re not in a recession and this dump is because of the Fed being hella hawkish. Another thing to note is that the GDP so far hasn’t had a 2 negative reading in a row, which is the definition of recession. Right now, the second quarter is negative, but it’s not final and could change a lot. Just recently it went from -2% to -1%. We’ll have to see what happens, but right now, the economy stats doesn’t really point towards a recession.

Overall, I’m bearish until SPY reaches around the 350 area when we’ll see a huge bounce. I’m not a perma bull because I expect a recession within a year and think that we’ll see a huge crash because the fed blew the bubble too big, but right now, I think people are going way too bearish thinking we’re gonna head directly towards 2008. Also if a recession happens right now, this is going to be the most expected recession which usually means it’s not gonna happen. Good luck everyone and hope yall make money.

2 Likes

Forgot to share the SPX gamma levels earlier.

They are beefy, for this time of the month, right after opex! So folks are still hedged very well. The supports and resistances are mostly between 3800 and 4000 though, so if earnings are divergent enough from expectations to take us on either side of that channel, we could expect that momentum to continue hard for a bit.

5 Likes

We are inching toward that SPX 4000 mark. We are also just over the line where we are in positive gamma territory, which reduces volatility.

If we breach 4000 and manage to hold it, that will be positive indeed, and we can expect the underlying market currents to be in our favor. 4000 is rather beefy though so will act as resistance for a bit.

Incidentally, SG is also reporting that liquidity is improving, which is good.

https://twitter.com/spotgamma/status/1550094275890782213

Overall, unless large caps muck up earnings, we could have a nice tailwind here.

1 Like

Here is the SPX gamma profile going into tomorrow. SPX 4000 towers over everything else. Will have to wait till tomorrow’s Note from SG, but both vol trigger and zero gamma levels were > 3900 on Friday. Just based on this, assuming no major news, Mon and Tue will probably be a bit like the calm before the storm, with us pegged around 4000 into Wed. And if there is a dislocation, we’ll probably drift back toward 4000.

This week is the week in July, and between the FOMC decision and meeting at 2.00pm/2.30pm EST, and the Q2 GDP numbers at 8.30am EST, things could end up looking rather different by the end of the week.

Two additional considerations going into this week. First, VIX is lower than it has been all year, going into FOMC meetings. Unless there is a massive spike in VIX on Monday or Tuesday, we’ll be going in with the attitude that both FOMC decisions and GDP are “priced in.”

Second, it is difficult to see how we would be surprised on either the Fed Rate or the GDP rate. The Fed telegraphs or leaks any deviations from expectation because it does not want to surprise markets. And the AtlantaFed GDPNow projections have done a good job anchoring us at the -1.6% to -2.0% range for a while, so whatever the official numbers are might actually be better than that.

While all this makes for a quiet week if expectations are met, surprises might be interesting, in that rallies might be more powerful than pullbacks:

  • If there is a negative surprise, VIX will flare up, which will cause MMs to hedge for a falling market by shorting (assuming we fall below the vol trigger level), but there are quite a few beefy put levels down to 3800, so that should slow the fall.
  • However, if there is a positive surprise, we might inch up to 4100 and then 4200, though because we are above the vol trigger, MMs will hedge in the opposite direction, making them more sustained than explosive.
8 Likes

Well well… looks like SPX gamma levels are looking up. Put levels have withered, and call levels are getting stronger. Zero gamma was at 3994 and vol trigger at 3960; since SPX is at 4072, we are in steady waters. In and of itself, this suggests markets will move upward if left to its own devices, and treat that 4000 level as support for now.

Now… SPX has moved up ~10% in 10 days already, which in itself is a bit crazy. But such are bear market rallies.

3 Likes

Going into next week, underlying option structure of SPX/SPY continues to show bullish signs. In fact, more bullish than we’ve seen in a while.

Call strike gammas have beefed up a bit more:

Call buying has also been healthy in the last week, which points to sustained feelings of bullishness.

There will almost always be put buying for hedging purposes - its the relative call buying amounts, or the absence thereof, that is considered an indicator of sentiment.

We do have opex coming up in two weeks. Note that usually, prices fall into opex more often than not, and then almost as often, bounce back. The only time this did not happen was in March when SPX rose into opex, and kept rising. That was a vanna (aka vol unwind) rally at first, which turned into a brief bull run.

Although we are missing the vanna rally here because VIX has been a bit of a wimp, we are on a steady march upward. This time, I expect MMs to support an upward move, except right after opex where they may de-hedge a bunch of those calls, which could provide some headwind.

Unless one of the scheduled economic reports turn out to be a major shocker, we could actually rally into opex, and then rally some more. With a brief 1-3 day pause right after opex as some call de-hedging takes place.

In fact, if we don’t tap out like we did between the May and June opexes, we could hit SPX 4300-4400 by end of Aug.

Will keep a close eye on these levels next week to see if we have any reversals.

5 Likes

Update on the signs to look for a bottom: The Think Tank: Macro Discussion and Opportunities Brainstorming - #27 by Kevin

BULLISH: DXY (the US dollar) rejecting off its uptrend line. Possible breakdown happening?

BULLISH(?): 10 year yield not holding 2.7%, but it’s still relatively up. Hasn’t broken down that far.

BEARISH (?): 10/2 year yield spread is not recovering, but it may have paused for now

BULLISH: As @The_Ni pointed out, market participants are buying call options

UNDETERMINED: Inflation data and consequence on fed rate hike dovishness vs hawkishness

Personally I’m still overall bearish because I think we are going to see sustained elevated inflation and earnings recession, but don’t ask me how the market should react because apparently sometimes everything is “priced in” and sometimes it’s not.

3 Likes

I personally think that the 10y and 2y yields continuing to invert is bullish as it signals that we’re in a topping phase. Usually this signals the ends of bull markets and a huge move upwards before heading into a recession. You can check out the how the yield curves reacted during the 2000’s and 2008 recession.

Also in terms of inflation, here’s an interesting chart to watch.

Markets right now are looking for an inflation peak and this chart shows that stocks and yields tend to peak way before inflation does. Idk how accurate this chart is, but it’s interesting to see as the 10 year so far has peaked and SPY so far has made a bottom. We’ll see if this is true and we have seen the bottom and market is starting to price in peak inflation.

2 Likes

This topic was automatically closed 14 days after the last reply. New replies are no longer allowed.