SPY Tech Anal: June might be bullish again but inverse Yong is the best

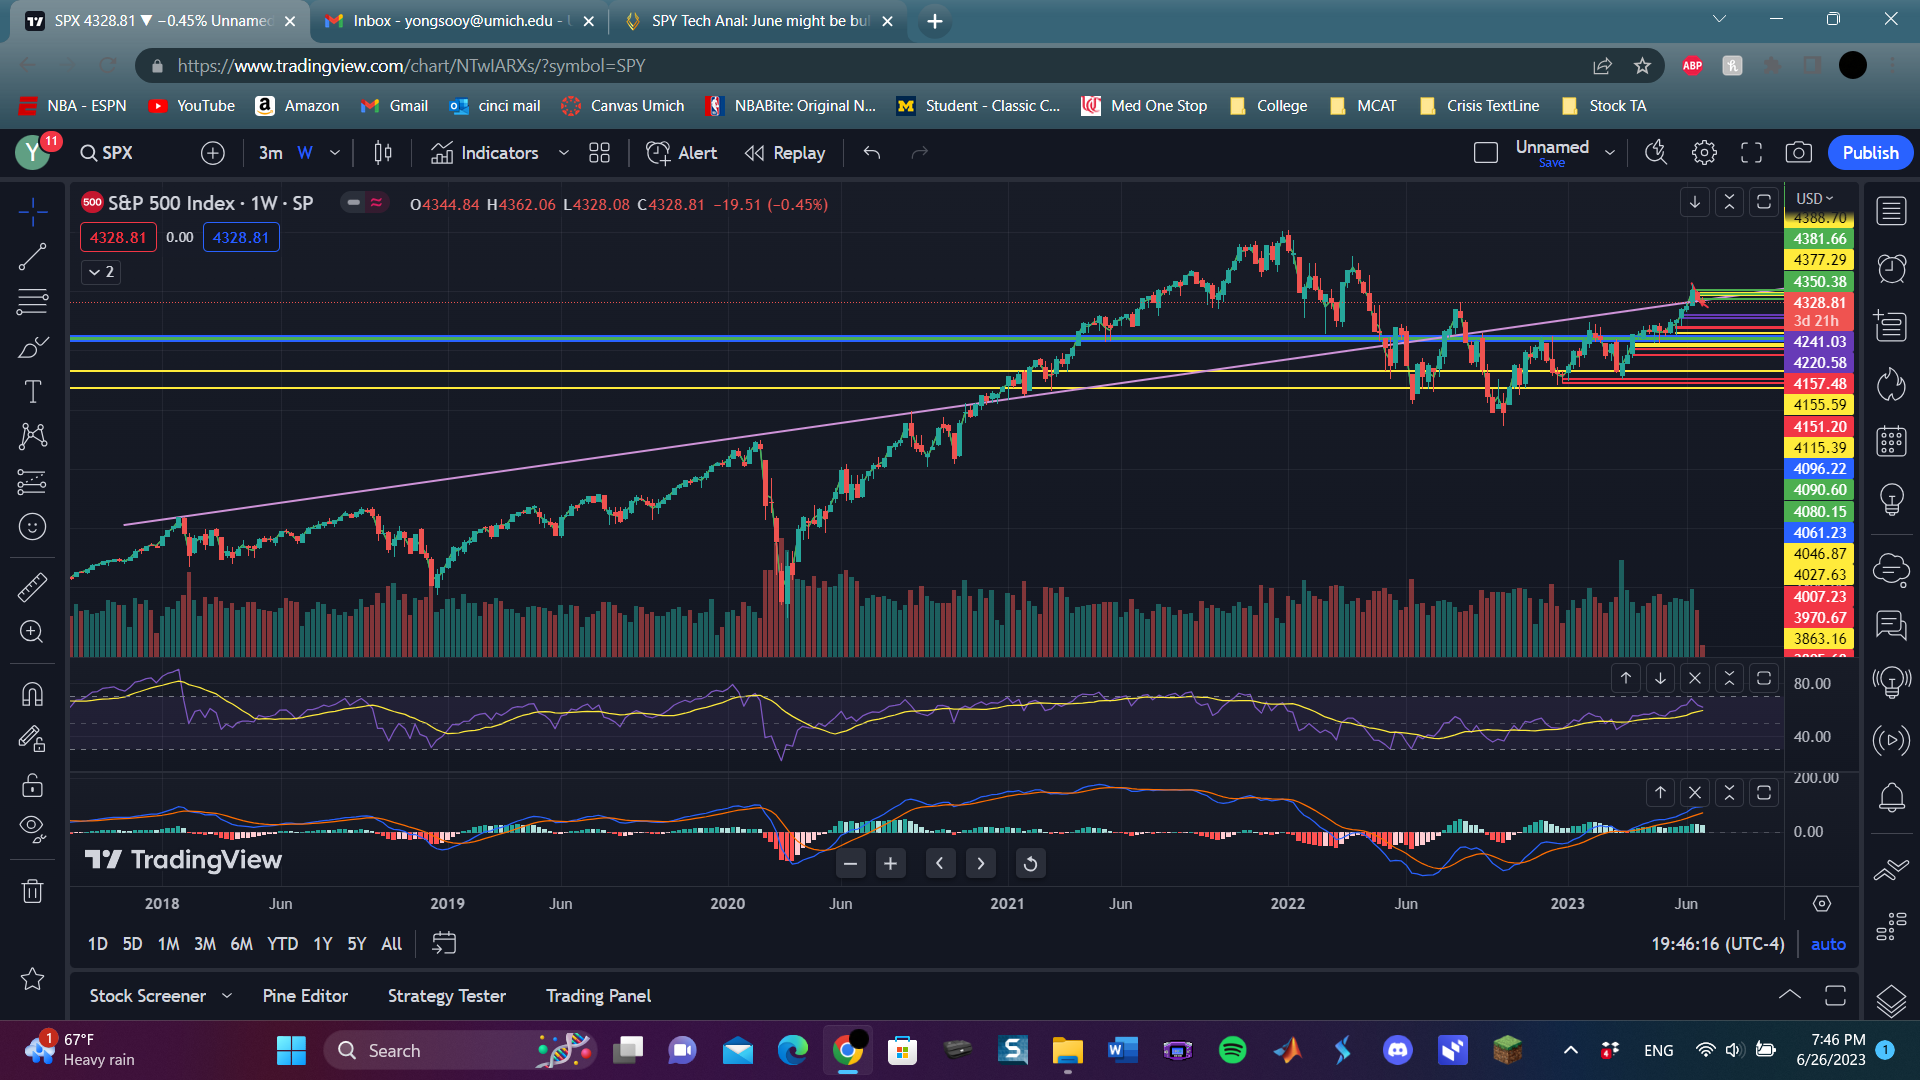
TLDR: Still low momentum and breath, but all dips are getting bought up so play the trend.

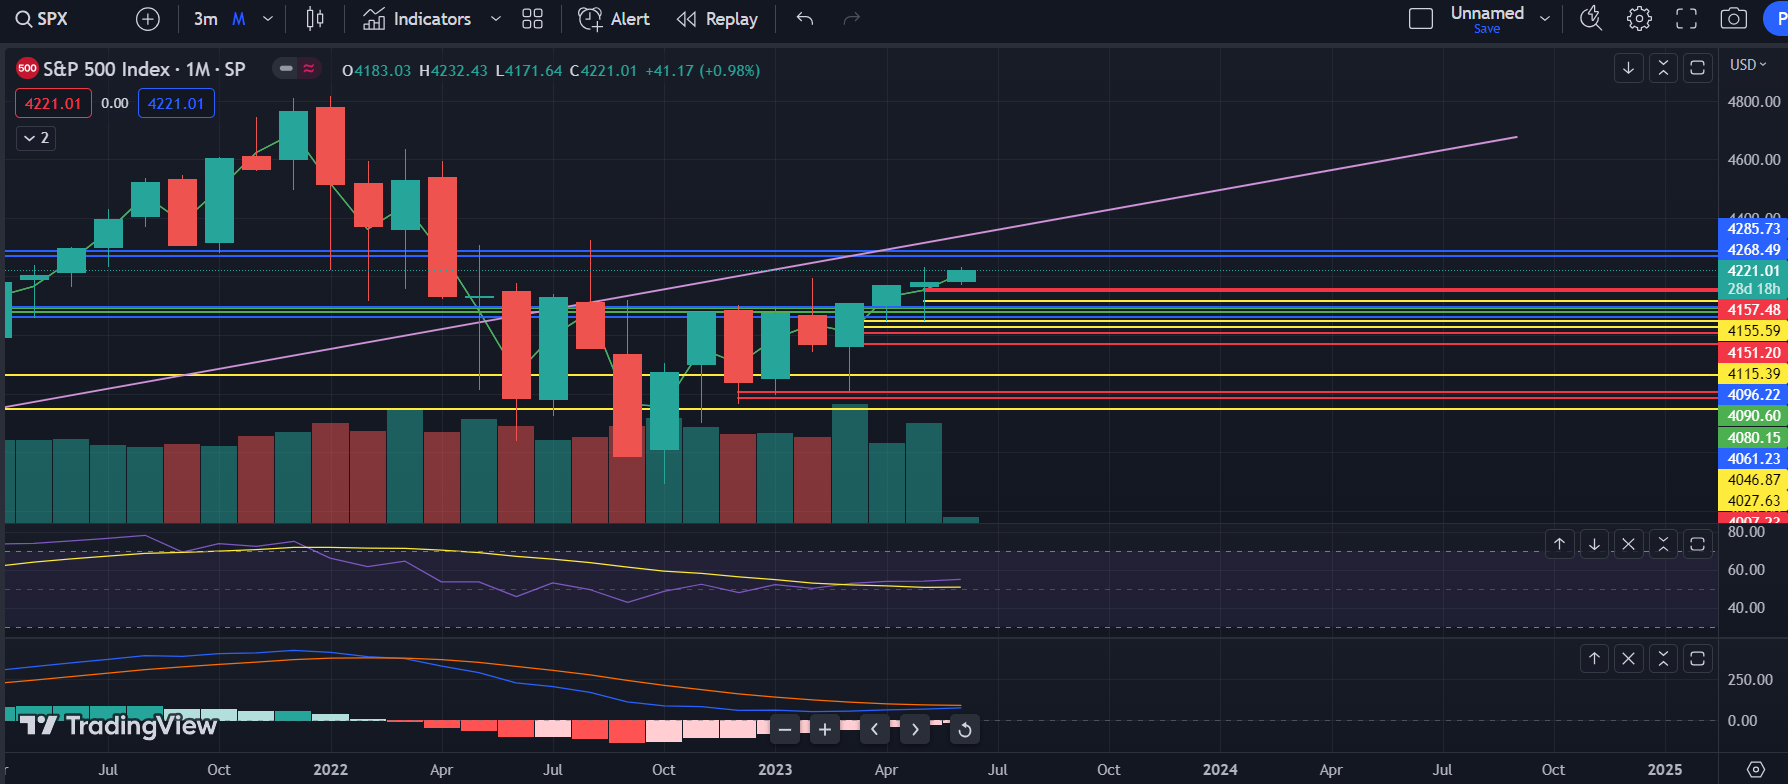
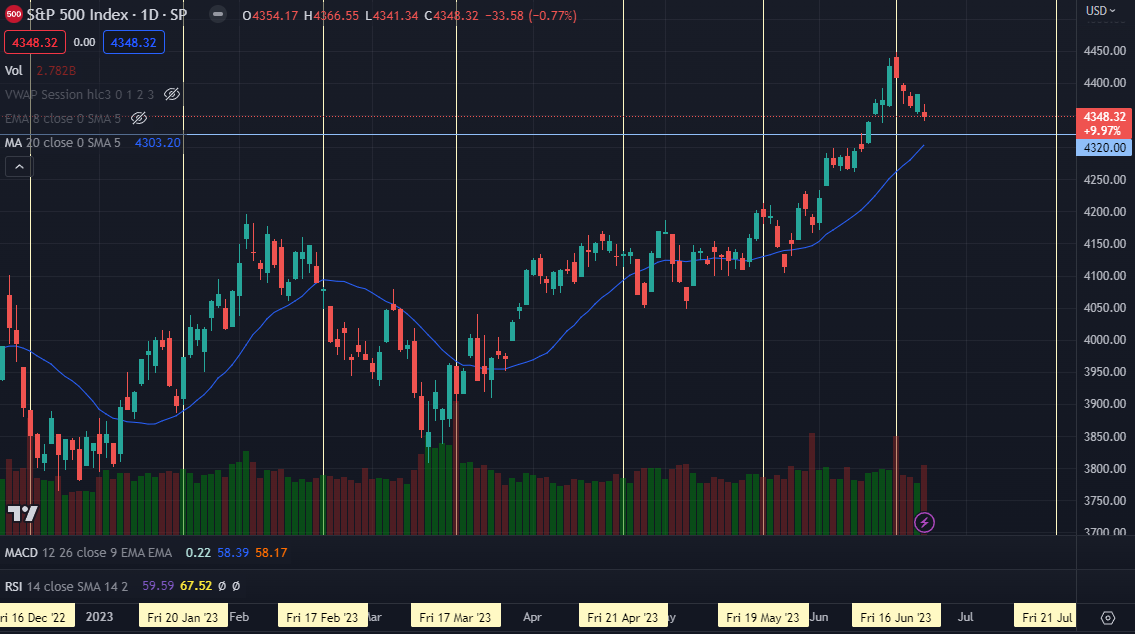
The monthyl chart is looking bullish as every dip was bought up and we had increasing volume on this grind up. The RSI and the MACD aren’t as bullish and strong as I would like, but still a strong uptrend. Nothing much else to say.

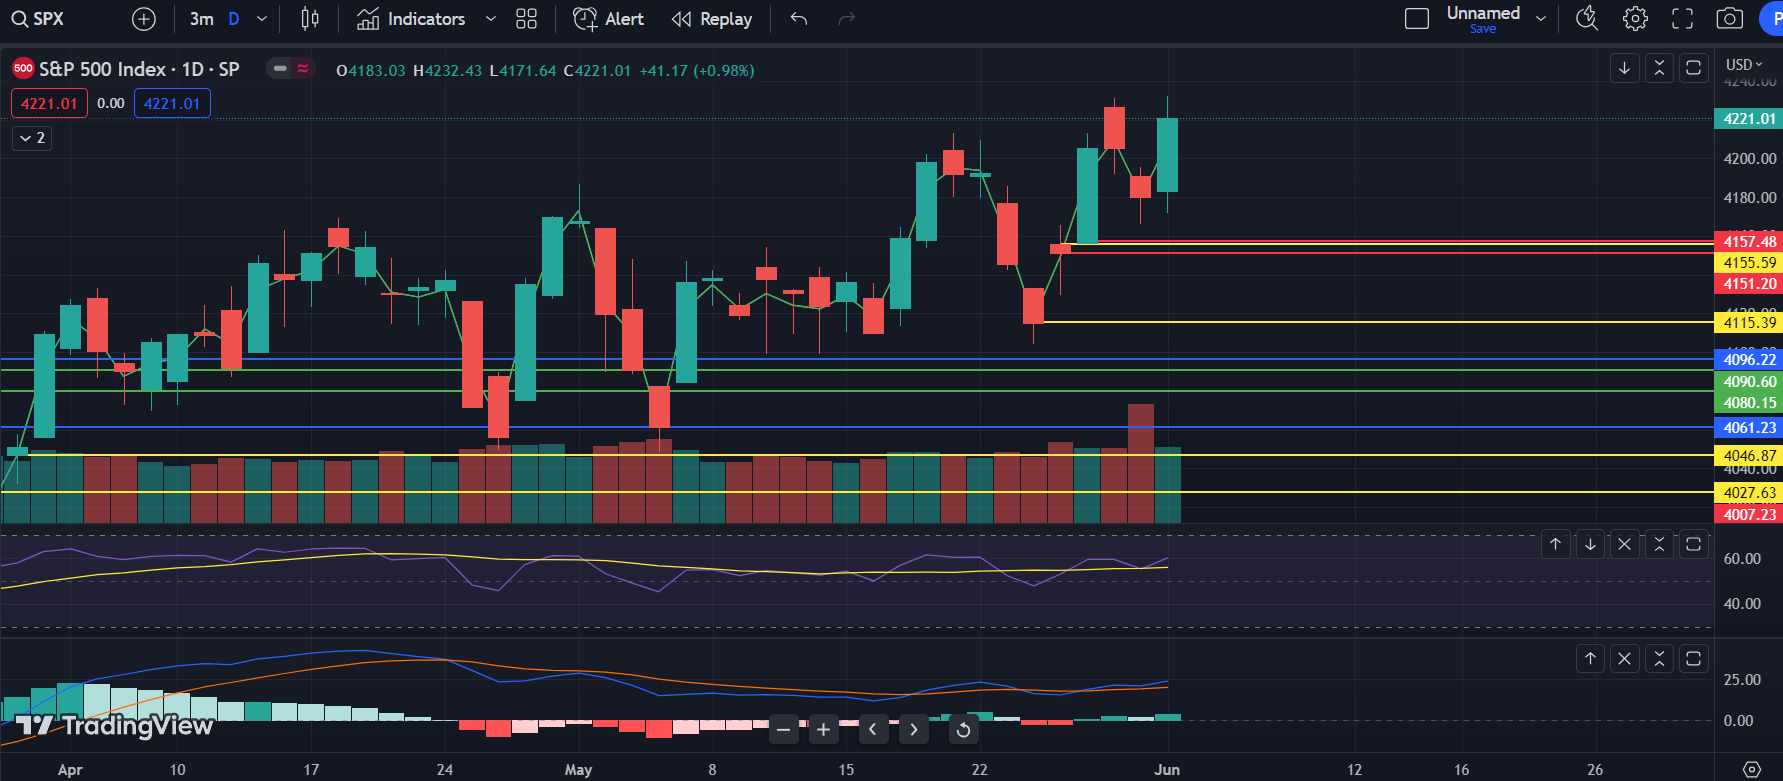
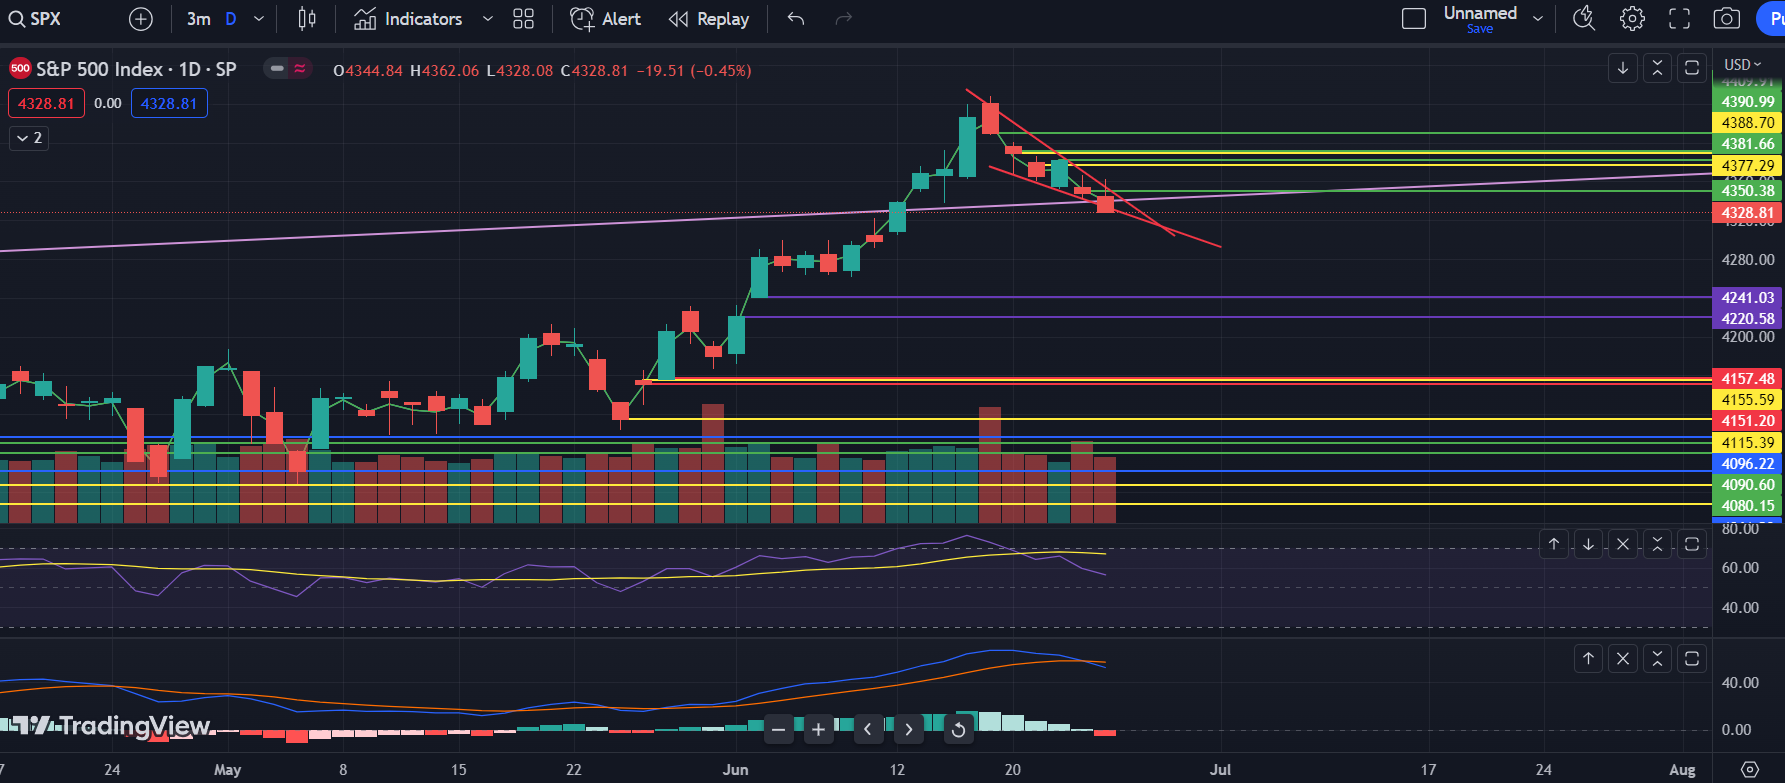
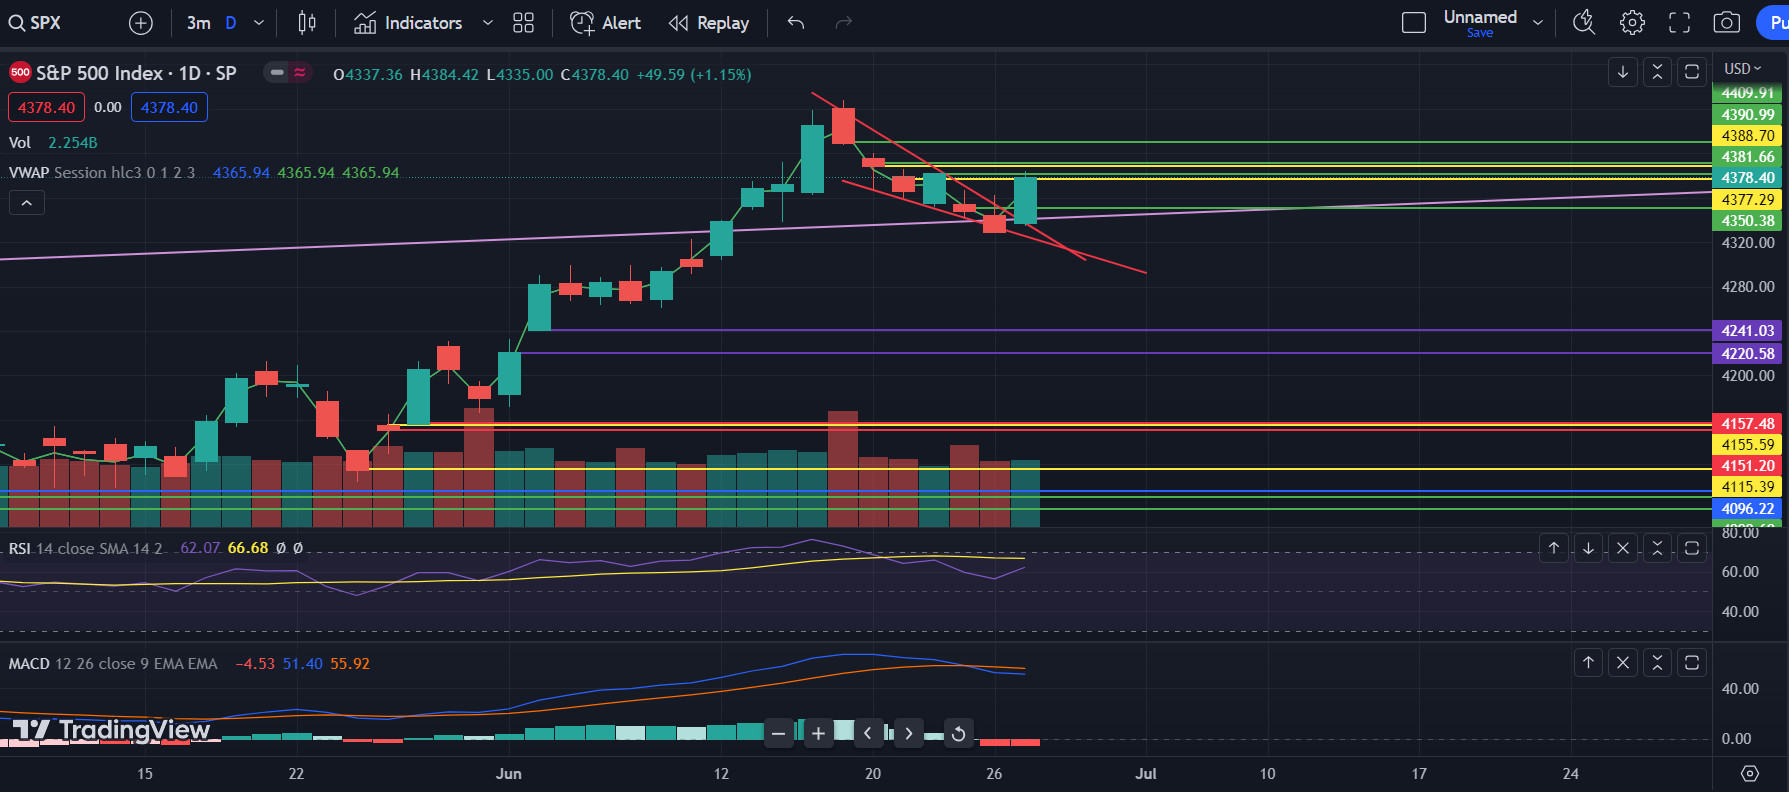
On the daily chart, we filled the gap and retested the high. There’s a chance that this plays out to be a double top, but on the daily, it’s too hard to see if there’s a bearish divergence on the RSI and MACD. Not much else to say on the daily other than lower volume than yesterday, but a strong green candle.

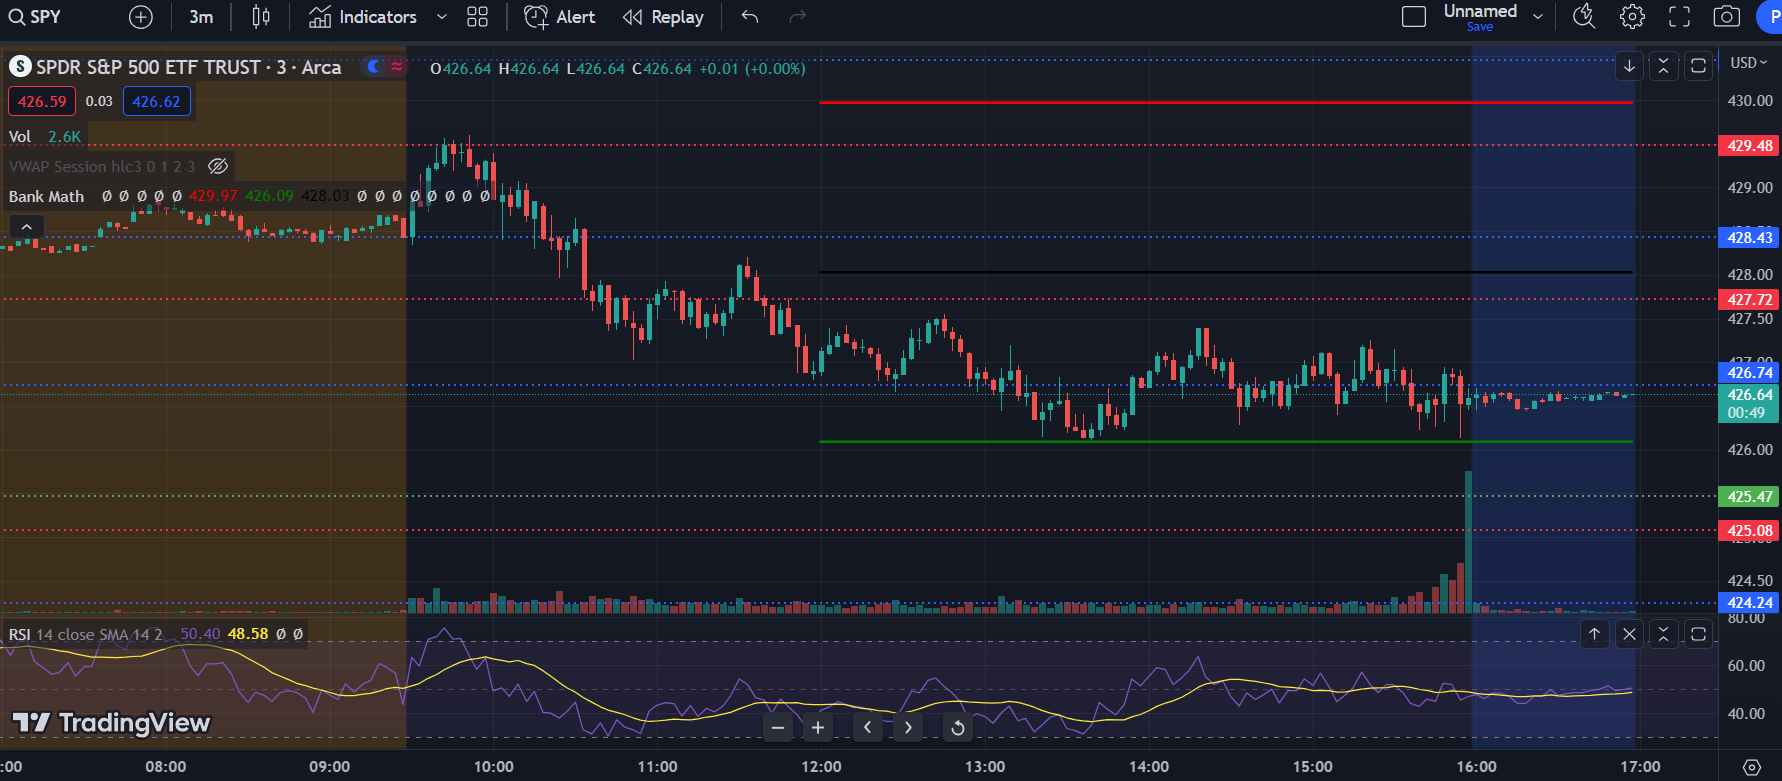
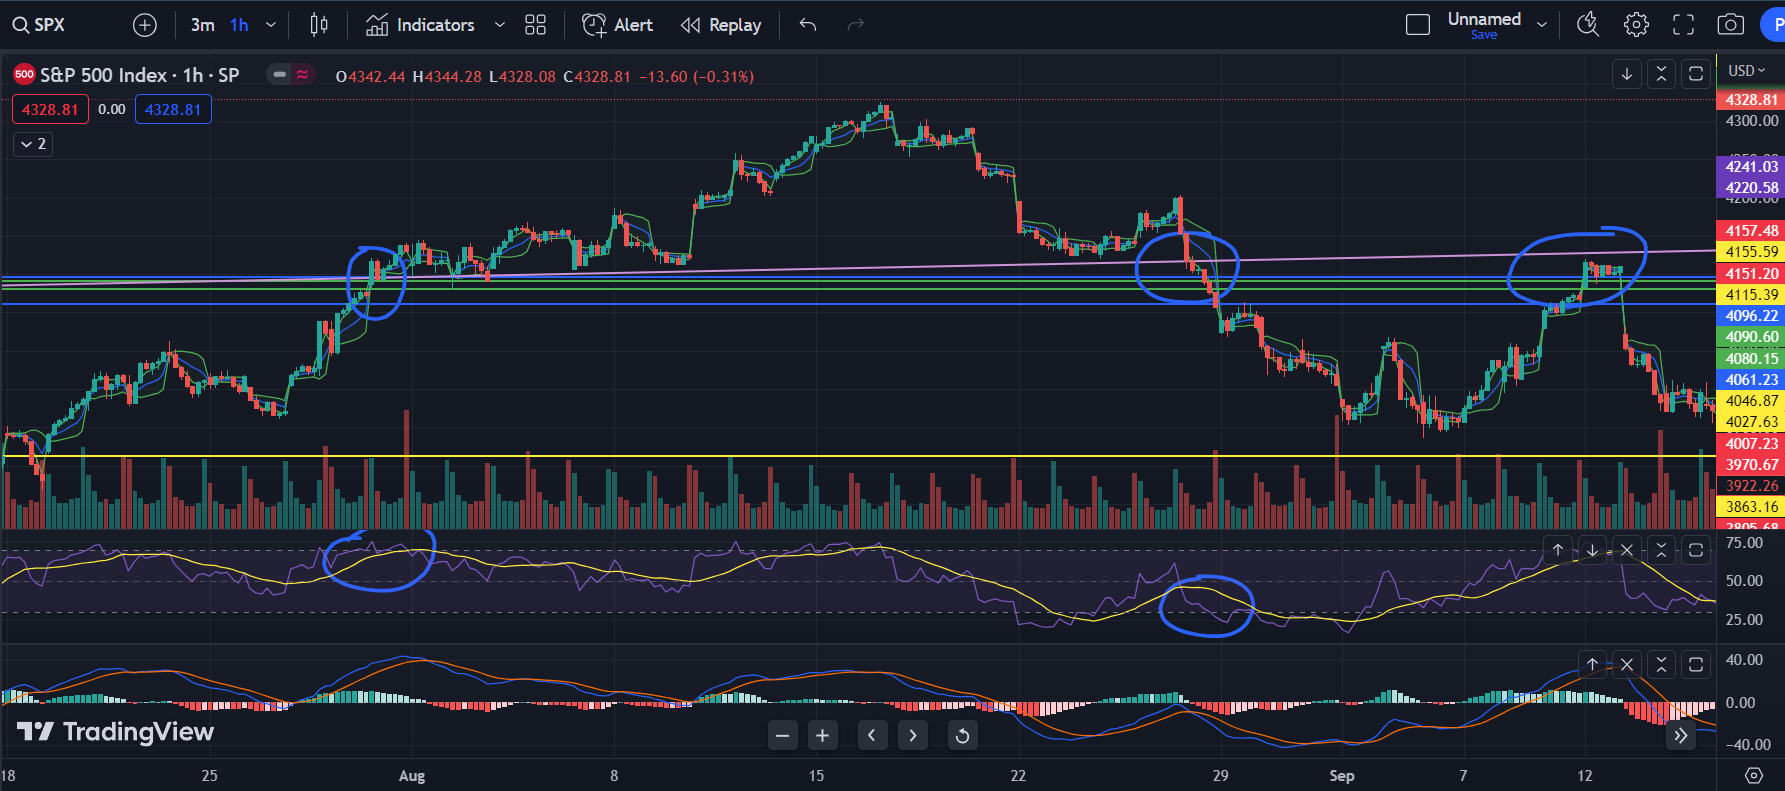
On the hourly, we have a bearish divergence on the RSI and MACD so maybe there’s another dip incoming, but we’ll see. So far, all dips have been bought and we’re bouncing off the gap fill level.

One thing that adds to the sentiment that another dip may come is that the VIX moved 10%. Because it moved down 10%, there’s a good chance that markets go down within 2 trading days.

The yields are going down which is good for bulls and tech, which is leading the charge up.

The dollar also went down a little which is good for the markets, but we’ll see if this is just setting up a higher low to head to higher highs.

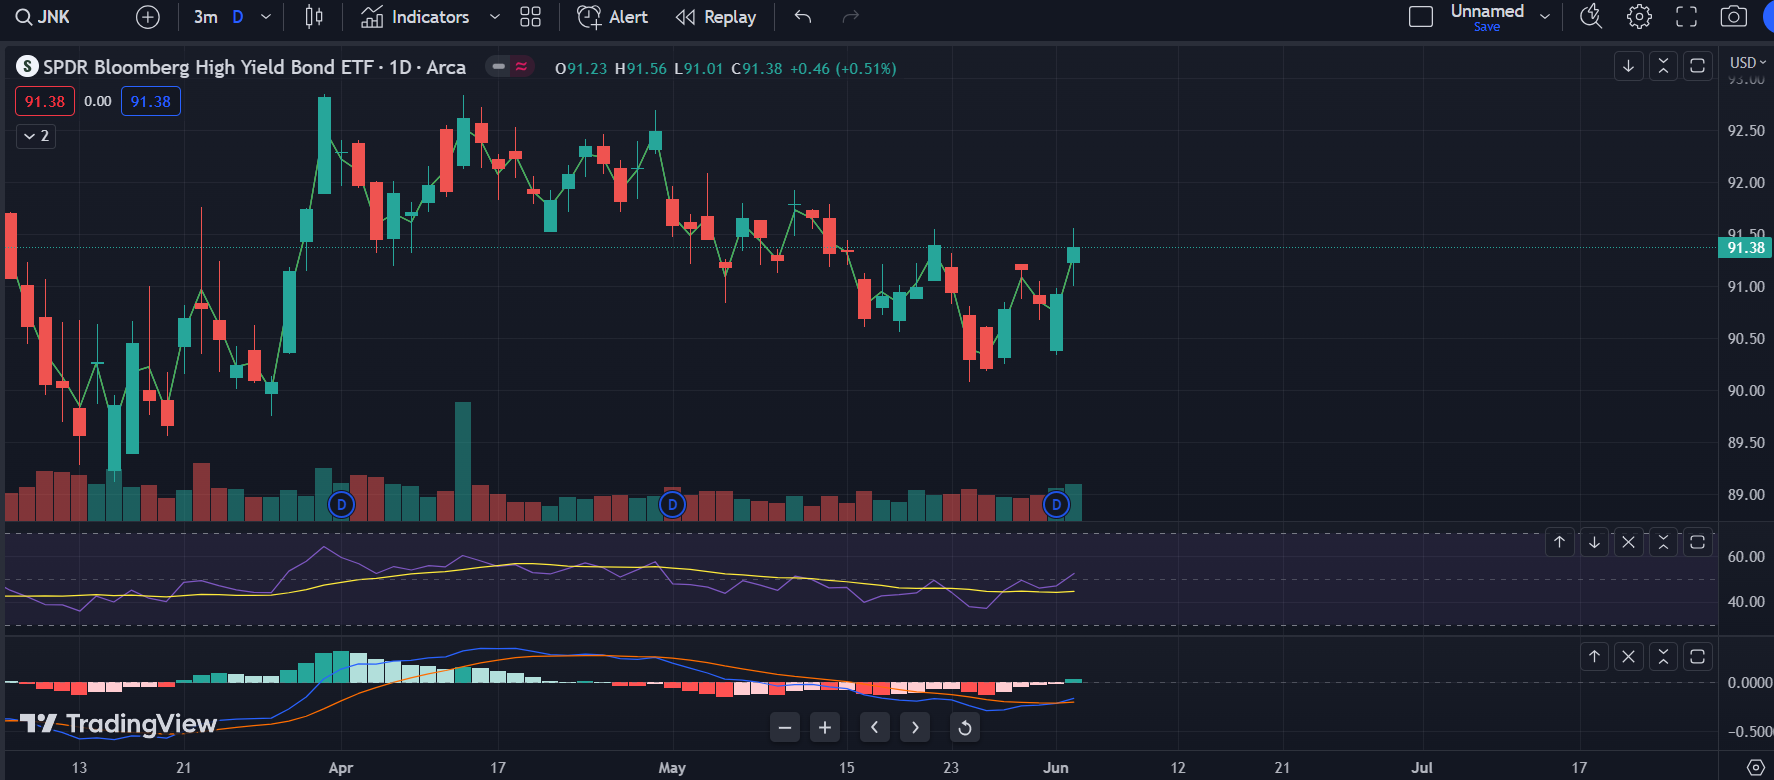
The junk bonds are looking strong, but still not making higher highs so there’s a bearish divergence with the SPX. Not a good sign for the markets, but each dip has been bought up so who knows if this even matters at this point.

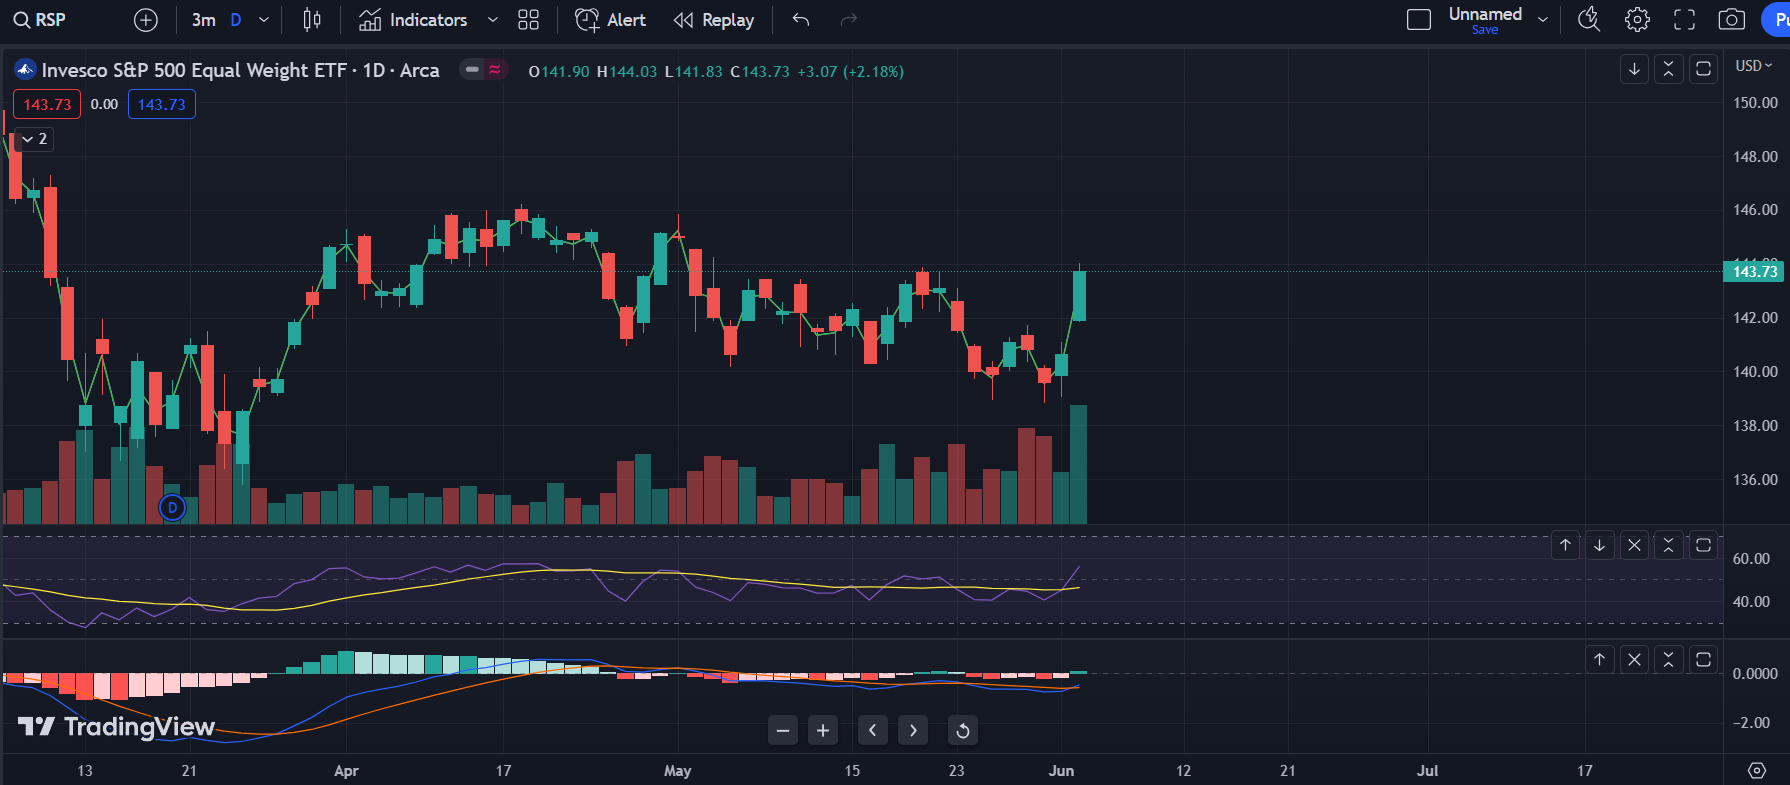
The equal weight SPX is also making a lower high. It’s been making a lower high for the last 3-4 tops though, so we’ll see if this ever plays out or if I’m just drawing crayons.

Overall, still bearish signs, but since every dip is getting bought, there’s really no reason to enter bearish positions right now. Good luck all on this new month.

TLDR: Bull season until it’s not

Hourly is at an overextended range on the RSI, so I wouldn’t be surprised if we go up higher to form a bearish divergence to have a pullback after we range or get a tiny pullback. No bigger bearish divergence anymore so we’ll see how this plays out.

On the daily, we have increasing volume which is good for bulls. We have many gaps underneath so we’ll see if we ever get a bigger pullback to fill those. Also we are nearing the overextended range on the RSI for the first time in like a year so we’ll see if we top soon.

Weekly closed strong, but we did have lower volume looking at SPY. Overall, very bullish and no need to go bearish until we stop this trend.

Some other good signs that are showing is that junk bonds are finally not making lower highs and is looking like they want to make a higher high.

Also on the equal weight SPX, we have huge volume and on pace to make a higher high for the first time. So there are lots more bullish signs showing now.

Overall, lots of bearish signs are starting to unwind so we’ll see if we start a new bull market and we keep melting up. No need to get into bearish positions until this strong trend changes, so good luck all and keep printing them calls.

The positional analysis for next week is pretty much what it was last week. Vol trigger is at 4190 and call wall is at 4300. The 6/30 JPM collar at 4320 will only get stronger as a magnet as we hover close to it and it gets closer to its expiration.

Below is the SPX gamma complex, which has moved up compared to last week too. Unlike last week though, we have covered most of the ground toward 4300, so upside seems to be limited until call wall moves again.

Something interesting from Friday - breadth actually returned to the markets. This makes the runup more resilient. Note how minerals and energy were up 3%+ and industrials just below 3%!

image

Thing to keep an eye on:

  • T-bill issuances that start this week, and whether they are offset with RR draws or actually take out liquidity from markets (discussed in Discord here)
  • Fixed strike vol going up as markets go up, which is seen as a possible sign of an impending blow-off-the-top
  • FOMC on 6/14 - markets are pricing in a “skip” with 74% probability
  • Of course, 6/16 opex - highly dependent on delta and gamma positioning at the end of this week

All in, we can expect markets to move up into the 4300-4320 area, and stay there, while the liquidity situation resolves.

3 Likes

Interesting chart here which speaks volumes as to where the majority of the money is right now Discord

image

1 Like

I found this indicator that helps a ton during range days. It basically sets up a upper level and a lower level as soon as the day starts so it gives you an idea where to be careful on calls/ puts when you trade. It helped me not to fomo or buy calls when upside was limited. During trend days, this won’t be that useful and it doesn’t work 100% of the time, but it helps you keep in mind levels so you don’t try to overplay the trend during a range.

The thick red line today was at 430 and the green line was at 426. Basically tagged the lower level perfectly. I’m liking this because it helps me keep my bias in check and not overplay a trend in one day.

Quick note as am on the road and have not had time for a deep dive.

It is triple-witching opex today. A TON of calls are expiring today in the money (Image 1, from SG). De-hedging behavior should create some weakness on the other side, and we might have a few red days next week as MMs rebalance.

Having said that, there is reason to expect this downward adjustment to convert into a correction unless it is matched by a macro event, or a significant reduction in liquidity from the Treasury. Which we are not quite seeing yet. (Image 2, source)

We should clues on market’s preferred direction of market based on positional analysis toward the end of next week, once the post quarterly opex adjustments are complete.

3 Likes

This expectation materialized, and worked out well. Now that we are on the other side of opex, options don’t really have much “power” anymore, so market is free to move without all that gamma interference.

Not sure on likely direction now, will give it till the end of this week for more clues.

Bullish reasons are: a) SPX Call Wall has now moved up to 4500, b) vol trigger is around 4310, so we’re in comfortably positive gamma territory, and c) there isn’t actually any good immediate reason to be bearish.

Bearish reasons are: a) market still seems overextended - cleanly over 20SMA, and resting above 8EMA, and b) SPX gapped down at open both yesterday and today and did not close the gap fully, though almost did so today.

There is the JPM collar at 4320 that expires on 6/30 - if we get close to that, that could end up being a magnet into the end of next week. (Have position for this possibility already)

Otherwise, if we close Fri over 4400, I’ll likely take bullish positions into end of the month.

3 Likes

Post post-opex-correction continued into the end of last week. Will it continue?

I don’t have a strong feeling either way, and starting with the expectation that we’ll be stuck in the 4320-4400 range next week.

4320 being the lower bound because that is the JPM collar call strike expiring on 6/30 is at. And 4400 being the upper bound because the Call Wall has moved down to that level from 4500. The move lower by the call wall is bearish, but vol trigger is at 4305 so we have some room before things start getting wonky.

Also expecting some support from whatever remains of the end-of-quarter flows as funds rebalance themselves.

A bit too early to see clues for this, but unless we get stuck under 4320 at the end of this week, we could rally again into July opex after skimming off that level.

4 Likes

TLDR: I expect much more downside from here before a sizable rally up, but we’ll see what happens.

So on the hourly, we’re in a descending wedge which is bullish so we could have a bounce incoming soon. But The biggest thing that I’m seeing is that RSI and MACD aren’t in massive oversold territories and we broke the purple trend line and everytime we broke it since 2018, it led to massive moves without a pullback.

The daily candle shows a follow through bearish which makes me think that we’re gonna have more downside, esp with us having a solid close red. MACD crossed over as well which has led to sizable pullbacks.

Now on the weekly chart, the purple line connects a lot of the tops and bottoms since 2018. It’s a major trendline that I’ve been following for a while now and it’s been great.

So let me give some examples here. When we broke above the trendline, even though we went sideways for a bit, we ended up heading much higher in a melt up move even though the RSI was in the overbought territory without a pullback. When we broke below, we were in an oversold territory, but we still melted down heavily without a pullback. Then we rallied up to the trendline before rejecting and going back down.

Now some other instances. We broke below in a near oversold territory, consolidated and then went a lot lower. We did have a rally up and broke above the trendline for a brief moment, but it ended up into nothing which I’m gonna put as an outlier. Then the next instance is when we broke above while being very overbought. We ended up heading a good amount higher and bouncing off the trendline a good amount testing the highs multiple times while overbought. Then when we broke below, we were oversold, yet we headed a lot lower without a pullback.

Overall, I’m seeing that this trendline break has continuously led to big moves without pullbacks and I’m willing to bet it does it again given the Powell hawkish statements and OPEX over. I’m gonna wait for the first hourly candle to close tomorrow and see if this isn’t just a false breakdown and then gonna enter swing puts to bet on more downside. How much more lower? Fuck should I know I’m not a psychic. But I’m betting on 1.25-1.6% more down looking at the consolidation level on the hourly and the next gap fill.

But one thing to keep in mind is that the equal weight SPX had a good green day, maybe signaling a rally soon, but divergences with this can last a fuck long time so just a caution.

Junk bonds also had a green day, maybe warning of a rally, but given how much lower we went on junk bonds, I’m gonna still bet on more downside longer term. But good to keep in mind that we’re probably not gonna go down another 3% from here.

Another reason why I’m expecting more downside even if we have a rally is that the smart money flow is massively bearish. Everytime this has happened, we had a big move down.

Overall, I am expecting more downside and expect a countertrend rally afterwards, then more downside to fill the gaps below. Then maybe we continue the melt up or prove that this was just a bear market rally and we head into poverty and eating crickets. Good luck all.

2 Likes

Damn inverse Yong really is undefeated. We’ll see if Powell comes in hawkish as shit tomorrow.

On the hourly, we filled the first gap and very close to filling the yellow gap. I was looking for the gap fills and I think we’re going to fill the yellow and then maybe get shit down to continue the downtrend as RSI and MACD aren’t looking that strong even with the strong rally today.

On the daily, we had a big fuck you fake breakout of my purple trendline so fuck you bulls. But we’ll see if this is the lower high set up before we get fucked over. Powell is talking tomorrow so maybe he shits the markets or gets us to rally hard because money printer and all.

Now one thing that makes me cautious about this being the end of the day is that junk bonds and equal weight rallied hard today. This shows inner strength within markets which I don’t really want to see as a bear. So there’s a good chance that we probably have a green day tomorrow as well, but this is just astrology for crayon eating retards so Powell could just shit us down.

Overall, I think if Powell is neutral or dovish, we’ll continue to head higher to fill gaps, but if he’s hawkish, we’re gonna turn back around and start drilling new assholes.

2 Likes