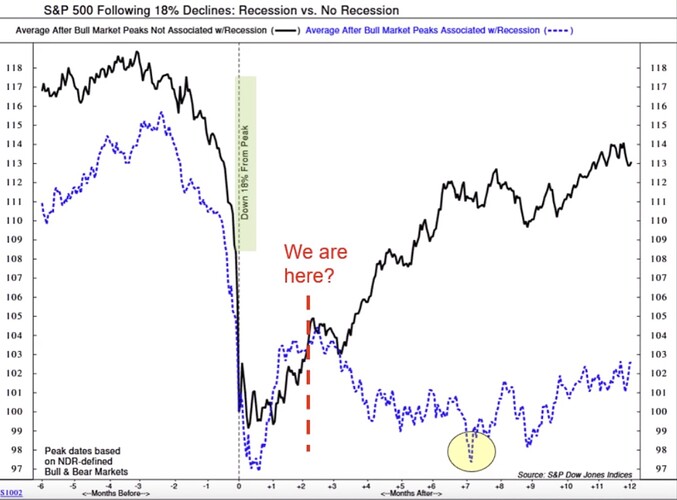
Stagflation leading to Recession - The Kodiak Bear Thesis

Unemployment Rate comes out at 8:30 AM EST today (Friday) in premarket.

Bulls should be looking for a slightly high number to indicate that the economy is slowing, “soft landing” style, based on the rate hikes so far.

Bears should be looking for a significantly high or significantly low number:

  • Significantly high unemployment would mean the economy is slowing too fast, i.e. recession fears. Recessions are not good for the stock market.
  • Significantly low unemployment means the Federal Reserve needs to tighten more aggressively.
3 Likes

A few notable points from this article,

"As prices jump across the board, consumers are increasingly relying on credit cards to make ends meet.
The number of people with credit cards and personal loans hit record highs in the second quarter of 2022, according to TransUnion’s latest report released Thursday.

The tally of total credit cards exceeded 500 million for the first time ever, led by originations among Generation Z, or adults ages 18 to 25.

Overall, an additional 233 million new credit accounts were opened in the second quarter, the most since 2008, according to a separate report from the Federal Reserve Bank of New York.
Credit card balances also jumped 13% during the second quarter, the largest year-over-year increase in more than 20 years."

and finally the perspective on repayment from the VP at TransUnion US,

“Consumers are facing several challenges that are impacting their finances on a day-to-day basis, namely high inflation and rising interest rates,” Raneri said. “These challenges, though, are happening against a backdrop where employment opportunities are still plentiful and jobless levels remain low.”
As long as “people have jobs,” she added, “they can figure out more of the day to day.”

We have discussed this at length here but I’m curious with these signals of continued strong credit impulse when we will see actual signs of more restrictive credit expansion, since we know changes in monetary policy carry a 3-6 month lag. I also cant help but think that labor itself is an oversimplification of the larger economic picture. Americans can very well have a job but overextend themselves financially which is what we may be seeing right now.

Now that I am back, I’m looking forward to playing the volatility with everyone, I believe we will continue to have great opportunities while also watching how this continues to evolve.

Hope everyone has a great weekend

9 Likes

Critical analysis by Maverick today on the CPI data: https://www.youtube.com/watch?v=jYKrjjD6v9g

Here are some key notes.

Headline and Core CPI came under consensus today, causing a super bullish reaction by the market. However, the “fed pivot/rate cut” + “peak inflation” crowd has not won.

[size=4]No Peak Inflation[/size]
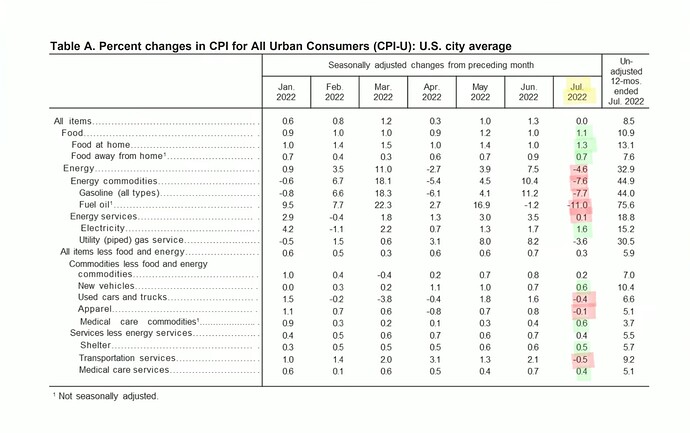
Core inflation continues to rise higher and higher. No peak inflation. See the table below where we can see that the price drops have been fuelled (pun intended) primarily by energy and utilities. Core does not include energy.

Also, it’s hard to believe the table citing a reduction in used car prices and only a modest 0.5% increase in shelter. Who knows.

[size=4]No Fed Pivot / Rate Cuts[/size]
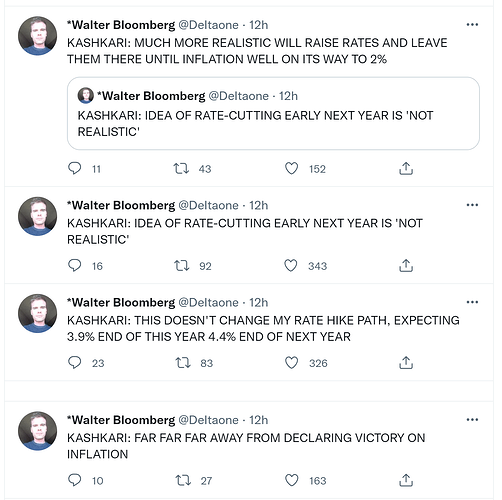
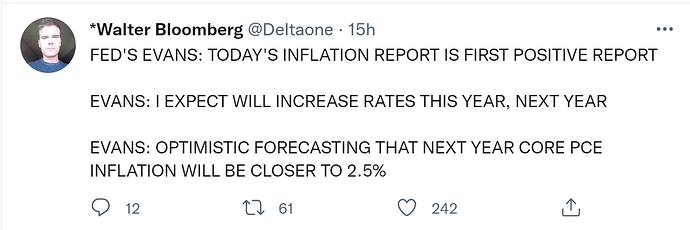
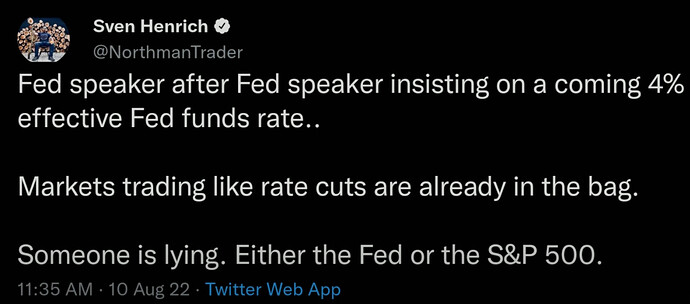
Immediately after the CPI data we have the most dovish fed members saying they are not done with rate hikes, and rate cuts are too premature, etc. etc. However, the stock market is pricing in rate cuts hard.

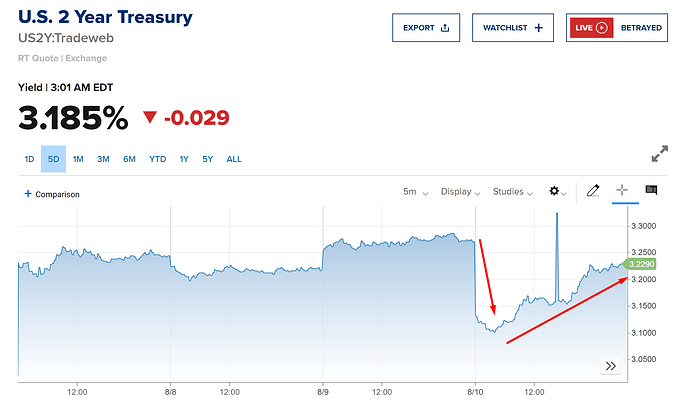
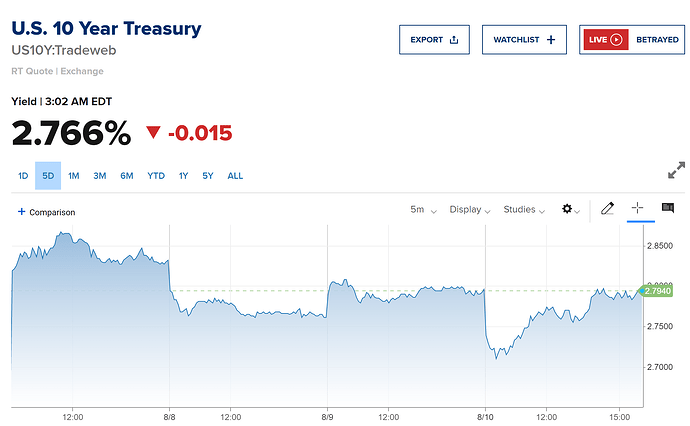
The bond market does not appear to be convinced about rate cuts, and seems to believe the fed rather than the stock market. The 2 and 10 year yields initially dropped hard, but regained much of that loss by end of day.

[size=4]Conclusion[/size]
Basically this market run is looking like another bear market rally on hot air. VIX is under 20. Puts are super cheap now for longer out durations as directional bets or to hedge your longs.

7 Likes

Thanks Kevin, this is great stuff!

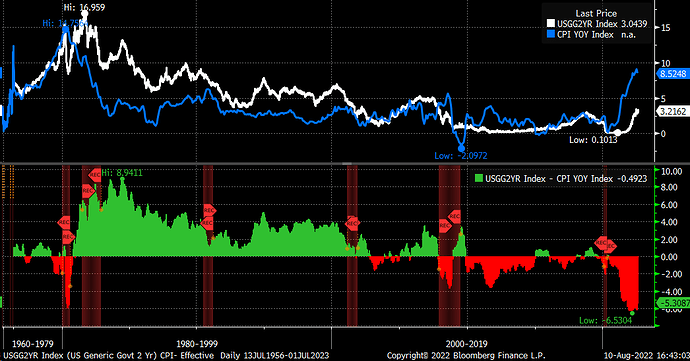
Another sign of us not being “there yet” - interest rates are far, far behind inflation, trailing CPI print by 5.3%. Even if inflation cools down another 1-2% by the end of the year, and the Fed ends at 3.5%, there will be a gap to close.

(Source)

This is concerning because inflation is no longer primarily supply-side driven, and sustained demand destruction is needed to stamp it out.

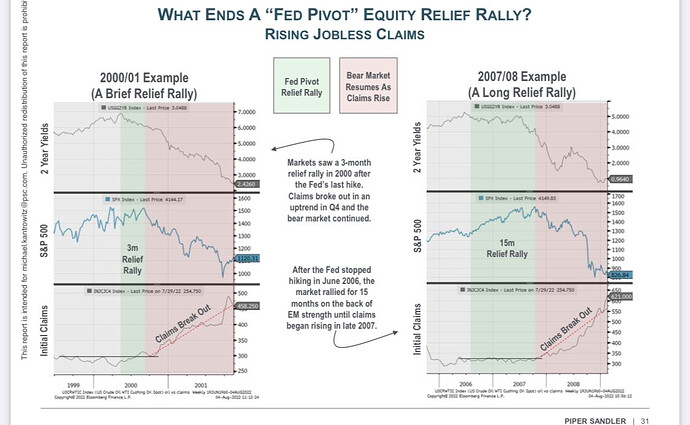
One of the major factors the Fed is keeping an eye on is the employment situation softening. The initial jobless claims report will be important in that regard. Here are two historical comparisons of the Fed pivot (i.e. reducing rates) with jobless claims:


(Source)

Now, all these concerns are moot if the we do end up having a soft landing. And for its part, bond markets are convinced Fed will have to pivot soon, and equity markets are rising from the same expectation.

We do have another cycle of economic data before the next FOMC though, including CPI, so there’s still room for change on this take by the markets, if Aug comes in hot.

3 Likes

Not highlighted in your CPI table, but NG showing -3.6 I believe was mostly due to the CNG plant in Texas catching fire and NG prices crashed (since that terminal was like 20% of US export capacity).

However since they announced it will be back online in October, NG has jumped back up, so it will be interesting to see when the next report comes out in September what it shows.

Also, while diesel prices have been coming down around here, they are still a solid 50% higher than pre-war.

Finally I’ve been watching the farm reports. Crops are not doing well in the drought conditions across the US. Most are around estimated to be around 2021 yields right now, but the coming weeks are going to be interesting to watch. If we have a bad harvest with already high food prices… ugh.

6 Likes

Thanks for the input guys, something that I have been thinking about aswell that the Mav pointed out is the psychology of the fed. Throughout this year we have seen the fed play “good cop, bad cop” depending on how the market has reacted to new data and their policy decisions. Something that Bernanke talked about in the video I posted a few weeks ago.

This is how they have been guiding the market to try to achieve their “soft landing” on the equities side of things. Not too hot, not too cold. However, I don’t recall such a blatant disregard for their perspective happening like we saw yesterday. Typically when things have moved too hot, the fed will send out a few presidents and they will cool things off by saying some hawkish statements.
“I think anything is on the table for next fomc meeting”
“I think we need to be more aggressive with persistent inflation”
“I support a larger rate hike at next fomc” etc.
Then the market reacts and they send out the dovish tone.

But the market did not react to their statements at all yesterday, and the market actually continued to go up. This could be a new problem for the fed and it is completely due to them giving weak guidance and flip flopping their tone all year. The market is basically saying, sure keep doing and saying whatever you want, inflation has peaked and you will pivot, onward to new all time highs!

This of course will ultimately lead to a lot more pain as the fed continues to raise rates with QT in a weak economic environment, but if credibility thus their ability to shift the markets perception is lost, how will equities trade?

Id imagine we see much bigger swings, euphoric cocaine fueled rallies with deeper more violent declines.

Should make for some great trading.

I also want to throw out some perspective on this last CPI print yesterday for anyone reading this.
I was on the wrong side of this trade, I received a fresh pie in the face. Not a huge deal, Im up nicely on the week. However, this was a pre market data drop that I believed would move the market in a big way. 2%+ one direction or the another. If I wanted real exposure to this news I needed to hold positions overnight. I believe for whatever reason this has become the boogeyman. I get it, it isnt for everyone based on your trading strategy and risk tolerance but lets remember their are many different trading strategies, and many ways to think about risk.

I’m really not interested in only speculation before and after news drops. I’m here to trade, I honestly could care less if people “got it right” but didn’t trade it, or even worse, share after the market moves how they “knew” it would happen but they haven’t said anything publicly leading up to the event and had no positions.

Right or wrong my thoughts and positions are in the open for everyone to see, I intend to trade major events that move markets. Im going to be right sometimes and wrong sometimes, just like everyone else.

As MacroAlf says “If you want to know how someone thinks about the market, don’t ask for their opinion, ask to see their positions”

Ill be playing the trend (yes calls if that’s what’s on the menu) until we see a reversal. One of the easiest ways to lose money is to try to time a reversal perfectly. As I have said before, you don’t have to catch the first candle or even the first day. I’m looking forward to seeing how everyone is playing this volatility.

Hope everyone has a great day
12 Likes

Sharing an anti-thesis to the bear theory here, when housing is in a bubble and it begins to burst, folks begin selling those assets and moving the cash into stocks which have been beaten down. It’s similar to when we see investors cycle away from tech into blue chips.

I don’t remember if we saw this in 2008.

Short article about food prices posted this morning. Really the only noteworthy part I copy & pasted below. Still waiting on the next farm report to find out how good / bad crops are doing this year in the US but so far the droughts are taking their toll.

“Inflation will only decline at a painfully slow pace,” said Seema Shah, chief global strategist at Principal Global Investors. “Food and energy inflation are wild cards. Although inflation should peak soon, the broadening and stickiness of price pressures implies headline CPI will only fall to 6.5% this year, before recession accelerates the decline in 2023.”

2 Likes

I think there is some truth there. Alot of homes right now are still equity rich due to prices going parabolic the last few years. It would be nice to find some data on where realized equity moves, there can be tax advantages keeping realized gains in the housing market by rolling it into a new property, im just not sure at what rate people are doing this. But as prices continue to decline equity declines too, this is ofcourse more extreme if homeowners have any type of heloc product.

I do think that unlike like 2008 the current economy has more headwinds than just the housing market.

After researching bear markets and bubbles
I believe we are seeing:

Housing bubble similar to 08

Equities bubbles similar to 00 (Think speculative growth like EV’s, Crypto, Spacs, meme stocks)

Consumer credit bubble similar to 29 (High rise in standard of living and demand fueled by invention of broad consumer credit like credit cards, in store credit accounts, and auto loans)

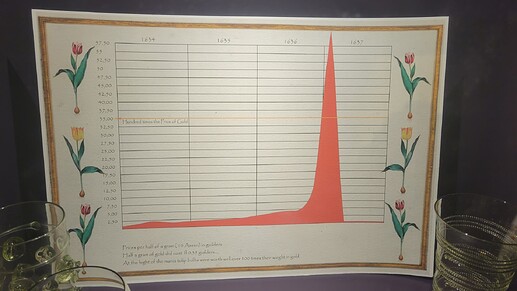
Derivatives bubble similar to tulip mania 1600’s
(First option contracts created a speculative futures market that raised prices of underlying “assets”)

This all can continue only as long as people have access to more credit or future dollars (credit impulse) which will be harder with tighter monetary policy. Or with higher real wages with sustained long term productivity, both of which do not appear to be heading in the right direction. What makes 2022 unique is that usually that credit impulse can be manipulated with accommodating monetary policy, but unlike 00 or 08 inflation has to be dealt with first.

In 08 we saw an actual market crash due to a collateral crisis. Housing just happened to be the securitization that lead the way. Financial titans seem to be in much better shape currently which is different from 08, but I would argue that middle class americans are not. This may eventually lead to a collateral crisis, but as of now I believe it will be reflected in demand destruction which will always be reflected in company balance sheets.

At the very least, broad market P/E ratios need to come back to reality which means stock prices have to come down and zombie companies that have never made money need to be priced accordingly. But my trades and thesis reflect a continued global economic contraction, which I believe in the grand scheme of things is healthy given the run we have been on this last decade.

2 Likes

I loved how you threw in the bit about tulips, that is game-changing dd brother! :smiley:

1 Like

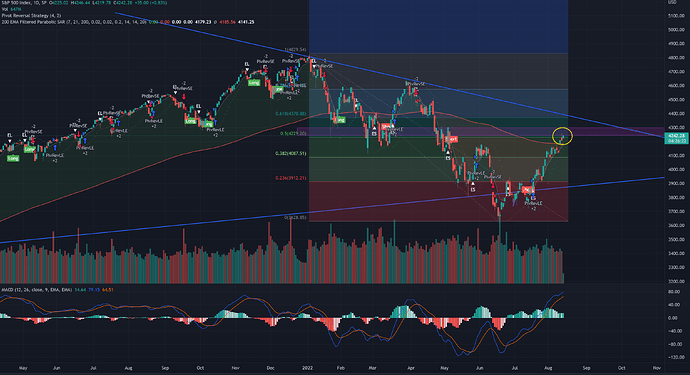
We’ve just hit a pretty critical point, we hit the 50% fib pullback, so main signal that gives is that the 50 fib for the past 70 years has usually meant that the bottom was in (just what the data says not neccesarily my opinion). It doesn’t mean that we won’t pull back down and fill those gaps we left behind though and that is what I’m expecting, but I think we’re still in the bullish trend until we see otherwise (seen in things like higher peaks higher troughs on the 1h SPX) but basically at critical resistance very soon if not imminent. The boxed zone for me the risk reward is not there for me and I expect a lot of people will be feeling that way also so that’s why i’m expecting to come down and grab liquidity from the gaps left behind very soon.

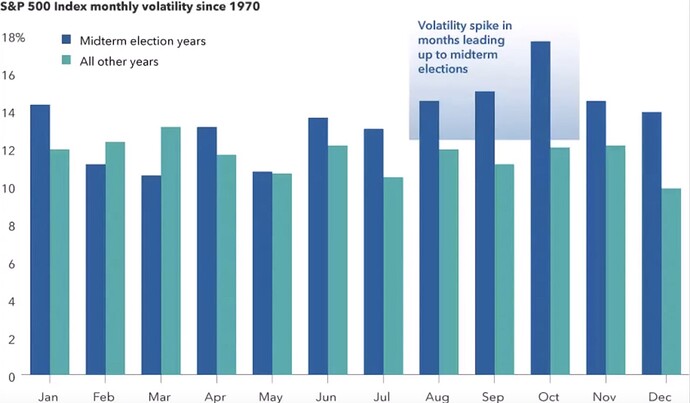
Coming into September from August, again refering to past data usually shows a large spike in volatility and that will be amplified this year as it is a midterm election year.

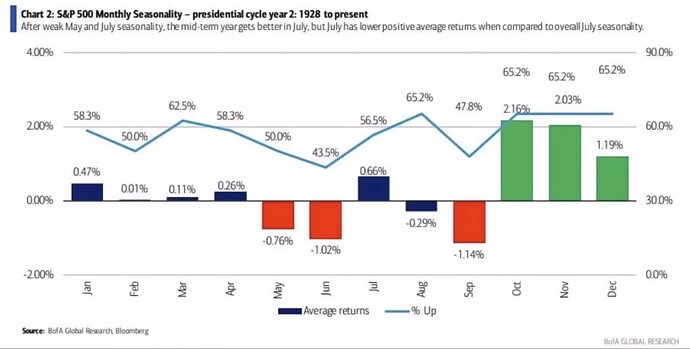
Midterm years, September and August tend to end up leading into negativity but October November and December at least historically have been pretty strong so maybe expect volatility over the next couple months once we get towards the end of low volume August. We don’t have too many catalysts over the next few months either so the market is going to be basically left to its own reasons - we’ve had earnings, and we’ve had inflation data, it’s going to be less news and more the market participants moving the market imo.

Back to where are we right now though… One of two scenarios I see really, small pullback into huge rally and small pullback into a dipping market possibly even a new low but most likely just coming back and testing previous points, again based on previous times the most likely. We’ve done the reverse rally and now we’re at a crtitical point and everything really can be made and broken in the next couple of weeks. Good luck with trades in these choppy times everyone.

3 Likes

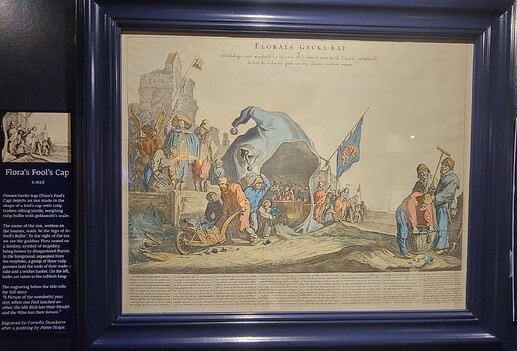
Yea man the Dutch Tulip frenzy is fascinating. I read the book Tulipmania by Mike Dash, the human behavior side is ofcourse pretty wild but I didnt know derivatives were really the catalyst behind the madness.
Tulip bulbs planted in the ground take 2 years to bloom and tulip trading due to weather was ofcourse seasonal. So these traders figured out they could trade contracts on bulbs that were in the ground on what their future value would be. This opened up the worlds first speculative futures market with options, and what came next was the worlds first speculative bubble which at its peak one tulip bulb was worth as much as a house and some land.
I visited the tulip museum in the Netherlands, here are the worlds first futures contracts in the first photo and a few other photos from my visit there you may enjoy. Cheers dude !


2 Likes

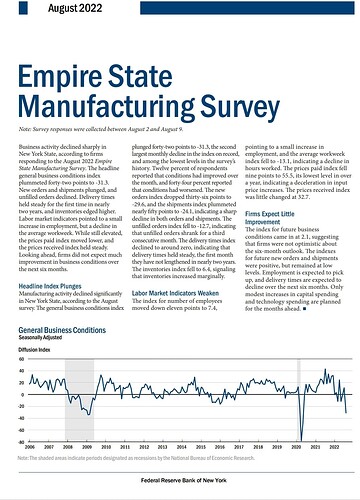
This is a pretty big surprise to the downside from this foward looking indicator (MFG Survey)
2nd largest single month decline in history.

Given the run we have been on the last few months and the anticipated hawkish tone from multiple fed presidents upcoming, ill be looking at longer dated OTM swings on IWM and my shitlist of weak stocks this morning.

When equities start to confirm the next leg down ill change my strikes closer accordingly.
Dip buyers have been showing up relentlessly so I want to confirm the move as much as possible before making any big trades.

There is ofcourse the possibility that equities stay in this hopium cocaine fueled rally where data and fed talk doesn’t matter, so ill be keeping that in mind when thinking about risk.

Hope everyone has a great week.

5 Likes

Today was a big red day for the market after several days of green.

What was the catalyst? Could be any or all of the following:

  • MOpex options shenanigans
  • Profit-taking. “Gotta have a red day after [insert the number of green days]”
  • Markets hitting the 200 MA. This was gaining a lot of interweb chatter recently. Could be a self-fulfilling prophecy where people just sell to try to get ahead of others.

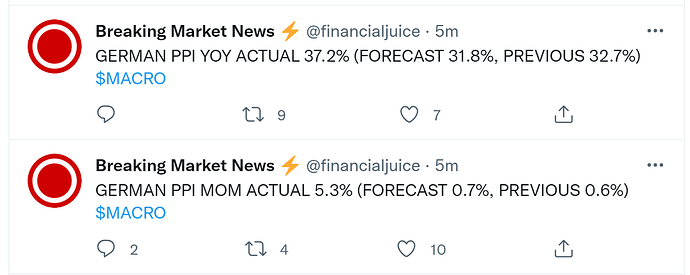
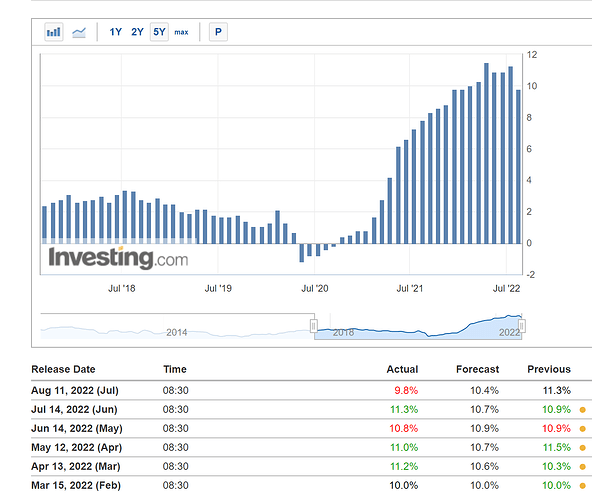
One possible catalyst that I haven’t seen talked about as much is the German PPI report. At around 11:40 PM PST last night the German PPI report came out and then I noticed futes really start to slide, and then BTC knifed below its August support. The only news at the time was the German PPI report.

The “Actual” PPI numbers that came out were astronomically above consensus.

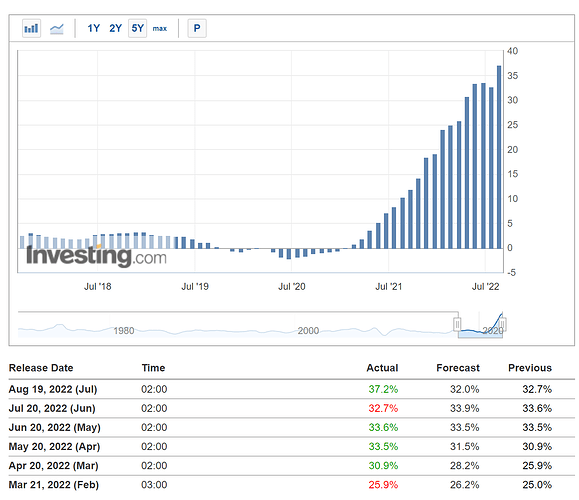
YoY PPI was at a stunning 37.2% when forecast was 32.0%. Looking at the previous PPI prints it looked like a possible “peak” that kinda reminds me of the US data actually. The German data adds a gloomy outlook for the world in general and reminds us that inflation is not going down without a fight.

https://www.reuters.com/world/europe/german-economic-outlook-gloomy-finance-ministry-says-2022-08-18/

Here’s the chart for US PPI YoY index.

4 Likes

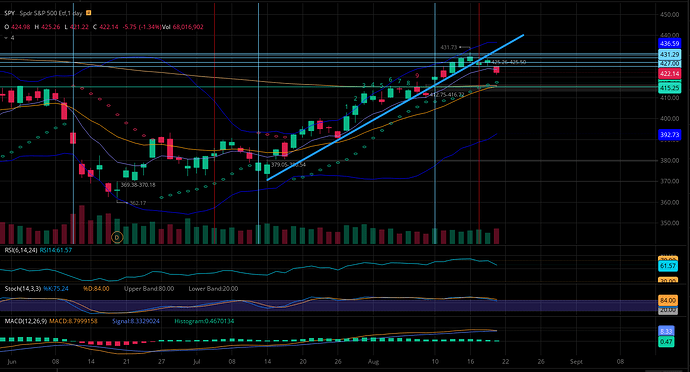
I don’t know if it’s going to be a reversal or just some sideways cool-off, but you can clearly see the market has been respecting that big-fat blue trend-line (sans one day) since July 14th for over a month’s run.

Only the past 3 trading days did we finally break the trend. I think the market just ran too hot for too long, especially in this macro environment.

(Anyone wondering, the red vertical lines are FOMC minutes, blue vertical lines are CPI data.)

7 Likes

Nice job beaker with the lines. Saving this chart

1 Like

@bigglyoptionoligist I’m going to be creating a thread with charts of the day we have FOMC minutes, so keep an eye out for that. Just a few more charts to screenshot.

.
Also, I think much of retail (and the media) have forgotten starting September 1st the Fed is going to kick up QT a notch going from $47.5 billion / month to $95 billion / month.

While obviously it’s not an instant effect, this could start to sour September & October as the market prices this change in. For every $100 of bonds Fed bought during COVID, $5 trillion in total, they have sold just $2.

  • For Treasury securities, the cap will initially be set at $30 billion per month and after three months will increase to $60 billion per month. The decline in holdings of Treasury securities under this monthly cap will include Treasury coupon securities and, to the extent that coupon maturities are less than the monthly cap, Treasury bills.
  • For agency debt and agency mortgage-backed securities, the cap will initially be set at $17.5 billion per month and after three months will increase to $35 billion per month.
6 Likes

Thank you @TheMadBeaker ! I’m a visual man, so definitely helps me see bigger picture from the past to consider looking forward.

I also have to call out my man @Tiddly as we have quad witching on Sept 16 I believe followed by December 16.

4 Likes

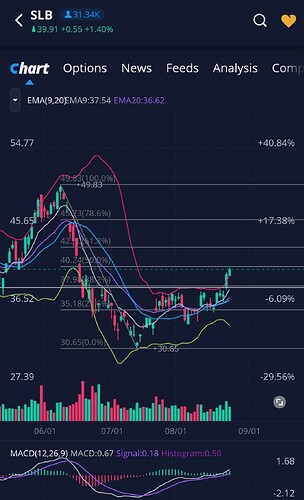
Ive been keeping an eye on energy and energy producers. I have SLB - Schlumberger on my longer watch list. Big player on the production side of things, offering services in oil and nat gas. I have been scratching my head wondering what energy will do next, but I keep coming back to historically elevated prices with historically low supply. Opec+ has been looking at a production cut soon after June and July production missed targets.

Technicals look good. I would ideally love a retest of $38.95 for an entry, but im going to also be looking at how it handles the top of this channel at $40.11

When I look back at how energy producers have performed during bear markets and recessions they have followed the market on violent down days as you would expect, so something to keep in mind. However, during a recession over a longer duration this is typically their best performing time periods. So this offers a little more protection, especially on longer dated strikes.

Im planning on swing trading this, but will cut to take profits or to look for a better entry on big moves either direction.

Looking at
Sep 16, 42.5c currently @ .81
Nov 18, 50c currently @ .85

4 Likes

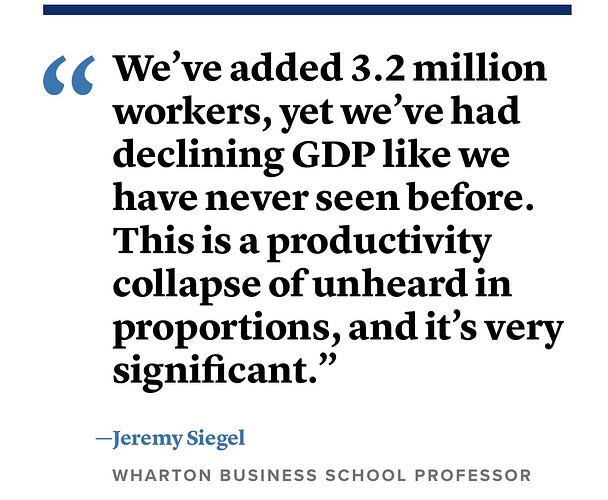
Yeah, this is a problem.

2 Likes