Stagflation leading to Recession - The Kodiak Bear Thesis

Interesting article about one of the biggest bears around and what he is saying:

In almost Shakespearean fashion, perma-bear and well-known pessimist Jeremy Grantham said the markets are in a superbubble in a Wednesday note, and warned of significant turmoil ahead.

What is a superbubble? Well, let’s get into it.

A typical bubble occurs when prices grow quickly while investors ignore serious hazards, which eventually causes the bubble to burst and subsequently prices to fall. In those typical situations, indexes increase to two standard deviations over the most recent price average.

Grantham says the number increases to 2.5 or more in a superbubble. When stocks recovered from their early pandemic lows, the market was at that point in 2021.

“Only a few market events in an investor’s career really matter, and among the most important of all are superbubbles,” Grantham said. “These superbubbles are events unlike any others: while there are only a few in history for investors to study, they have clear features in common.”

One of those characteristics is the bear market bounce that occurs during the initial derating stage of the collapse but before the economy has demonstrably started to worsen, as it typically does when superbubbles deflate.

“Prepare for an epic finale — If history repeats, the play will once again be a tragedy. We must hope this time for a minor one,” the GMO CEO said.

The History Of Superbubbles: Of course, the lifelong pessimist is alluding to the great financial declines of 1929, 1973 and 2000. In each decline, the market recovered about half of its losses before freefalling to new lows.

In each of the previous three instances, a bear rally helped to recover more than half of the market’s initial losses, drawing naive investors back just as the market began to decline once more.

The rally this summer has been a perfect fit for the pattern.

From the November low in 1929 to the April 1930 high, the market rallied 46% — a 55% recovery of the loss from the peak.
In 1973, the summer rally after the initial decline recovered 59% of the S&P 500’s (NYSE:SPY) total loss from the high.
In 2000, the tech bubble, the Nasdaq recovered 60% of its initial losses in just two months.
In 2022, at the intraday peak Aug. 16, the S&P had made back 58% of its losses since its June low.
“Thus we could say the current event, so far, is looking eerily similar to these other historic superbubbles,” Grantham said.

The Last Word: The three main asset classes — housing, equities and bonds — were all severely historically overpriced at the end of last year, according to Grantham, making the present superbubble the most perilous combination of elements that caused past superbubbles.

“Given all these negative factors, it is unsurprising that consumer and business confidence measures are testing historic lows,” he wrote. “And in the tech sector, the leading edge of the U.S. (and global) economy, hiring is slowing, layoffs are rising and CEOs are increasingly bracing for recession.”

7 Likes

I’m not sure I understand. Is he saying between June 2022 and today the market rallied 58%?

If that is the case, with the context of the downturns from these rallies in the 1970s and 2000 mixed with September being a historically bad month it could get ugly.

Or is the volatility of September already priced in?

2 Likes

Not sure where to post this But looks like semiconductors will continue to sink at least in the short term

https://www.bloomberg.com/news/articles/2022-09-01/almost-no-stock-spared-as-semiconductor-rout-spreads-tech-watch

2 Likes

I normally do not like reading from motley but Interesting article about using SPYs forward p/e to “predict” the bottom.

With two exceptions – the Great Recession between 2007 and 2009, where valuations were truly depressed given the uncertain state of the U.S. financial system, and the double-digit percentage pullback for the broader market in 2011 – the S&P 500’s forward P/E has accurately predicted the bottom of every other notable decline since the mid-1990s. Specifically, we’ve witnessed the benchmark index’s forward-year P/E bottom between 13 and 14. This is where the S&P 500 found its bottom following the dot-com bubble in 2002, during the nearly 20% pullback in the fourth quarter of 2018, and following the coronavirus crash.

As of Aug. 31, the S&P 500’s forward-year P/E stood at 16.8. Based on the noted range of 13 to 14, this would imply further downside to the S&P 500 of 16.7% to 22.6%. In other words, as long as the earnings component of the benchmark index doesn’t drastically change, this indicator would imply a bear-market bottom between 3,061 and 3,296.

5 Likes

Goldman draws two downgrades amid investment banking jitters after share price gains - MarketWatch

Shares of Goldman fell 1.8% on Tuesday, while the Dow Jones Industrial Average DJIA, -0.55% dipped 0.6%. Goldman and JPMorgan Chase & Co. JPM, +0.03% are both components of the 30-stock index

The bearish calls on Goldman Sachs GS, -1.51% come after the stock rose about 18% from its lows in mid-July, although the share price remains in the red for 2022. The stock is now trading at about $326 a share after rising from below $282 in mid-July.

“We do not see positive catalysts ahead,” said CFRA analyst Kenneth Leon.

Maybe I’m being a little “tin foiley” but I don’t love the sentence “We do not see positive catalysts ahead” where Goldman Sachs is concerned.

1 Like

I dont think it is tin foil hat, but I may be a little biased. :sweat_smile:
I see a few positive catalysts, thinking about them in Fundamental and sentiment perspectives.

Possible Positive Catalysts scored on likelihood of happening now IMO 1-10

Fundamental (long run)
Monetary Policy (rates cuts) - 1
Fiscal Policy - Stim $, helicopter money, etc. - 3
Consumer Debt to GDP Improves - 0
CPI < 2.4% - 0

Geopolitical tensions ease (somewhere in the middle) - 2

Sentiment (short run)
Lower CPI- 7
Dovish J Pow tone- 6*
Less than expectaion Fed rate - 4
Expected Fed rate - 7
Biden Speech (positive for markets)- 4

Potential Bear catalysts would be fun too

2 Likes

Mav just posted about this, 1.5 Trillion in margin calls in European energy sector. Sounds like it could have some big ripple effects, something we should be following

https://www.reuters.com/business/energy/wide-demand-reduction-only-feasible-solution-europe-energy-crisis-equinor-2022-09-06/

5 Likes

We’re looking at a price cap in effect as early as next week as “energy ministers” plan to meet Friday I believe. This would slash current supplier prices by more than 50%.

My take on this is that nobody will really “benefit” so don’t look for bullish calls on European energy suppliers outside of their normal supply chain stepping in (eg Nigeria)

https://www.ft.com/content/ab469e2d-8e87-44ee-855b-f46b5b2dd17e

4 Likes

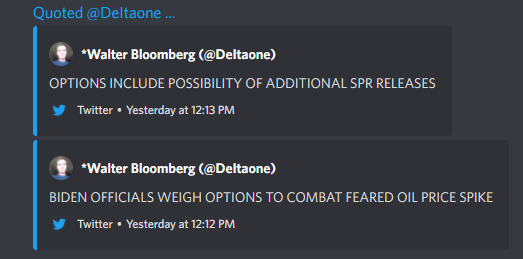
There were a couple interesting tweets that came through yesterday that makes me think CPI report isn’t going to be what people are expecting. At the very least it does lend credence to all the mumblings about oil prices going back up later this year or early next year.

Oil

oil2

3 Likes

Interesting article I came across this afternoon for @The_Ni & @Kevin to (maybe) explain what went on with the markets…

Bloomberg (paywall): https://www.bloomberg.com/news/articles/2022-09-09/forced-buying-puts-a-floor-under-stocks-nobody-else-wants-to-own

Archive copy (no paywall): https://archive.ph/XkDnl

2 Likes

My impression was that the rally was a mix of algos buying stocks in association with the USD (DXY) going down when the Euro dollar went up due to interest rate hike news and projections, and short covering. For example, with the dollar down, we saw commodities move higher.

I’ll take a look at article later when I have some time!

2 Likes

lol when I first read the headline I kept reading “buying puts” like the purchase of put options

Anyways I had a read, and the article pretty much mentions every possible reason the market could have went up

  • Short covering
  • As market went up, options dealers had to hedge calls, unwind puts, etc.
  • Market reclaiming key trendlines, moving averages, etc.
  • USD moving down
  • Contrarian mentality, i.e. too many people are bearish, therefore markets are bullish

tl;dr the article doesn’t have much to add to this forum thread imo

6 Likes

Thank you @Kevin this is a great summary. @TheMadBeaker I have nothing to add to this. All of these seem plausible explanations for why the market rallied, and one could have fed the other to a large extent. E.g. as we rolled above the SPX 4000 level, MMs de-hedged furiously and had to go long, which gave the tailwind which then caused shorts to cover. DXY made stocks more affordable, and we might still have some help from the vol unwind after the WSJ leak of FOMC data.

Thing is, all these things make total sense and we can find supporting data for it, but it’s still not evident in the moment when it is happening. Especially what the primary trigger is. And then there is the risk of hindsight bias, always.

4 Likes

Thx to this Reddit post.

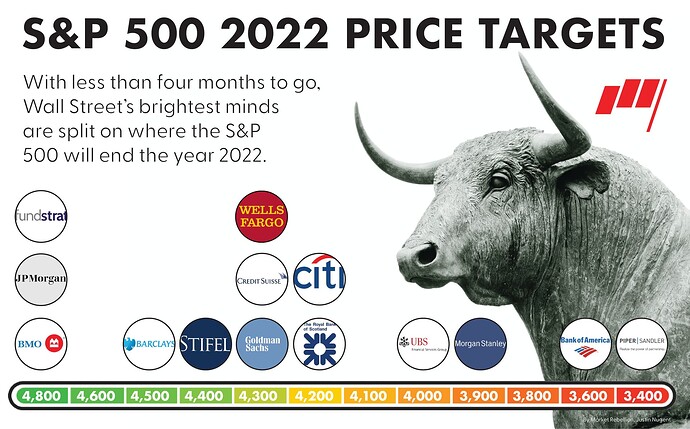
SPX end of year price targets. Super mixed by all the ‘expert’ economists.

Note that JPM is at 4800 but their CEO tells the high profile clients to stash cash.

6 Likes

Hah, that is such a wide range.

I wonder if we should do a “Valhalla bets on EoY SPX” competition. See if we can beat these institutions.

5 Likes

Don’t know if you guys saw this article on CNBC about some recent Goldman credit card stats.

  • Goldman’s loss rate on credit card loans is the worst among big U.S. card issuers and “well above subprime lenders” at 2.93%, according to a Sept. 6 note from JPMorgan.

  • More than a quarter of Goldman’s card loans have gone to customers with FICO scores below 660, according to company filings. That could expose the bank to higher losses if the economy experiences a downturn, as is expected by many forecasters.

3 Likes

I have been thinking about this G.19 report from a few days ago, I would love to hear some opinions on something I’m not sure about.

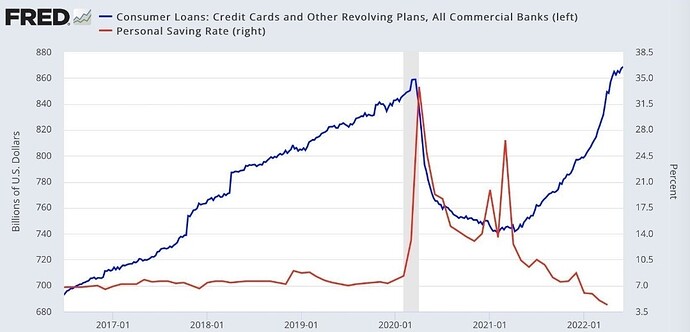
First, fundamentally this is what Consumer Credit and Personal Savings looks like together.

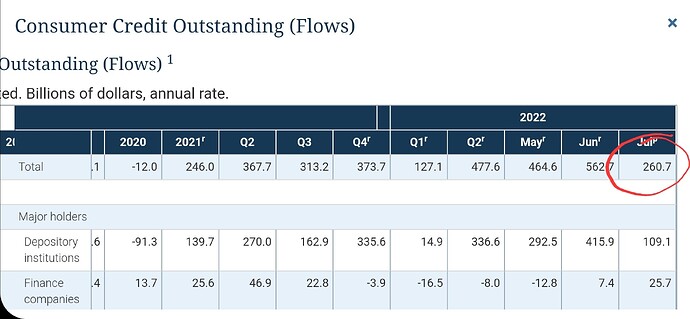
I have been pretty clear with my thoughts on whats going on here but I’m trying to wrap my head around this number in the latest Fed G. 19 report:

Consumer credit flows came in at 260.7 billion vs 562.7 billion the month pror, led by revolving accounts at 125.4 billion vs 306.4 the month prior.

This is a sizable drop from a credit arena that has been setting records all year. Even this G. 19 showed total consumer debt balances at another record. My speculation is around the reason why we saw this drop in flow.

Who is driving this change? Is it coming from consumers changing buying behaviors? Or is it driven from the lender? Or is it a combination of the two?

Some answers only come in hindsight, but getting as close as possible is valuable when we put the pieces together. I appreciate any input.

Also, I want to share a few brief thoughts on CPI, FOMC, and my latest trades.

CPI
This is interesting to me because it seems like the market is agreeing that it will be near expectations or less. I shared my opinion a few weeks ago on the macro thread about this print, “CPI lower, inflation has peaked, market rips on sentiment”. While I generally still think this is most likely, I do wonder how much of the move has been priced in the last few days. Regardless, im heading into the print out of indexes and fairly neutral in my current positions.

FOMC
This is a big one, mainly because of this upcoming CPI print. If CPI comes in near expectations, lower MoM and the market reacts positively, then where does that leave us with rates? I think the obvious rate is 75bps, we need to watch probabilities tomorrow to see what changes but its currently at around 90%.

Current positions
Long SLB and GOLD
SLB- Slumberger (energy services)
GOLD- Barrick Gold (gold producers)

I have really enjoyed swinging these two stocks in green trends. They both have fundamental reasons to be bullish as well as both historically do extremely well during recessions. I started buying shares for longer term stuff, but will have calls on when the market is green.

Short FEZ and UUP
FEZ- Euro Stoxx 50 etf
UUP- Invesco Db US Dollar Bullish

It has been non stop bad news in Europe, and I believe they are in Black Swan territory, FEZ is some exposure to that.
UUP is a lotto play that seems to be working so far. UUP is a 2X leveraged index on the dollar. Puts are cheap and have decent OI. The dollar looks to be showing some weakness and a break through its testing support would pay nicely.

My thoughts are ofcourse see where the market goes, but if we get a rip off CPI I cant help but wonder if J Pow will deliver another reality check at FOMC.

8 Likes

For FOMC I think JPow is going to slap dick to face and we see 75bps. Wasn’t last CPI bullish but upon release no one could interpret it at first and markets dumped before rising?

Anecdotally, I think the mixture of consumer credit flows being lower is a mixture but I do think banks are driving a lot more. I recently financed a car and finding a lender was slightly difficult. I have excellent credit and plenty cash but my rates were still coming in high and the number of banks willing to work the loan was less than I’ve experienced during past purchases. I’m also in the early stages of a house hunt and banks that were once emailing me are now less interested.

You would think as prices rise more consumers would put more on credit but maybe I am wrong. It is definitely a huge drop from last month.

5 Likes

it just hulk dildo’d up once it came under forecast

5 Likes

@EV1 was asking about this in TF earlier from The House and I figured it would be good to include in this thread.

Energy Trading Stressed by Margin Calls of $1.5 Trillion

  • Exchange requirements to secure trades is sucking up capital
  • Governments under pressure to provide market with liquidity

Archive Copy (No Paywall): https://archive.ph/08v6L
Bloomberg (Paywall): https://www.bloomberg.com/news/articles/2022-09-06/energy-trade-risks-collapsing-over-margin-calls-of-1-5-trillion

4 Likes