Stagflation leading to Recession - The Kodiak Bear Thesis

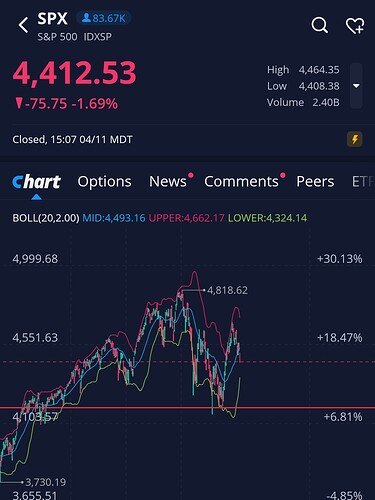
Wow, thats really interesting. Hes ultimately suggesting that if HYG breaks the support its sitting on spx will crash twice as hard because there is a divergence between SPX and the same credit markets that HYG plays in, meaning historically it should have already been lower. Then says if it was historically accurate SPX should be around 4173 right now. Fascinating.

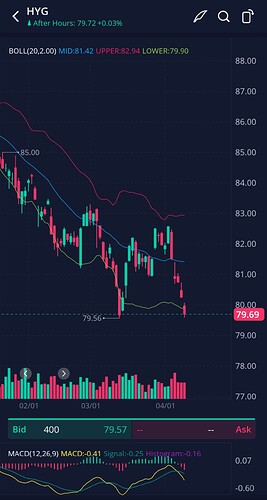
This is HYG, sitting on key support last tested on 3/14.

And hes saying if the divergence was accurate SPX should be here right now (red line) happens to be key support last tested on 3/14. Unreal.

Hilarious ive been buying puts on both SPY and HYG, but HYG has performed better. Now I know why. Historically they SHOULD have been moving together. Sure makes me think about SPY a little differently.

Thanks @Kevin, this was a great find

2 Likes

Wow, but unfortunately that is pretty grim because HYG is tied to how we should evaluate companies. This is risky corporate debt, so its all fundamentals. HYG being in this weird corporate bonds / Equities ETF middleground actually looks like a solid indicator of the real economy, tying main street to wall street. But if thats the case, than SPY needs to follow the next dip but still make up for the last one.

Also, it makes sense why big money is betting against it. 99.1% puts. They are betting against the real economy without all of the bullshit that the indexes bring. How? Because they are betting american companies are going to default on thier debt.

2 Likes

What do you think caused this divergence between HYG and SPY?

If there is a real reason for the divergence, then does that mean HYG may no longer be a reliable indicator? Just thinking out loud.

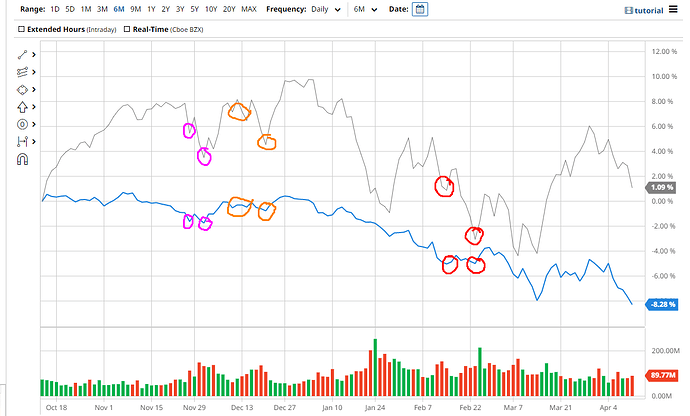
Editing in my mark-ups of the barchart comparison between SPY vs HYG in the past 6 months.

  • SPY is the grey line
  • HYG is the blue line

I attempt to indicate past instances with colour coding where HYG double bottomed at a certain level and SPY seemed to be a different levels each time. However it is interesting to note that at these instances, SPY would dip and then the 2nd dip would be much steeper. At this point in time, HYG is at again a double bottom, but SPY is not showing that 2nd steep dip. Strange.

1 Like

Looking at the SPY and HYG graphs I see a clear difference. SPY has been in a constant uptrend, while HYG is in a constand downtrend over time, so it would make sense to see HYG lower at this point than spy. What would be concerning though is if HYG was down too much. Personally I think this would still be the same levels considering HYG has a little more downward pressure over time, but I may be wrong.

5 Likes

The only way to know is to watch. But if it holds true, not only is HYG an indicator its the only indicator. So the test would be if HYG breaks its key support this week, does SPY follow? That would be a heavy drop. But would be telling of this historical divergence

Yeah true that. Only way to know is to see how it plays out.

If it plays out… VALHALLA ALWAYS EARLY

1 Like

Yea predictions are hard. And you can always be “Right and early. Or wrong, but they are the same thing” i think alot of this is right, but timing is tough, could be super early, or I could be completely wrong about the whole damn thing, and if thats the case ill figure out where i went wrong and learn more. Im going to manage risk so if i am wrong it doesnt hurt too much. But literally repeat this cycle forever. So for me its super fun just watching everything happen right in front of our eyes. Whether we crash or we go on another massive bull run, people will be studying these financial times forever imo

3 Likes

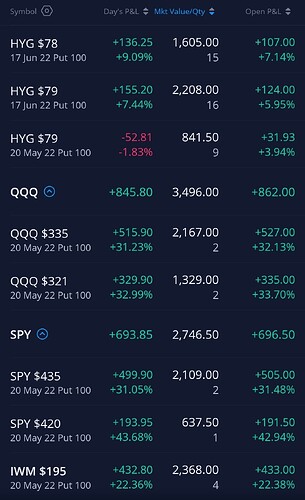
I took an entry on HYG puts today.

05/20 78p at 0.64
06/17 77p at 0.83

1 Like

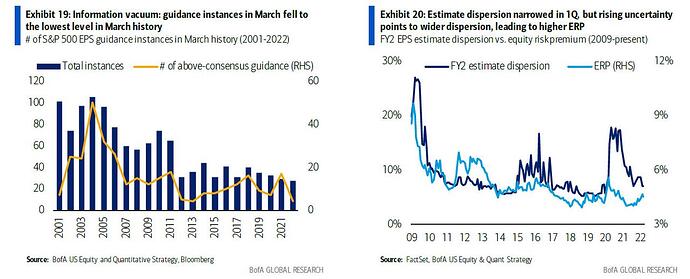
I found this chart interesting as it relates to the current general bearishness of this thread. For me the last shoe to drop is corporate earnings. Maybe HYG plunging is a precursor to that as the debt will underperform if earnings weakness is perceived as the prevailing sentiment. The first chart is the one that jumped out to me and it shows the number of earnings guidance releases in March. Historically companies that issue guidance have more beats than misses. This number was at the lowest level since it’s been tracked by BoA. That might signal there’s no good guidance to report so companies don’t report anything. On top of that the rising strength of the dollar can also hurt corporate profits.

2 Likes

Agreed. Basically in a lot of the discussion points between Yes Recession vs No Recession, I found that both sides argued for consumer demand either being weak to support Yes Recession or strong to support No Recession. So who will be right?

All eyes will be on the next earnings reports for sure.

1 Like

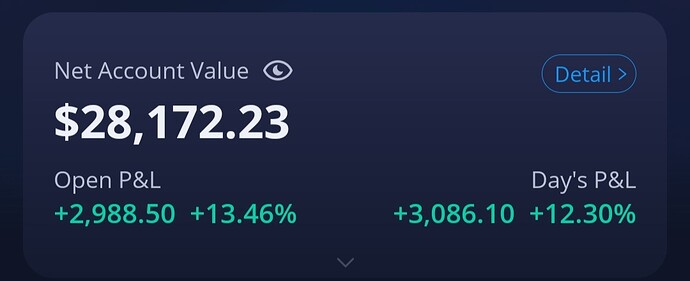
Another eventful day. I Thought CPI would have came in higher, it essentially met expectations. It sucked to cut my 4/14 strikes, it helped that most of them were deep ITM, but port got hammered at the bell. Sold early and started averaging in during the early run up at 5/20 and 6/17 strikes. Short term, its anyone’s guess. 1/2 my port is in cash and the positions that I have are tight OTM both reflecting the uncertainty around the next short term move. If you take out my transfer I was up roughly 50% yesterday, today gave 11% back, tough L but was able to add valuable time moving positions further out.
Learned some lessons today, one of which is to always respect the market and respect all possible outcomes. Im also going to be more mindful about this when I post my thoughts, alot of times im essentially typing as im thinking and I dont want my tone to come across over amplified. Hope everyone had a decent day.


3 Likes

Thanks for posting this, I think you are spot on regarding earnings. Its where the equities market gets information about the real economy. I’m looking forward to listening into the Financial tutes calls coming up, will be paying close attention to how they view the rest of the year, and what indicators they reference to form their opinions.

2 Likes

Adding some HYG 78p for October today.

3 Likes

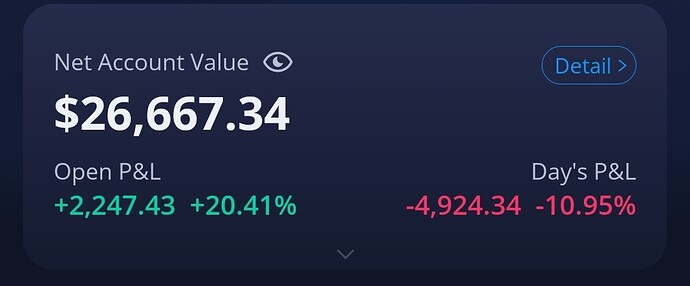
I had a red day. Tried to find new entries but the markets were solid green. 10% down. Sold off most of my positions except my later HYG strikes and a couple SPY, QQQ puts just because of how low the volume was and retail numbers come out in the morning. If the market goes green again tomorrow I think it is an signal we have could have another bear market rally, and I will look at later May-June strikes and entries while paying attention to the upcoming May FOMC meeting. As far as the thesis goes, unless the fed completely pivots into being more accommodating, my conviction remains high. Im not sure what else I can add here but Ill keep posting updates as things evolve.
Hope everyone has an awesome day

2 Likes

I’m in a similar boat except that you are trading around the rallies ten times better than I am. :ded:

My conviction in the thesis is unchanged as well, and I think that’s what’s making it so hard for me to abandon my put positions and cut losses and keep taking the pain. In fact, PPI and JPM ER today actually reinforced the thesis imo, but I need to look into the details later tonight when I have some time.

1 Like

[size=4]PPI highlights[/size]

  • Final demand up 1.4% in March vs 1.1% expected
  • Stripping out food, energy and trade services up 0.9% vs 0.5% expected
  • These highlights are really bearish, and may indicate an upcoming hotter CPI print on the next one.

https://www.cmegroup.com/education/courses/learn-about-key-economic-events/understanding-consumer-price-index-and-producer-price-index.html

Since PPI measures the costs of producing consumer goods, and commodity and food prices directly affect retail pricing, PPI is seen as a good pre-indicator of inflationary pressures.

If there are large swings in commodity prices, the market will most likely focus on the PPI core reading as the most reliable statistic.

^Reminder that we’re up 0.9% vs 0.5% expected (doubly big) subtracting food and energy

Takeaway

  • This PPI indicates that we should see a hotter-than-expected CPI print for the next one.

[size=4]JPM highlights in relation to consumer sentiment:[/size]

  • Average deposits are up 13% YoY, and 2% QoQ
  • Just for consumers, average deposits are up 18% YoY and 4% QoQ
  • However, 11% YoY increase in credit card outstanding balances for consumers
  • Combined credit and debit spending up 21% YoY

These highlights indicate that consumers are still spending and have decent cash balance in Q1 2022. This may mean continued stronger earnings reports from companies in the upcoming ERs in the short term. With sustained inflation though, as seen from earlier posts, consumers do see inflation as an issue and are keen on spending less. Perhaps in Q2/Q3 onwards the spending is gonna go down.

Looks like JPM is bullish for the economy for Q2 and Q3, and is uncertain after that.

The CEO of the biggest U.S. bank by assets said Wednesday that economic growth will continue at least through the second and third quarters of this year, fueled by consumers and businesses flush with cash and paying off debts on time.

“After that, it’s hard to predict. You’ve got two other very large countervailing factors which you guys are all completely aware of,” Dimon told analysts, naming inflation and quantitative tightening, or the reversal of Fed bond-buying policies. “You’ve never seen that before. I’m simply pointing out that those are storm clouds on the horizon that may disappear, they may not.”

Dimon’s remarks show just how quickly major events can change the economic landscape. A year ago, he said the U.S. was enjoying an economic “Goldilocks moment” of high growth coupled with manageable inflation that could last through 2023. But stubbornly high inflation and a host of possible impacts from Russia’s invasion of Ukraine have clouded that picture.

The risks spilled into view on Wednesday, when JPMorgan posted a 42% profit decline from a year earlier on increased costs for bad loans and market upheaval caused by the Ukraine war.

Takeaway

  • Q1/Q2 and maybe Q3 earnings reports from companies may continue to show strength. However, all eyes will be on forward guidance.
  • Around Q3 onwards, consumer demand may start to show weakness as inflationary pressures realize.
4 Likes

Interesting read from the folks at UMich who do the consumer sentiment survey:

There is a high probability that a self-perpetuating wage-price spiral will develop in the next few years. Households have already become less resistant to paying higher prices and firms have become less resistant to offering higher wages. Prices and wages will continue to spiral upward until the cumulative erosion in inflation-adjusted incomes causes the economy to collapse in recession.

https://data.sca.isr.umich.edu/fetchdoc.php?docid=69760

4 Likes

:face_with_spiral_eyes: great

Had a decent day today.
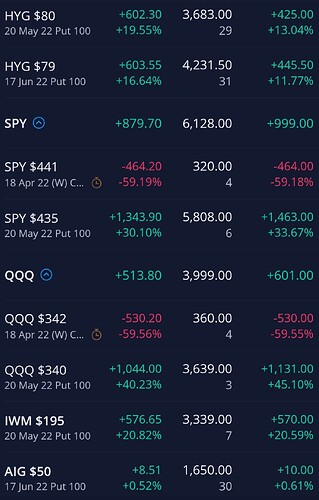
Ive been reading about options structure and how you use different strategies to manage risk. Tried one out today that worked well. When SPY tested an important support level of 439.40 I bought (4) 4/18 441c. Mirrored the trade with QQQ. I didnt want to sell my 5/20 puts and search for a better entry so this hedge made more sense to me. SPY ran back up to resistance of 441.80, and i didnt panic because these calls were significantly minimizing my put exposure. SPY then continued down and retested key support eventually breaking through. Now I would have liked to cut the calls and re enter new tighter strikes at the new support line but I was taking my dog to the groomer and missed it. Nonetheless was happy with the result. Will continue reading about different strategies and most importantly the context of when to use them.

Hope everyone has a great holiday weekend.


5 Likes