I believe this chart was originally posted by @The_Ni or @TheHouse and should be something we pay closer attention to. Everyone here wants the market to fall right now but that’s not how things work, outside a forced global shutdown the economy is a very slow moving monster and things take time.

As the fed raises interest rates, these four key indicators happen which in turn bring down inflation.
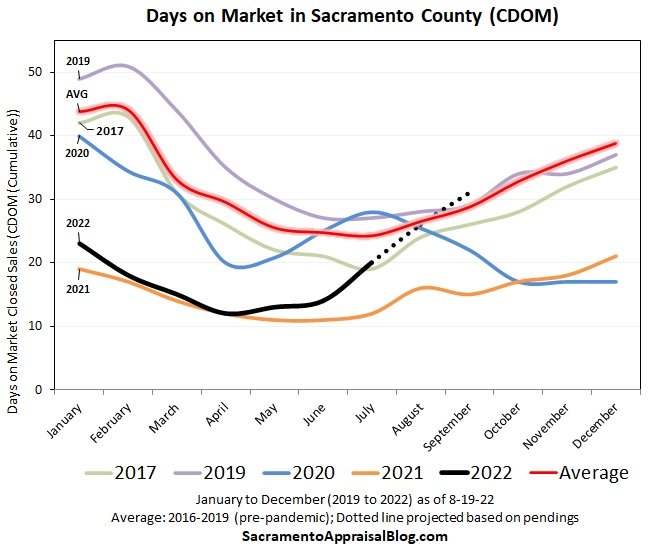
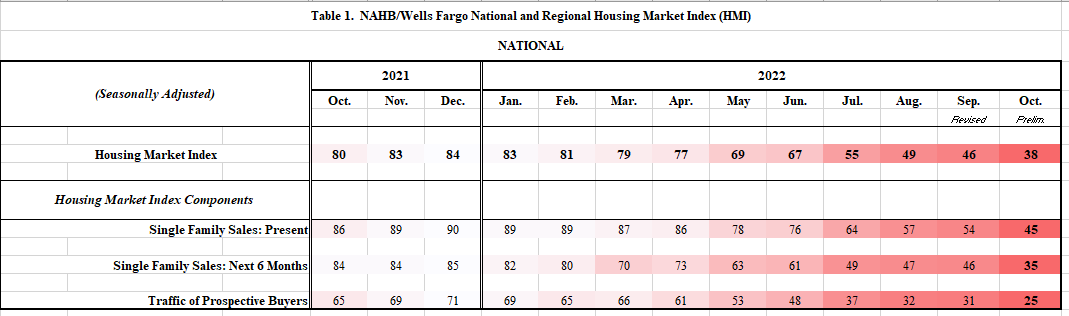
Housing
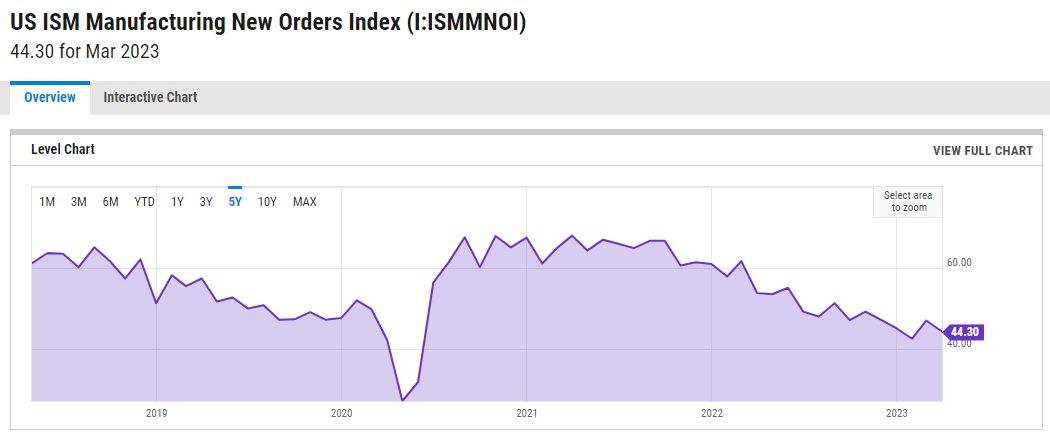
New Orders
Profits
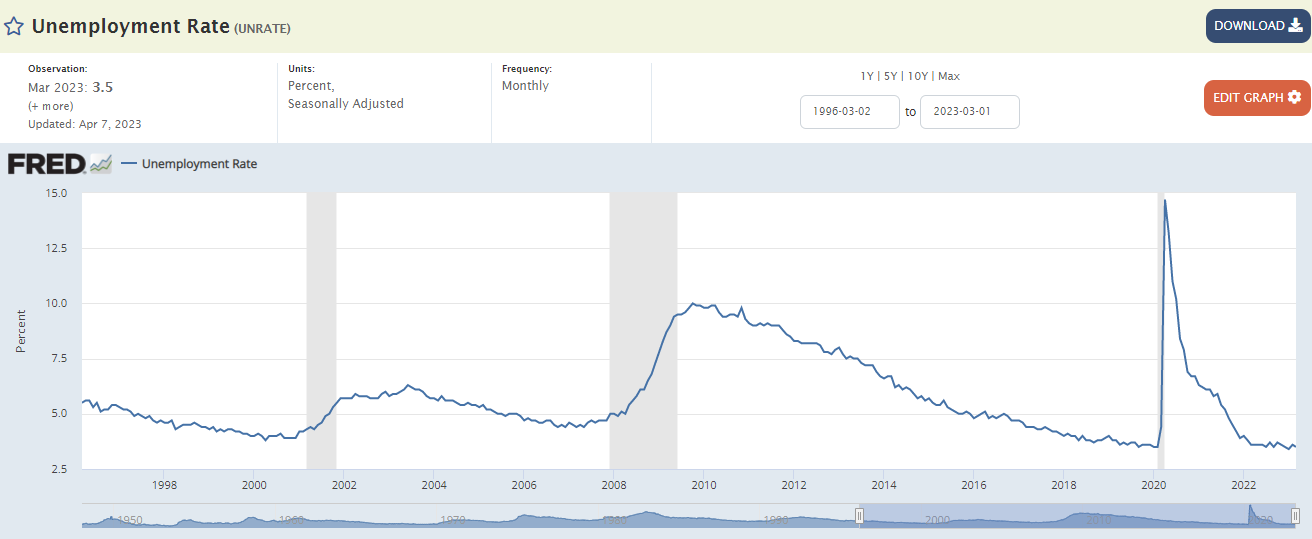
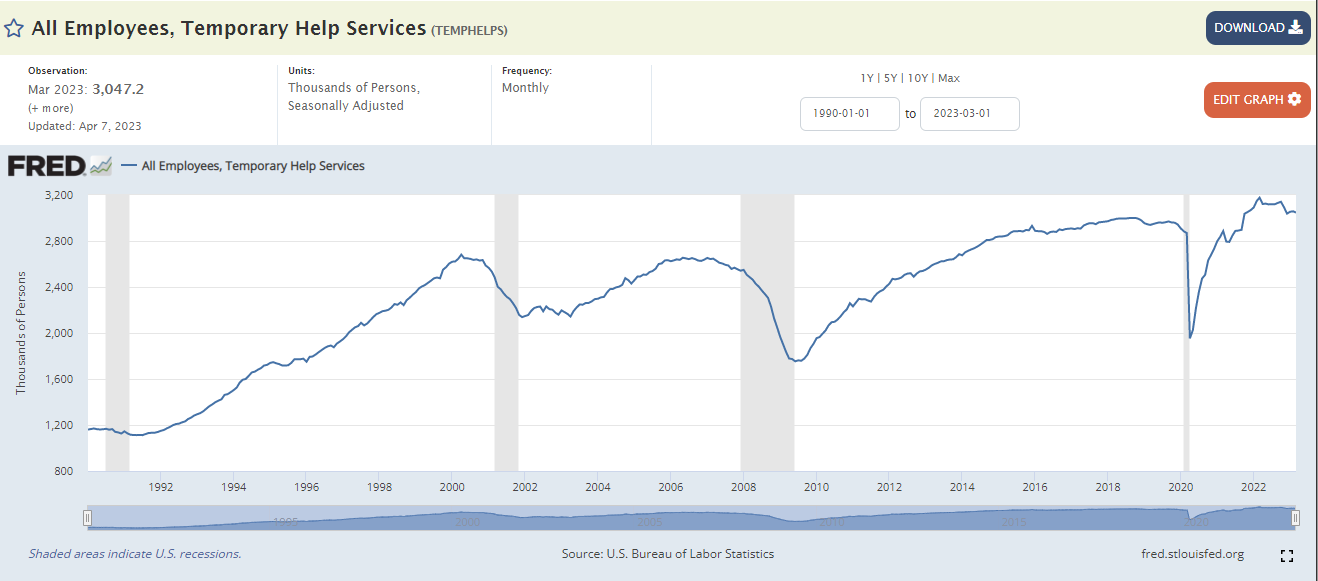
Employment
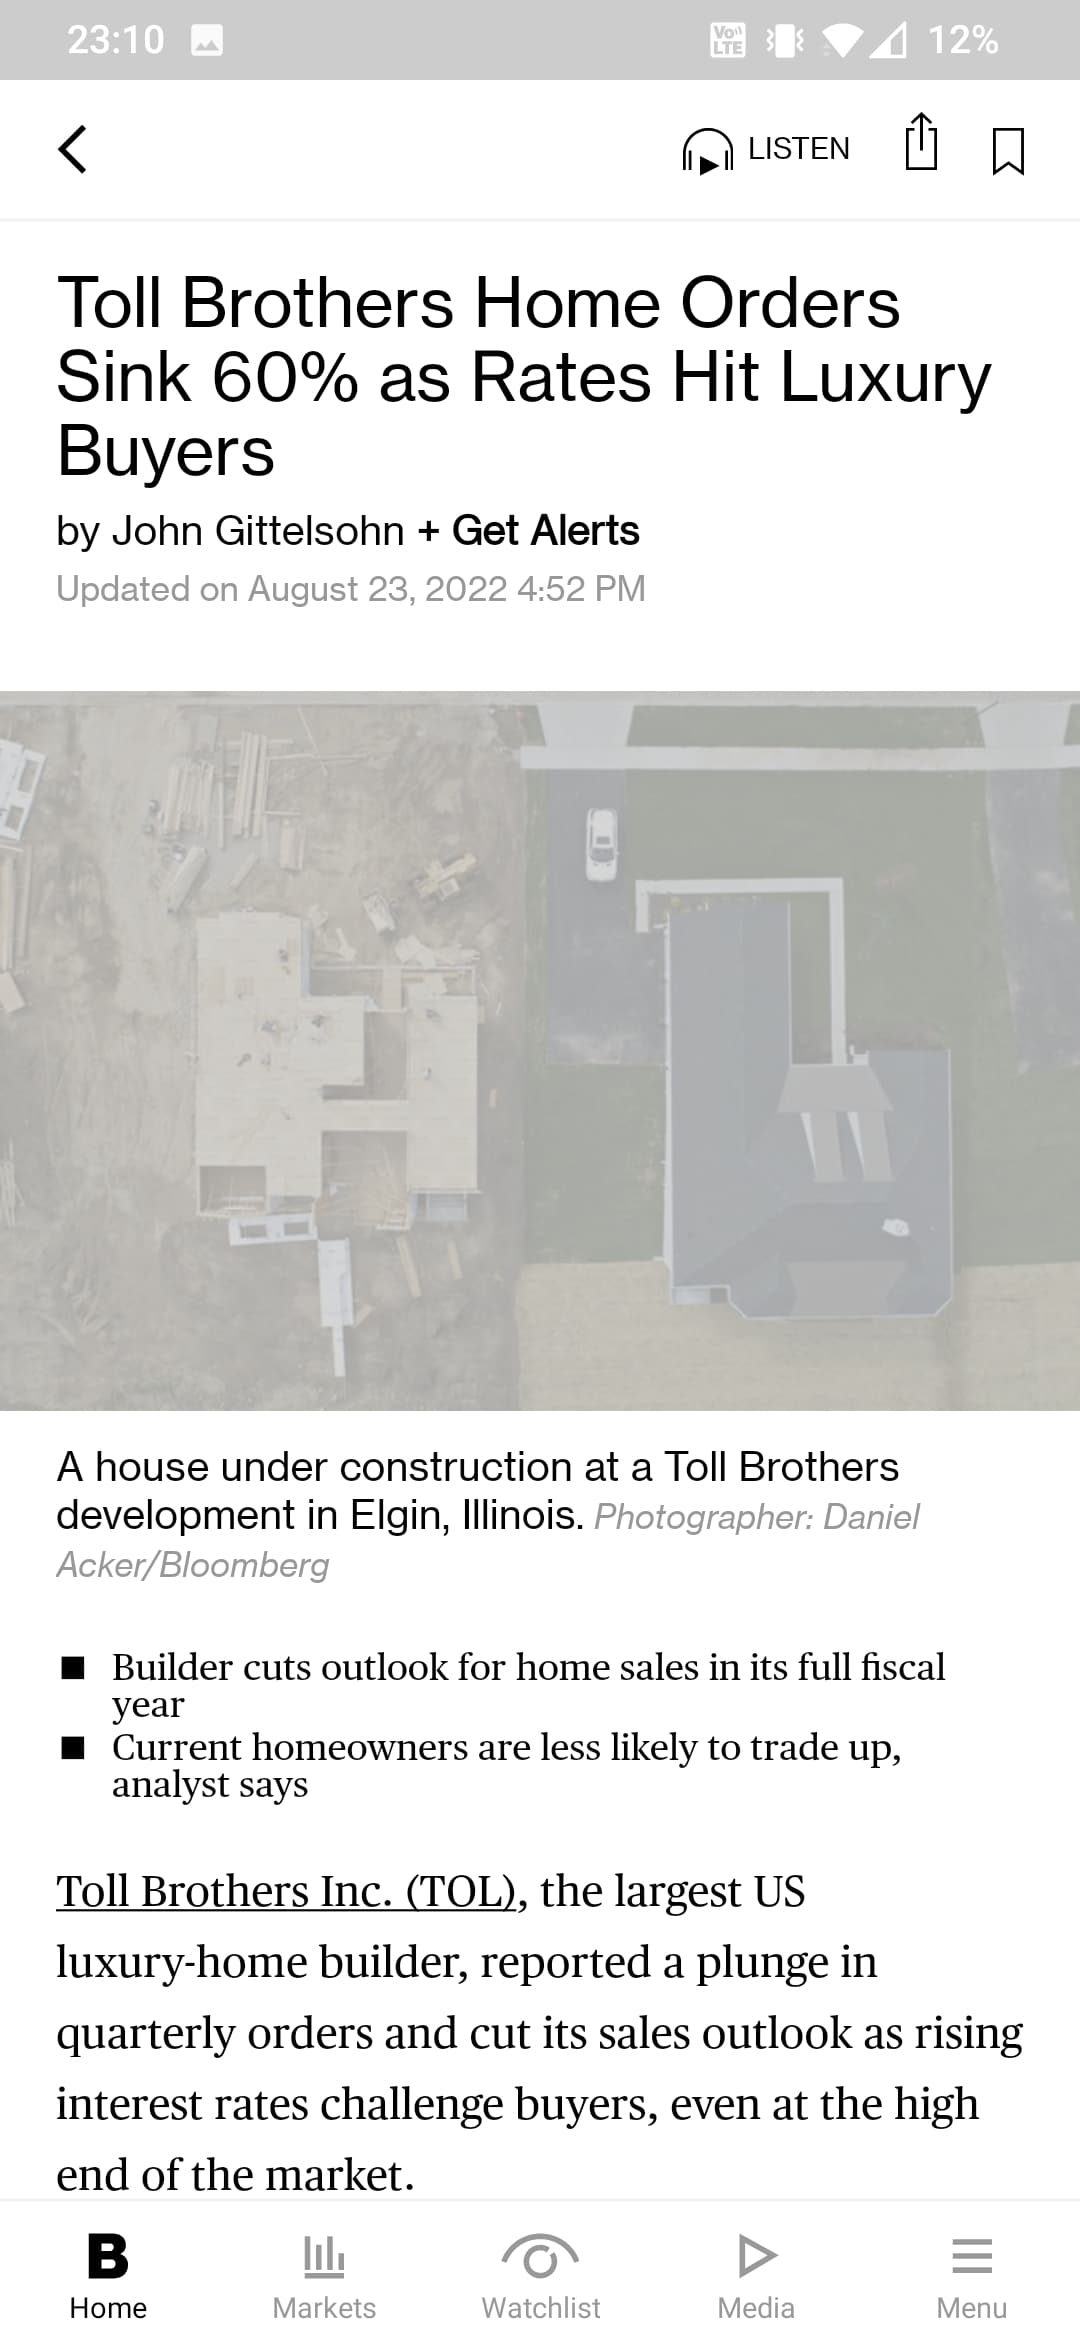
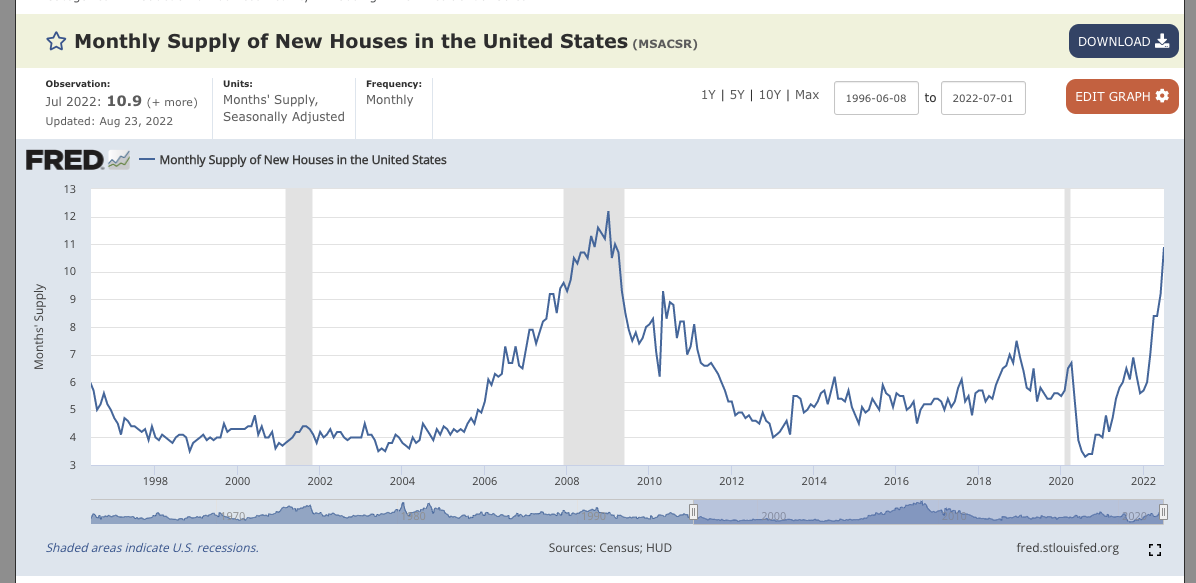
Right now we are likely just on the cusp of seeing the housing market possibly slow.
Yesterday we saw housing starts drop 9.6% & building permits fall 1.3%. As @dooknukem also mentioned lumber prices have been falling dramatically too (from insane record highs) due to drop in demand.
This morning total mortgage application volume fell 2% from the previous week, according to the Mortgage Bankers Association’s seasonally adjusted index. Demand stands at the lowest level since 2000.
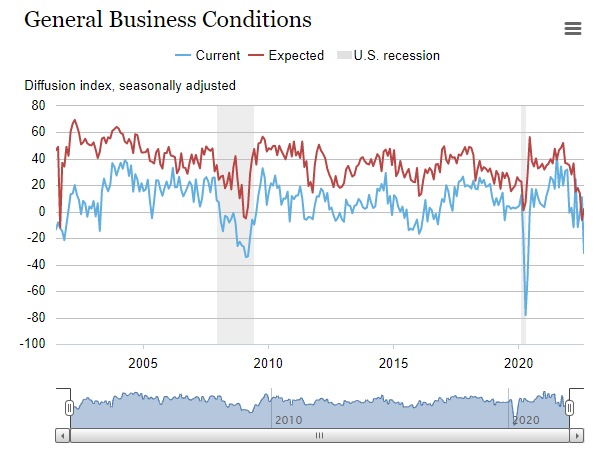
New Orders still seem to be stubbornly high, though we did see a huge reduction in a recent NY Empire State Manufacturing Index. I think we could see this be a lagger as companies are not so much JIT anymore (due to China lockdown uncertainty and other supply chain factors) but instead try to simply get large batches of inventory of something that they believe the consumer will continue to purchase so they have product on the shelves. As we have just seen from Walmart & Target earnings, consumers have cut back purchases mostly to food and necessities while high inflation drains the pocketbooks and job uncertainty looms.
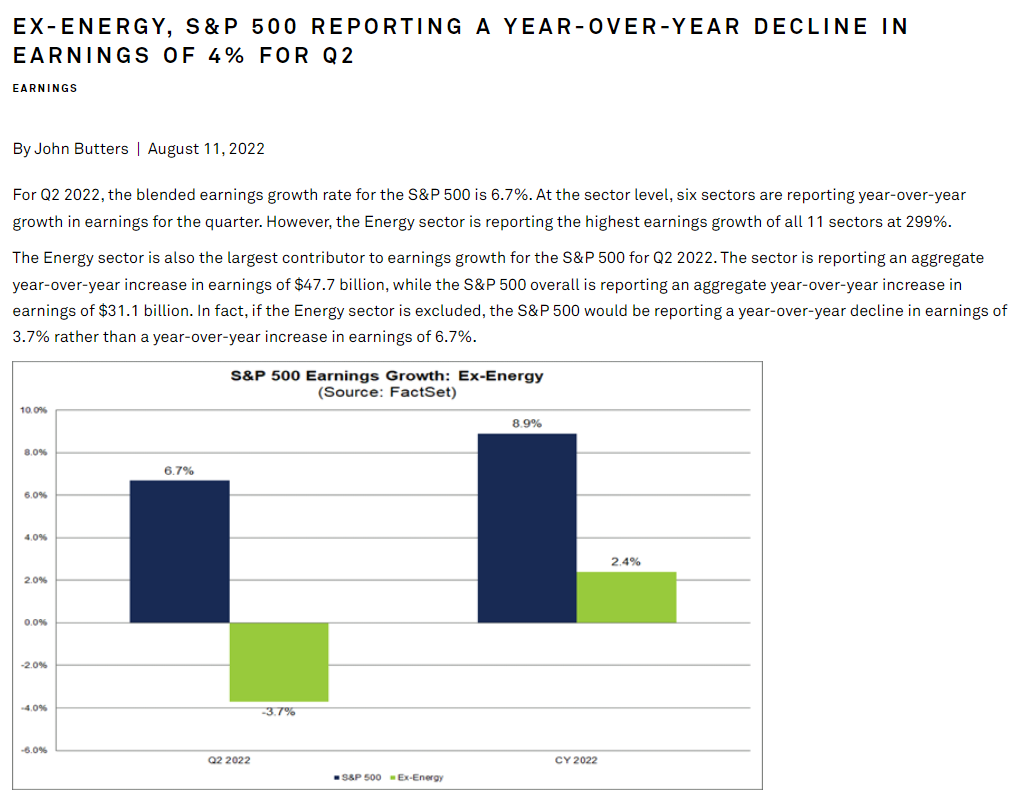
We’ve seen in the recent round of earnings that some companies have remained positive for Q3 & Q4 while others have tried to get out ahead and slashed their profit forecasts. Likewise many companies are starting to layoff small amounts, likely trying to trim some fat and see where things go before making more drastic decisions.
This isn’t meant to replace the Kodiak Bear Thesis thread , instead I would like to focus on the 4 indicators mentioned above. As new numbers & articles come out I will continue to post to this thread and hopefully we can start to develop a timeline for the next step down, or possibly if we see a trend reversal.