Starting this thread to anticipate the rebound of stocks related to homebuilding.
The housing market is still quite hot:
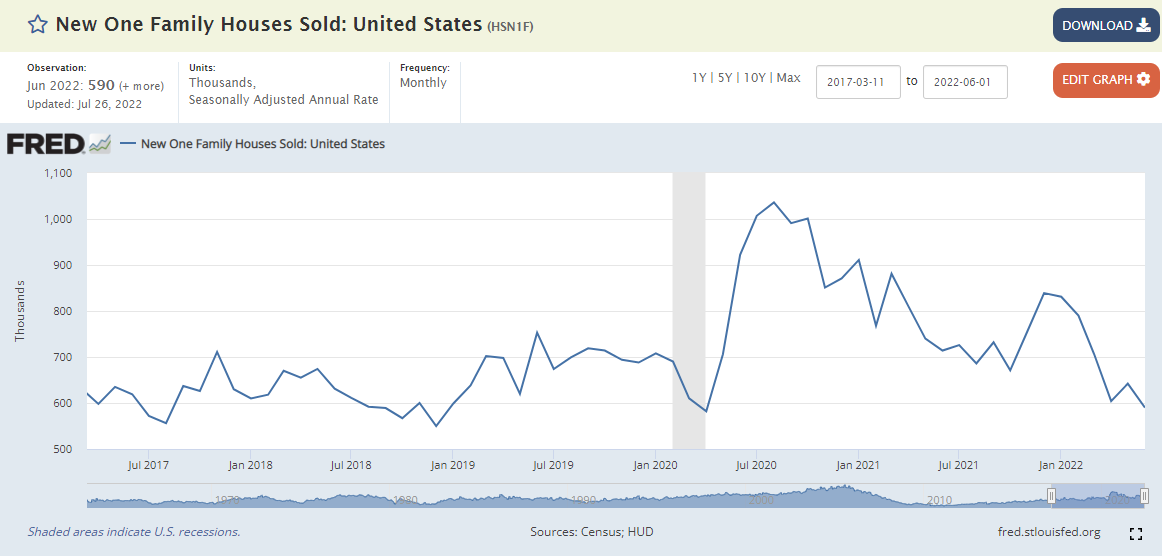
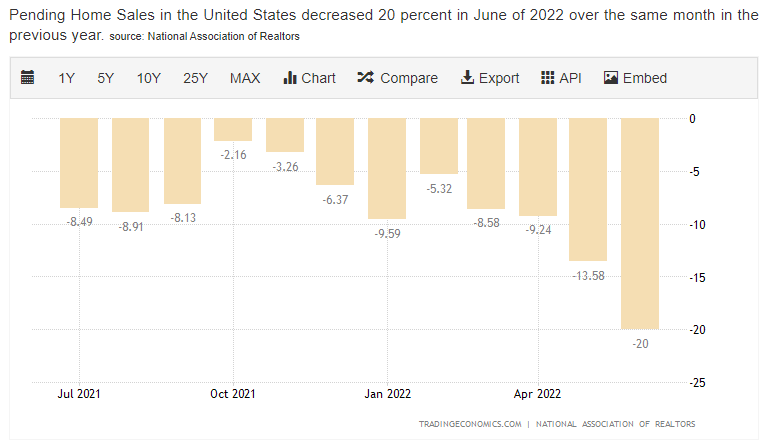
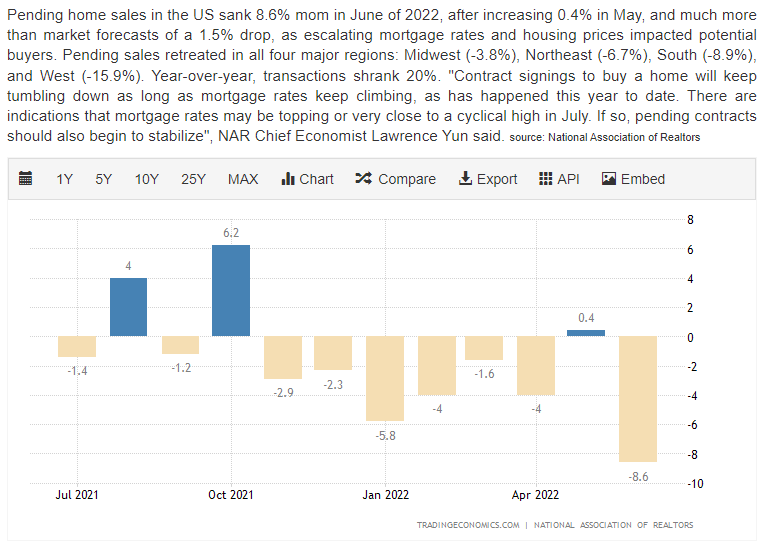
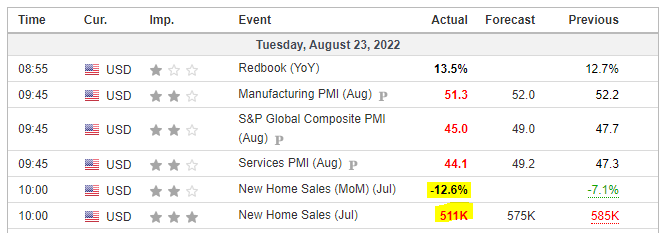
- Existing and new home sales continue at a steady clip
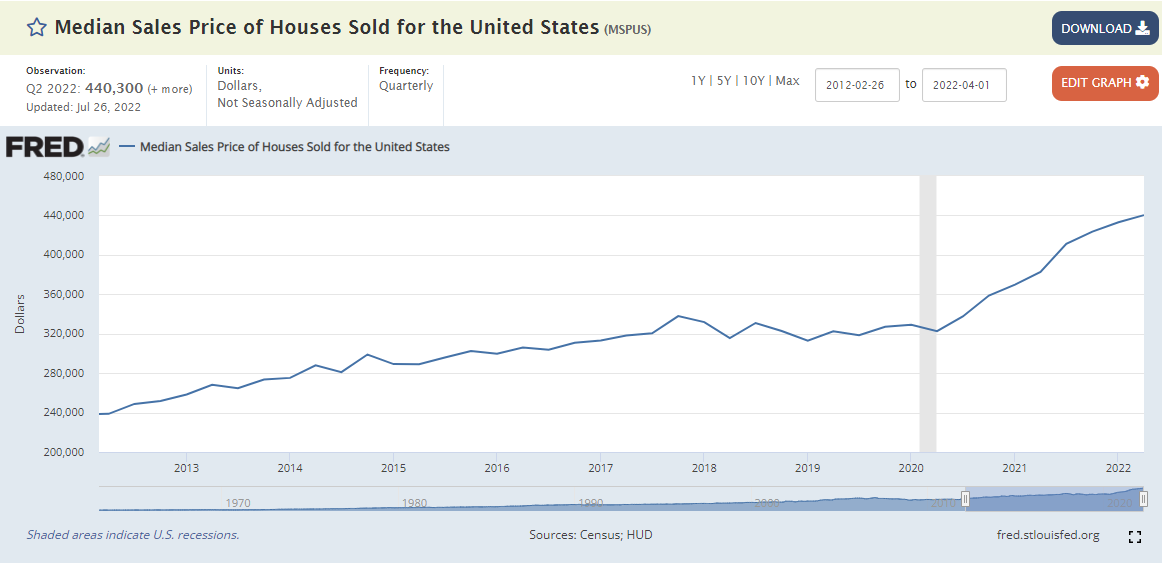
- Median sales prices are at historic highs
- Inventory is rather low
Anecdotal accounts are all about absurd bidding wars and all-cash purchases way over asking.
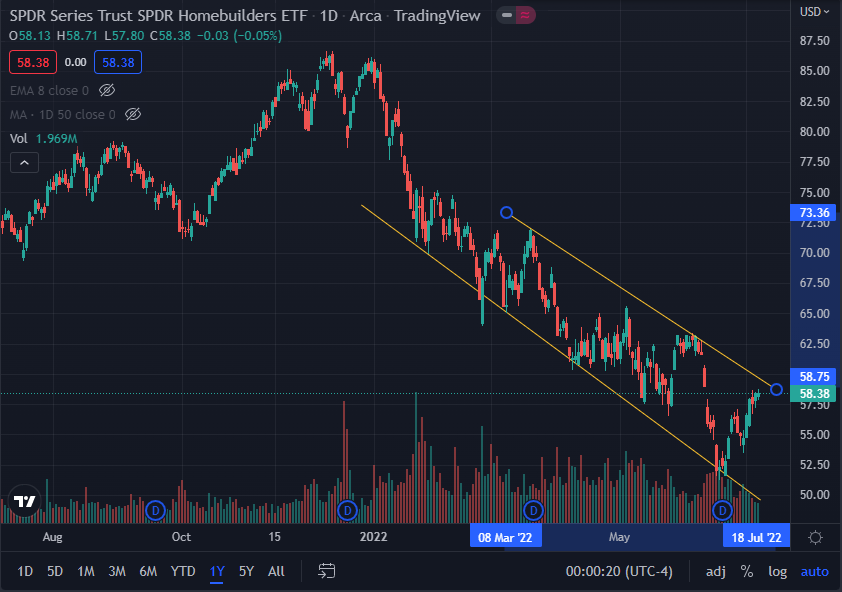
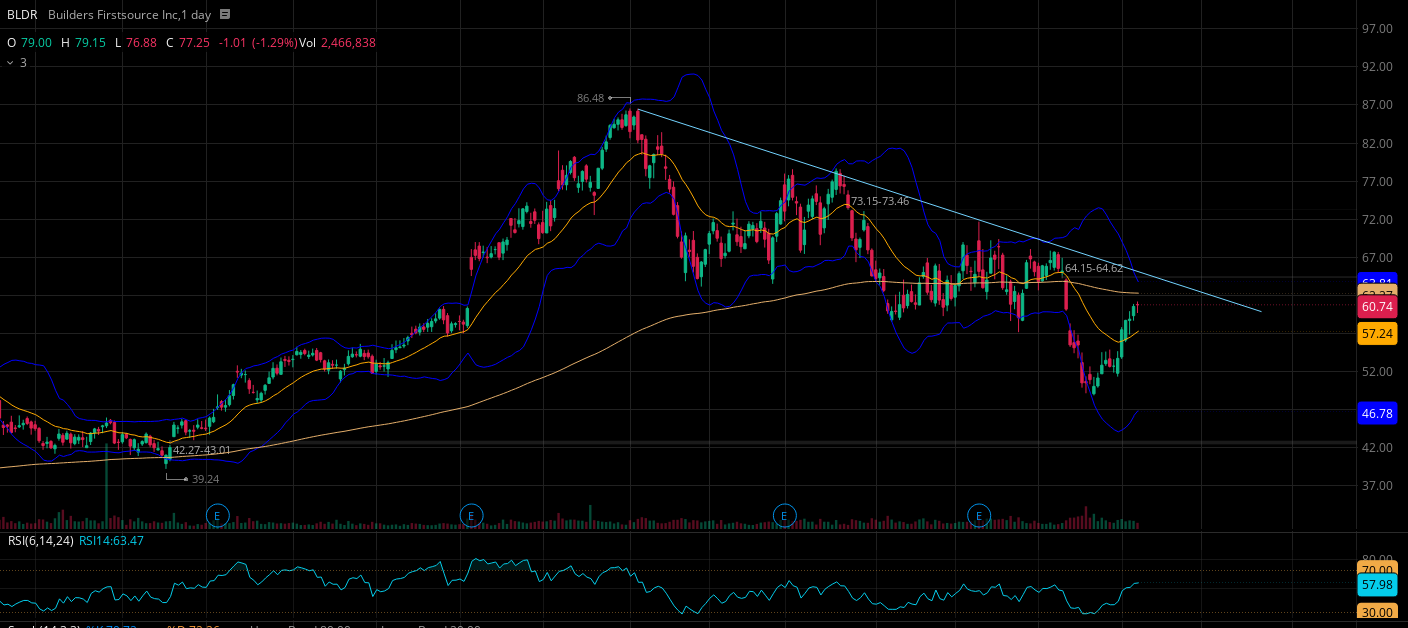
Yet, homebuilder and housing related stocks have been taking a beating. The PHLX Housing Index (HGX), the SPDR Homebuilders ETF (XHB) and the iShares Home Construction ETF (ITB) have been falling steadily for the last 3 months. XHB is down 29% from recent ATHs; ITB is down 31%. And for those who like to live dangerously, there’s the “Direxion Daily Homebuilders & Supplies Bull 3x Shares ETF” NAIL which has fallen 71%. Not mentioning individual companies, but we at some point we’d want to fill that gap.
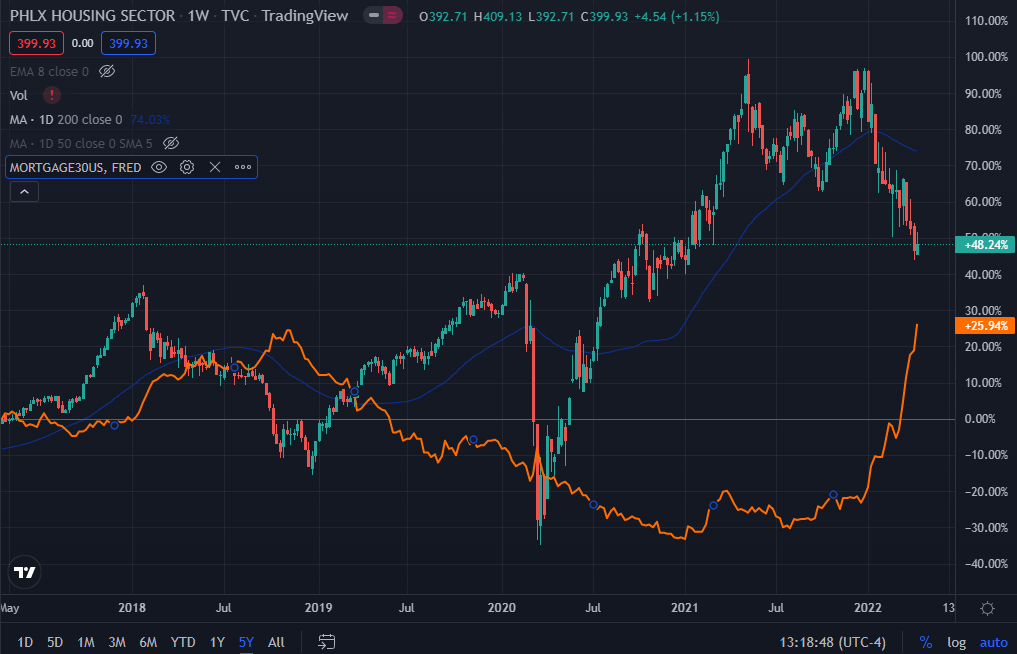
The culprit is the 30-year mortgage, which has shot up to 5% in a matter of months from ~2.85%, and is showing no signs of slowing down. The 30-yr rate and housing stocks have an inverse relationship:
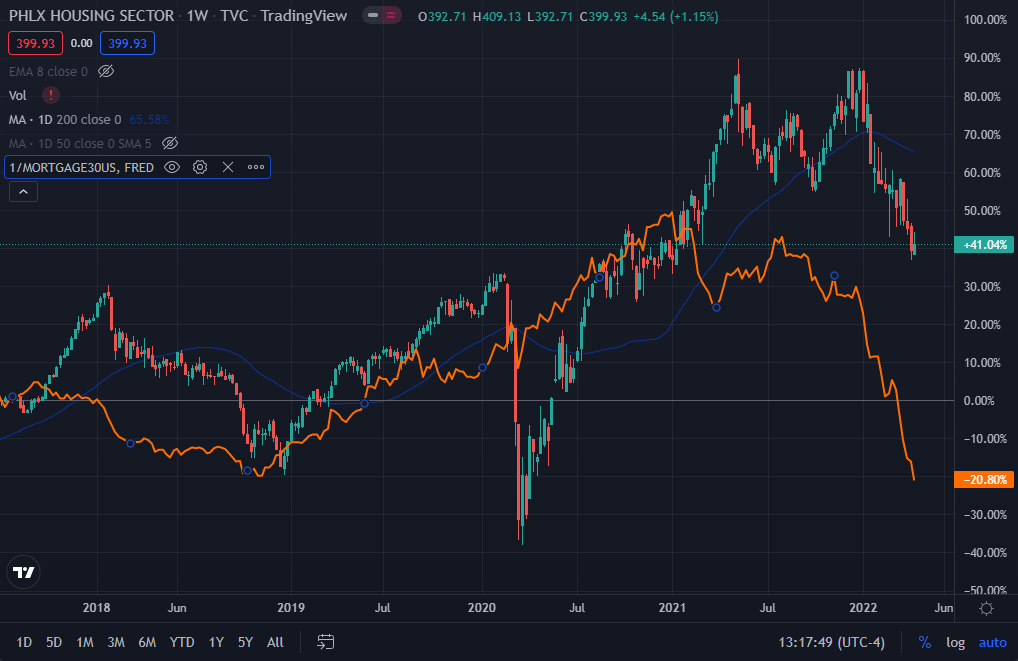
Which can be better seen by taking the inverse of the 30-yr mortgage rate.
Lumber prices have also come down falling about 40% in just a month and a half.
In terms of a general take on housing, unless a recession causes major unemployment, difficult to see how there is a significant deterioration in the housing market. Higher mortgage rates should pump the brakes on prices, though not really make them fall much, as inventory is low and there is robust demand. I read somewhere that vastly more homeowners refinanced to sub 3% mortgages during the last two years, so mortgage servicing is much less of an issue compared to the Housing Crisis. And banks are much more careful about checking affordability so foreclosures from not being able to make mortgage payments should be low. Foreclosures would also need some time to catch up even if they were to rise, as courts are still backlogged with all the ones from the Covid moratorium times. Finally, with price rises likely slowing down, homeowners would be in no hurry to sell, keeping inventory tight.
This is all to say that it would be surprising if housing took a sizeable arrow to the knee.
So, what’s the trade? The most obvious seems to be to wait till XHB (and its constituent) bottoms, and then ride it up.
When will that be? Well, it’s a little hard to tell (isn’t it always…), which is why this is in the Long Term section of the forum. Let’s use this thread to keep an eye on:
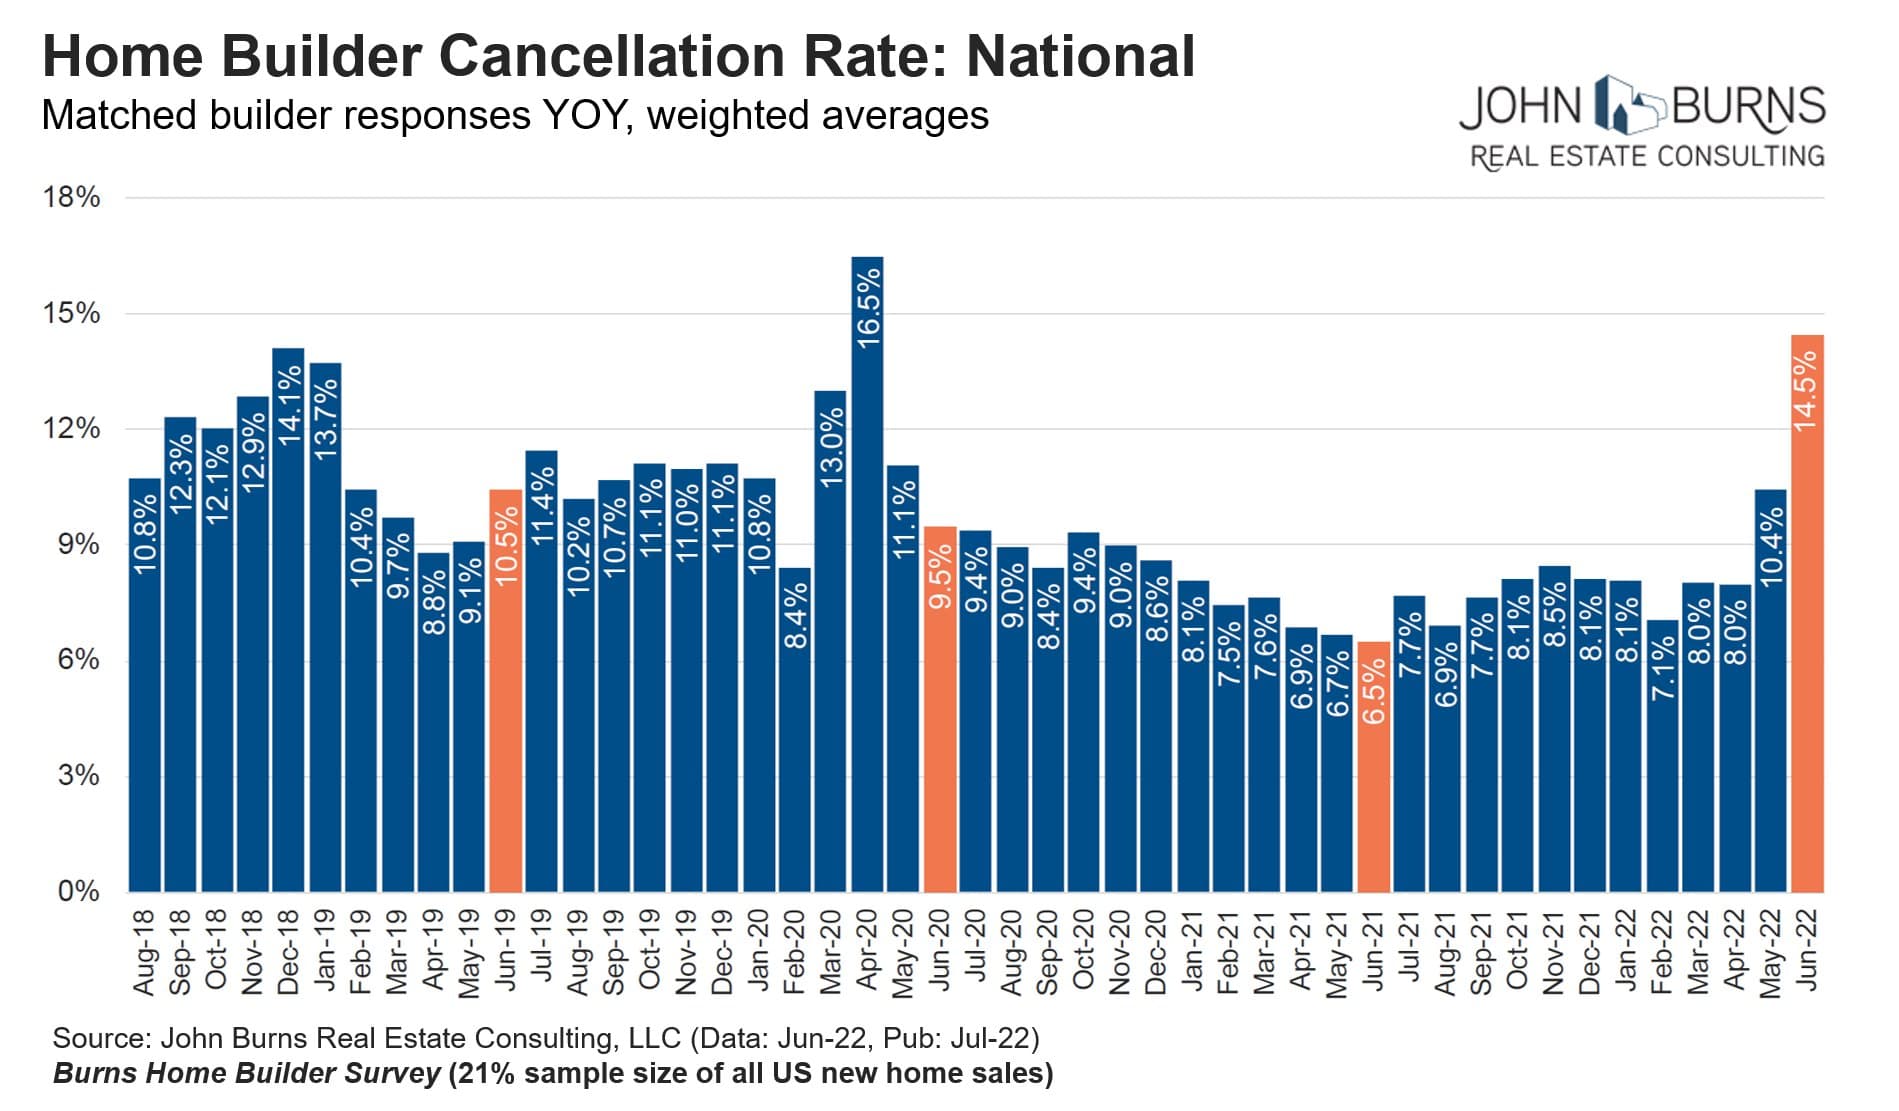
- housing sales and inventory levels - this will alert us to deteriorations in the housing market, which can keep these stocks falling
- the 30-yr mortgage rate - if this flattens out and there is no significant slowdown in sales or increase inventory, we could be looking at a rebound
#housing #lumber #homebuilder #xhb #itb #nail