As far as polling goes the only real aggregator I trust is 538 which has the house going in favor of Republicans 83/17 and the senate going for Republicans 54/46. Obviously the senate raise is basically a tossup so as far as the data we have it looks like the neutral case is the most likely outcome but a slight chance of Republican win in both chambers
Some general thoughts for this week.
We’ve had some weekend catalysts that have come out bearish:
-Apple says it has temporarily reduced iPhone 14 production because of Covid-19 restrictions at its assembly plant in China. It says it will ship fewer units, and customers will have longer wait times.
-Facebook Parent Meta Is Preparing to Notify Employees of Large-Scale Layoffs This Week
Wouldn’t be surprised to open red just based off this, although the night is young.
As for the rest of the week there’s two main catalyst imo, which are the midterm elections as well as the CPI.
Playing CPI is pretty straight forward for the most part, and I’m not going to try and guess which way it’ll go as I am too retarded for even an attempt.
The midterms I do predict will be bullish. My reasoning is according to 538, republicans are forecasted to win both the house (by a wide margin) and the senate (by a smaller margin). If they do win both, that essentially makes Biden a lame duck president and restricts his ability to make trade policies, particularly those with China, meaning less restrictions for businesses.
Main level I’m watching this week is Friday’s support zone, which is right at that 370 area. IF we show a solid sign of reversal there then i’ll position myself on the momentum towards the upside. If we close below there then next level I’d watch is 365.
Lots of market moving things this week to play so be safe out there. Godspeed ladies and gents.
Elections might have the market go both ways Tuesday and Wednesday, but, once Thursday comes and CPI drops, I’m expecting it to be bearish. Commodities for the month of OCTOBER were up, and since those are factors that determine the CPI, I’m expecting the CPI to be above 8.4. (Personally I’m aiming at 8.5-8.6). If these number do come out, that means the FED will have to go with 0.75bps instead of 0.50. Which will make markets red on Thursday. Obviously if they don’t mess up with the numbers due to elections otherwise it should come in hot. I will be full cash to play CPI. I may take 1-2 puts as lotto play before eod a Wednesday.
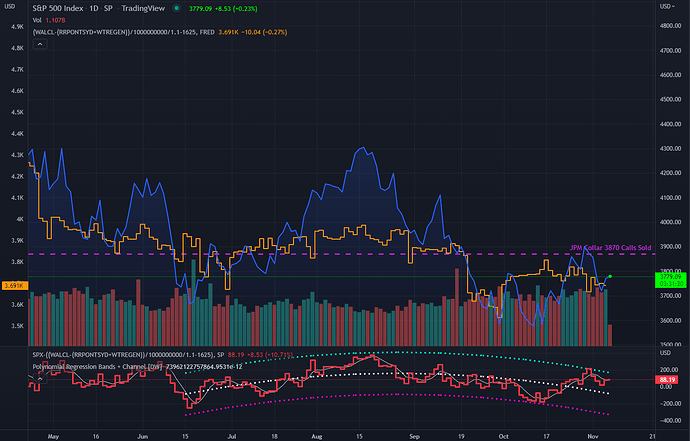
@Anonyman shared this in TF that lets us track net liquidity with market movements that was discussed above - very helpful!
Well, here’s a fun addition to the mix of variables to keep an eye on.
Tl;dr: “History would suggest then that it takes a meaningful amount of time - say 12m to up to 24m - for compensation growth slowing to eventually create a slowing in prices unless there is massive labor overhand like double digit unemployment.”
The deets are worth checking out:
https://twitter.com/BobEUnlimited/status/1589395686524452864
Fantastic video by Maverick as always. You’ve seriously been missing out if you haven’t been watching his videos.
Tonight he broke down his predictions for the mid-term elections and how it might impact the stock market, and how to trade it, etc.
He sees Republicans winning tomorrow and this will be net bullish on markets since Republicans prioritize the economy and fighting inflation.
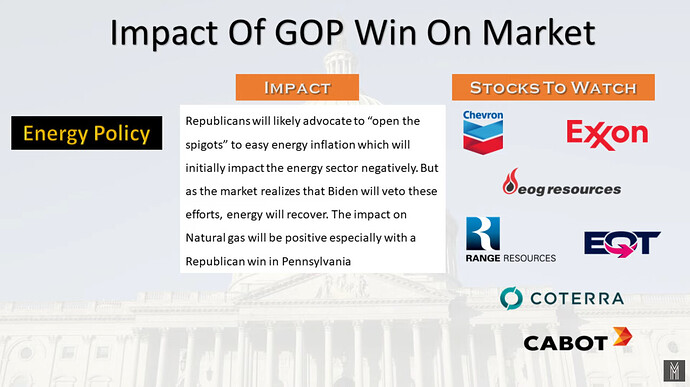
Further highlights on policy impacts:
[size=4]Energy Policy - buy the dip[/size]
There is a chance that energy could initially dip if the market reads it as “Republicans will increase the supply” but the net sentiment should be bullish — This would be a buy the dip opportunity on energy, most significantly natural gas, EQT, UNG, etc.
[size=4]Defense Policy - buy the dip[/size]
Pullbacks on defense stocks would be another buy the dip opportunity. Even if funding to Ukraine is reduced or cut, US continues to sell weapons to Europe. In addition, the policy on China should get more hawkish, which is also war-escalatory.
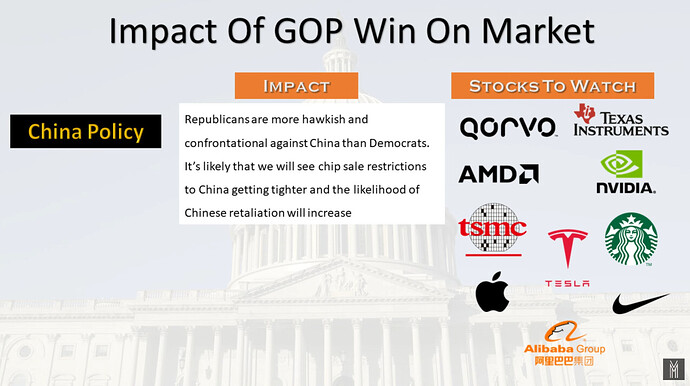
[size=4]China Policy - short[/size]
Self explanatory below. This is a shorting opportunity. Plus also consider war escalations re: defense stocks in my note above.
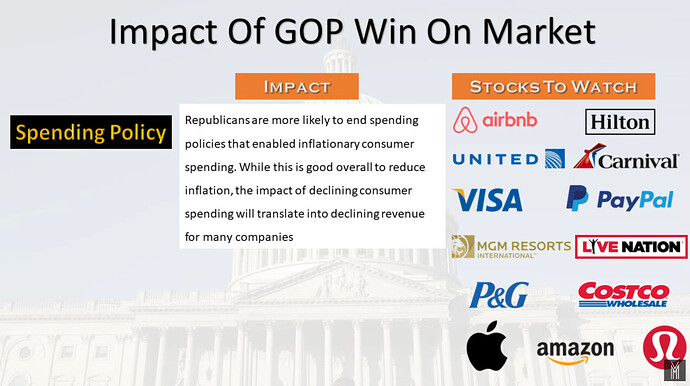
[size=4]Spending Policy - short[/size]
Policies to reduce inflation will also translate into reduced revenues for various companies. This is a shorting opportunity.
This post caught my eye, thank you for sharing! In particular, I was hoping the thread would acknowledge the sever global supply chain issues that the Russia/Ukraine war and China’s COVID controls are causing.
I’m not sure what type of data or chart would support this, but I believe there is an argument that companies are actually slowing quicker than the numbers currently imply (e.g. 7% ann this year), which is “hidden” in the price markups (inflation) to accommodate for the increased supply chain (and raw material) costs imposed on the private company sectors.
In particular, I’m curious how many private sector companies actually have a cash runway more that 3-6 months from today. I would go as far as making a guess that 75-80% of private companies do not have such cash on hand… I would speculate this said “growth” in 2022 will quickly come to head with the loan facilities they are using (and heavily relying on currently) coupled with the increased interest rates on those debts that will begin to drain cash quicker in 2023 if companies cannot keep healthy margins.
They have been pretty accurate the last few times.
Can someone please help me understand why TMV isn’t dropping as hard as it “should” be with SPY being up so high?
Nvm it was a fake pump, but I would still like some input pwease ![]()
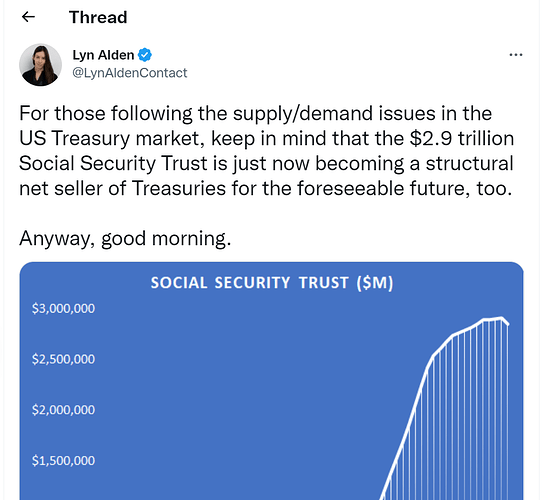
Not sure if this is the right forum but this Twitter thread suggests that Social Security will start selling treasuries soon - to a treasury market that is already having a hard time finding buyers - and therefore long-term bond yields may rise.
The thesis is that until now, SS has been net inflows and what SS does with all that excess money is to purchase long-term bonds. But now that boomers are retiring in droves, SS has become a net outflow and needs to sell these bonds to cover SS payments. The doom and gloom is that SS may run out in 2035.
Not sure why the embed link won’t work. Had to screenshot so it might be a bit of pain to read full thread. Sorry
Regardless, the bottom line is that $2.9T in treasuries may soon start to be sold.
Not sure this is the right response but Valhalla is for sparking conversations so I’ll just say this made me think of the post 2008 days (call it 2011) where you could buy municipal bonds at a discount WITH over 5% interest (all tax free interest). It was a nice time to be able to park a significant amount of cash relatively safely while guaranteeing a 5% return. To boot, you were able to sell these bonds at a premium 5+ years later (call it 2016). It was a great situation to be in if you had excess cash you needed to park somewhere. Seems like we could be heading towards a similar scenario in 2023.
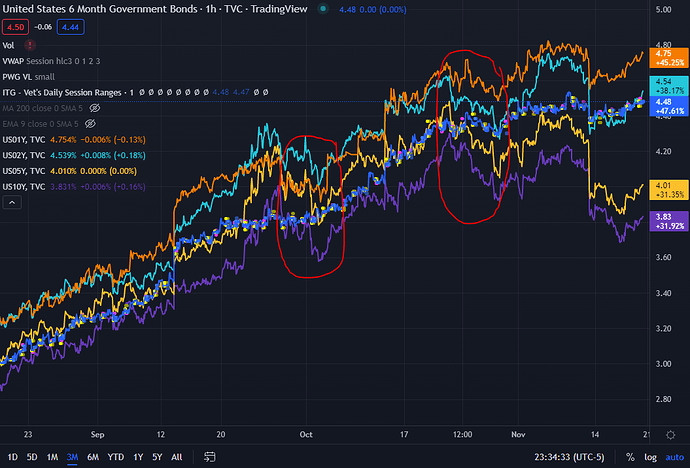
The CPI print severely dislocated bond value trajectories, but they are retracing now. Helped by the Fri Fed Speaker noting that terminal rate might be up to 7%, no doubt. This is not the first time this kind of retracement happened - we see two prior ones just from the last two months. Could set us up for some nice plays in the medium term.
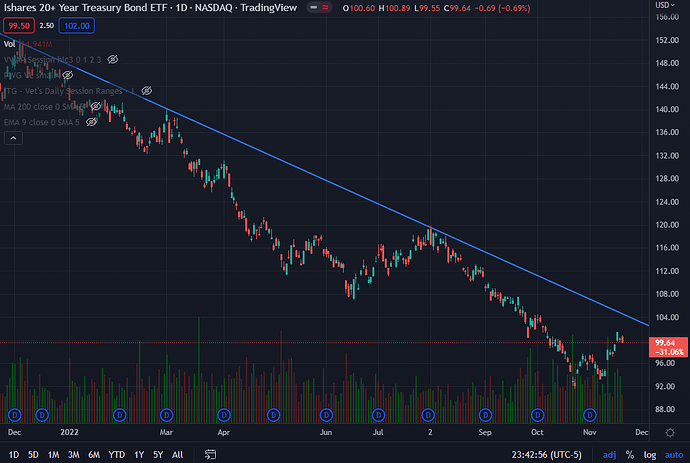
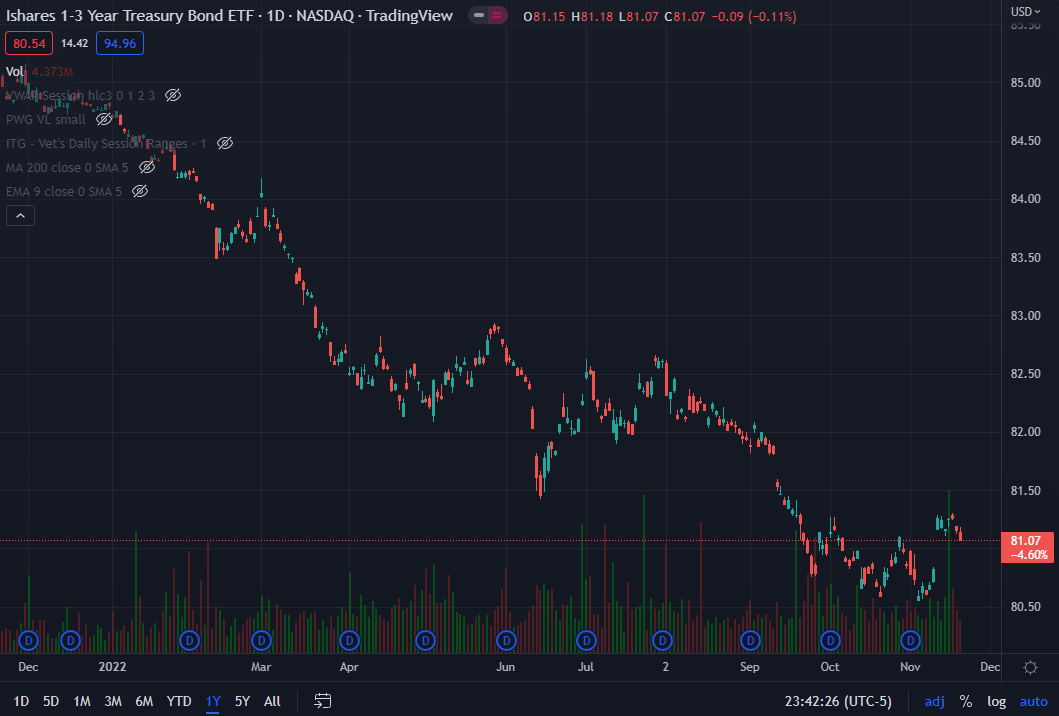
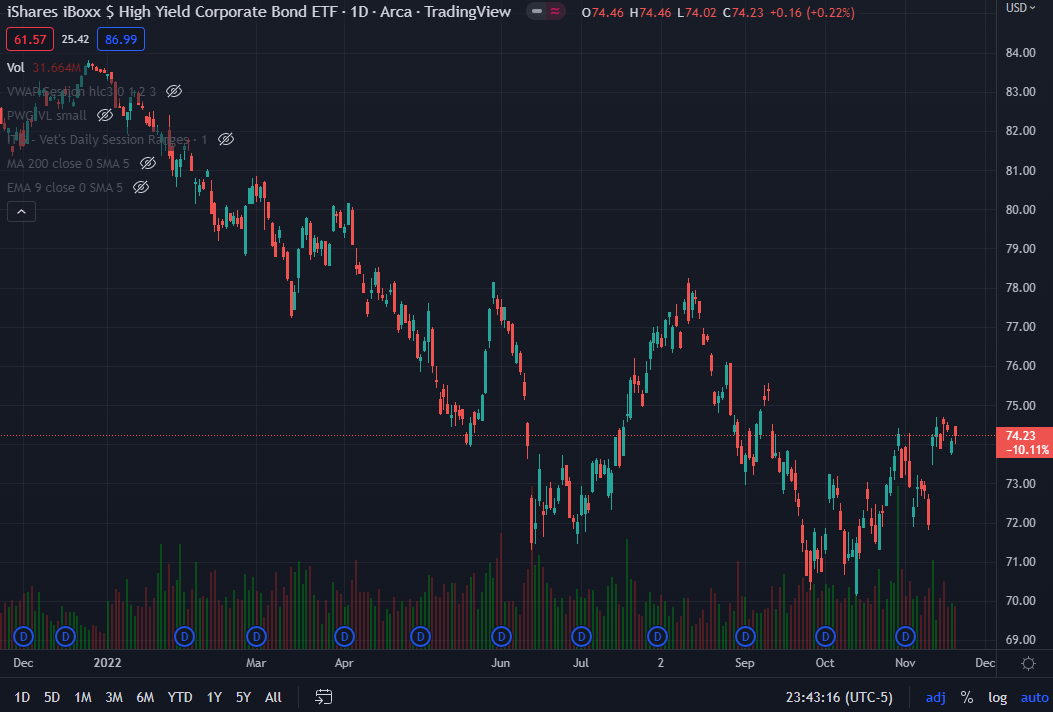
There are a couple of trades one could take, outlined in the Bond Hedging thread. There’s TLT for the long end and SHY for the shorter (1-3 yrs) end. And then there’s @TheHouse 's HYG plays that are less volatile, but track bond yields quite well.
$SHY will be a great play for when the Fed pivots, but as long as they’re still jawboning about Taylor Rules and rate hikes, I would steer towards $TLT for now. A bit early to play $SHY with Bullard pushing 5-7% rates and the 1- and 2-years still below 5%. I’m not saying they will reach 7%, as a matter of fact I doubt they will, but I think starting a position now in $SHY is still a bit early. Wait for the bearish steepening of the Yield Curve.
not my stuff but a good read
Reflecting back on this post, it would appear that we’re following scenario #1 at the moment:
- Inflation data suggests that pressures are slowly easing (i.e. peak)
- Inflation data comes in sharply lower
In the first scenario the market will react bullishly as it is forever optimistic and trades based on the nearer term. In this scenario a “soft landing” looks to still be in the cards.
This is the time where we should be looking to see where the effects of FED policy will be felt because that is what follows peak of inflation. There is a time where the market will switch from “bad news is good” to “bad news is bad” as has been said before and while we’re still not there getting there is probably a lot closer than it was yesterday.
some interesting finds here after todays green dildo swingers party…
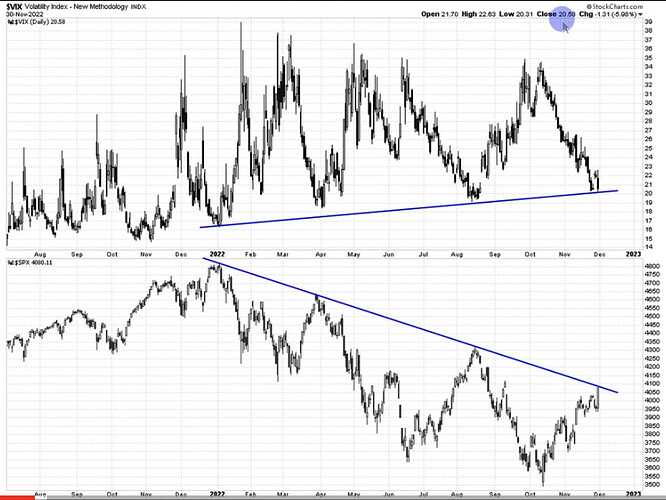
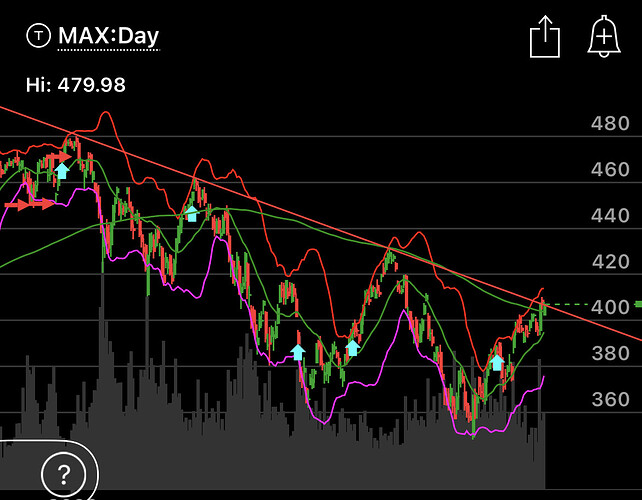
First off take a look at where the VIX and SPY are sitting. we are right on the trend lines. each time we bounced and had a VERY significant move. not saying it can happen again but just playing the trend that has been working
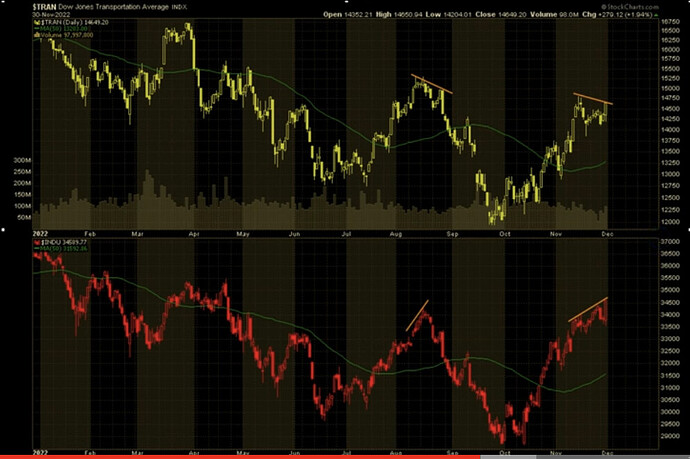
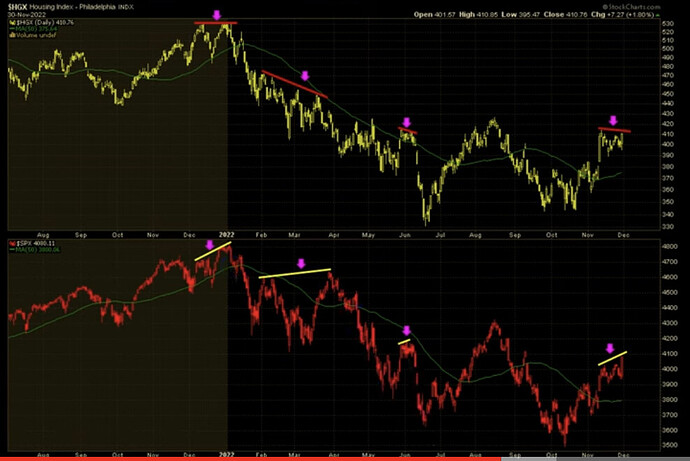
another indicator im looking at is negative divergences across the market
here is transports and industrials
here is housing compared to spy
so on the back of all this we have big data drops on friday. volatility is still high so expect a move between 395-410 for the month. the rest of the week the new expected moves are between 401-413. fed is still raising rates. and we are currently banging our heads on the trend lines. trade safe yall!
hey all coming back with a new update going into tomorrow.
looking at the copper chart vs s&p you can point out multiple negative divergences where copper has marked the top of these spy rallies. we are seeing yet another one take place(surprise surprise) as spy is touching its upper trend line we are also seeing divergences take place which in theory could mark a top to this bear rally
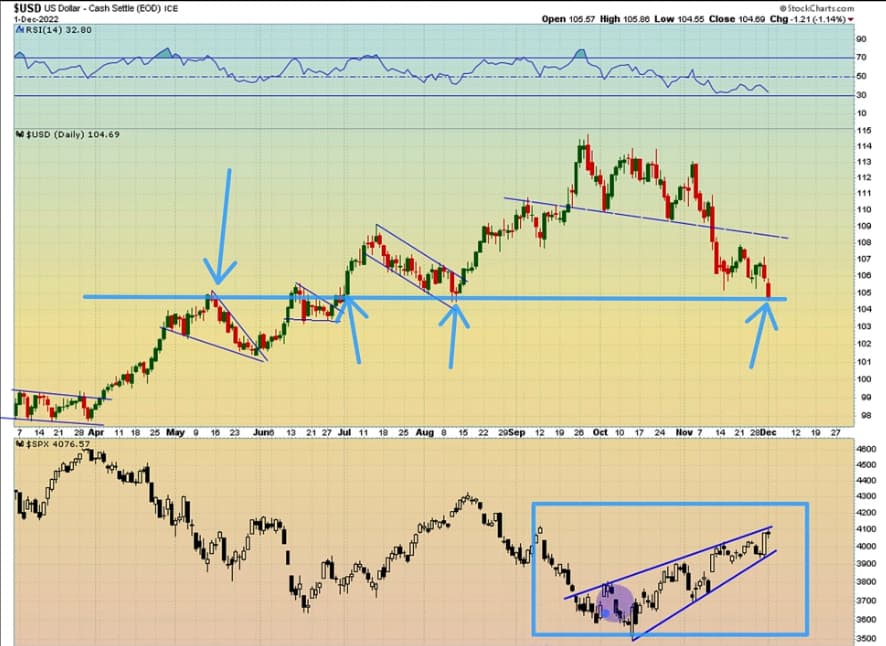
another indicator i love watching is DXY vs SPY.
i love the correlation between the 2. today we saw a big move to the downside on DXY which in turn made spy BOOM to the upside. well the dollar being around this 105 mark is interesting. Very “strong” level of support. last time we seen the dollar here we shot up to the upside while spy got spiked to the downside.
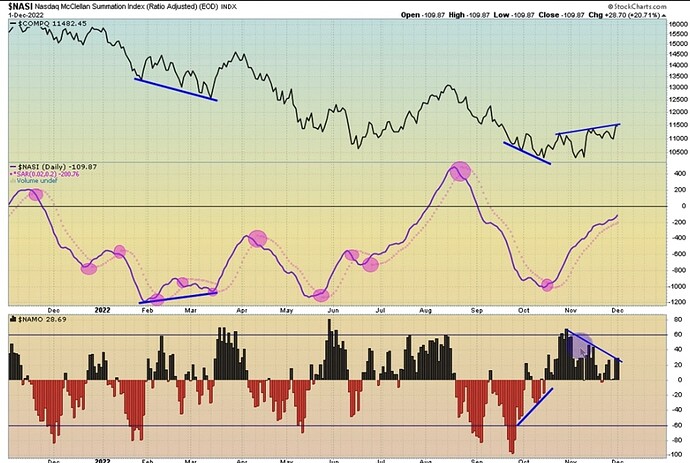
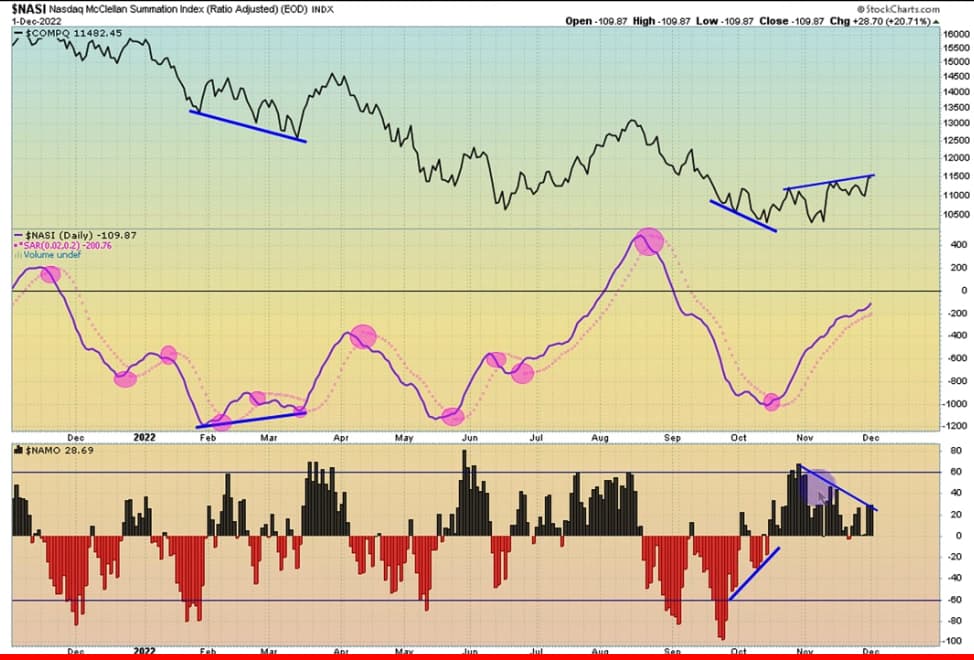
another indication of marking the highs i see is using the new highs and low Indx. each time we seen a flip to the upside on the index it has marked the s&p as over extended. the areas highlighted in pink indicate where we have been over extended to the upside before we saw spy shoot back down
on the flip side of things. (bullish indicator)
we are seeing on the Nasdaq McClellan summation index that the parabolic sar (dotted pink line) has not ticked up or crossed over that summation index line (purple) meaning that we are still very much bullish until we see a crossover take place
with all that being said i feel like there may be a little more room to grow yet. options markets are pricing in a move tomorrow somewhere between 411.5 and 403 so be weary and mark your zones of support and resistances. catch you all in the morning.
coming on here to express my thoughts on the coming weeks… today we got some pretty crappy data numbers and spy cracked down immediately below the lower daily expected move of 403…. once the market opened we saw a quick recovery back up over 403 and back into range we went all day the daily high options markets were pricing in was around 411 and the low was 403 and we traded almost dead center of that all day. that data drop seemed to not have much of a hold and previous drops have had before…… i think spy is still pricing in Powells speech and the optimism is outweighing the data currently. so what does this mean for the market? well i think this is bullish. piggybacking what conqueror was saying earlier in TF seemed to make a lot of sense. for now we are in optimistic stage where rates are slowing down and news that inflation has likely peaked… conq mentioned that the next catalysts to knock the market down will most likely be earnings and how inflation has had an effect on these companies. we just saw the minor beginning of this with the latest earnings releases… that was the start to a long journey of bad ERs to come i think. so from now until those ERS begin to come out (end of January) i see the balloon continuing to float higher. we might stay in this chop box from 410-395 for a while as well as we get closer and more uncertainty arises. but if we break that 410 and hold above it i don’t see a reason for the market not to go up… 410 is that line of resistance we’ve been respecting since january. and each passing day that number gets lower as the trend line declines… short term looks quite bullish but long term (once ER season comes back) is bearish. wheew that was a lot!
hey all, boner back with more charts, more lines, and more hypotheses on overall market movements. lets get right into it shall we
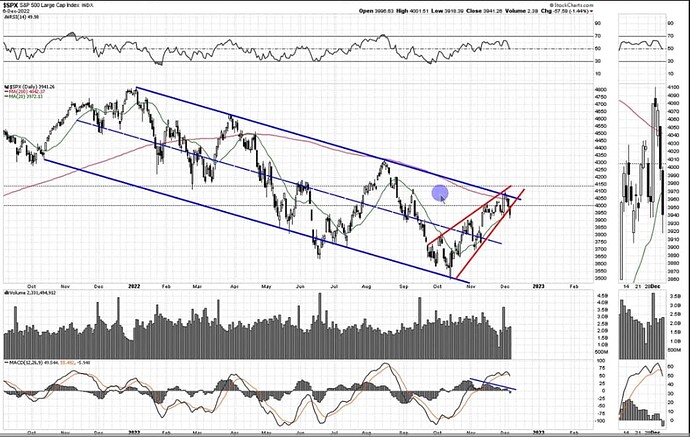
firstly the s&p has broken out of this ascending wedge pattern to the downside and simultaneously bounced perfectly off its daily trend line.
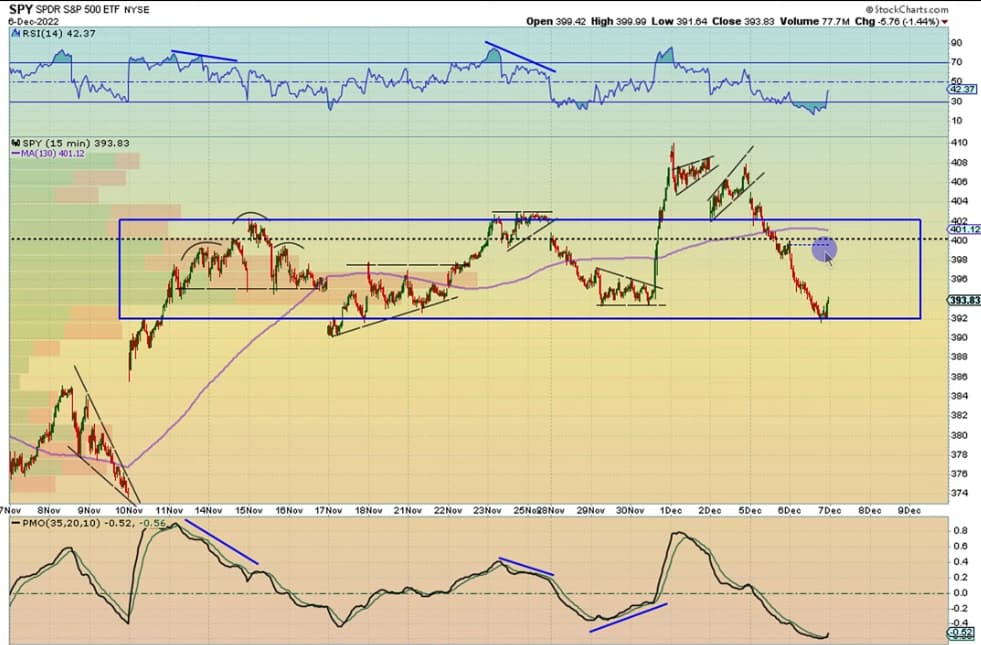
second thing i want to point out is spy has also has a 2 sigma move to the downside breaking far below its lower weekly expected move of 400.30 and is now trading around 393. massive move to the downside and put us right back into that chop box territory between 392 and 402… we are also seeing a bullish crossover on the PMO which could be a sign as to getting a small relief bounce from these levels… obviously data dropping Friday can hinder that as well.
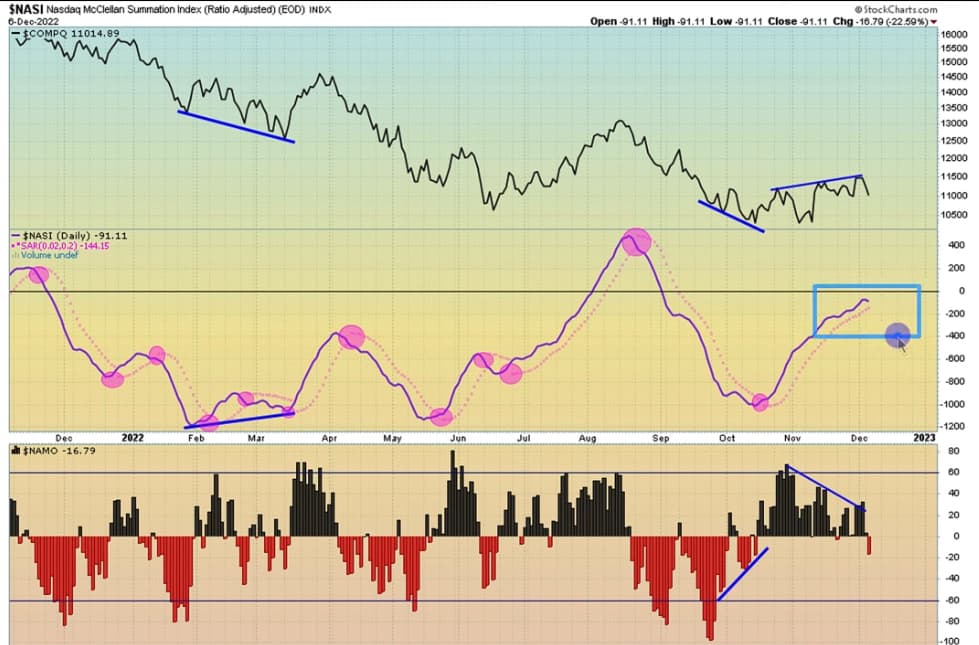
third. the summation index for the NASI has finally started to curl down. looking for that cross to the downside to try to confirm that peak in the recent rally.
this could very well be the start again to the third leg down of the bear market. it doesn’t have to happen all at once. yes well have green days but i think the overall trend is changing and now we should be seeing more red than we do green. today in VC we talked about how companies are going to be seeing the effects in there upcoming earnings. we may finally start to see misses coming up in January when big companies earnings start coming back to town.
LASTLY…i know finally right? HYG(smart money) vs SPY (dumb money) has been showing a break in trend again. previous times have shown when HYG makes a higher low and pushes up while SPY makes a lower low you will usually see SPY turn around and have a rally upwards. as house calls it (HYG is forward looking to what spy is going to do in the future)
this could indicate spy is due for a bounce after this over extended move to the downside.
alright yall thats all i got for you tonight. see you all at market open.
-Boner Out✌️
