This article came through my inbox, thought I might post it here to see some thoughts from those of you who this would be a little bit more relevant for; and because I can’t tell how much of this info is laid out straight vs. cherry picked and spun. All of the points laid out in this article interest me, starting especially with the bit about the interest earned on short SPX positions currently outweighing the dividend yield, the stuff on GDP growth and how that will affect the interest vs. dividend yields, and the apparent cracks showing in the bond markets. It’s Seeking Alpha, so it is very possible I have just wasted an hour looking over and posting this, lol. Here’s the links and most of the points pulled out into this post in case there is something to work with here-
https://seekingalpha.com/article/4579853-spx-another-great-shorting-opportunity
https://archive.ph/ILKhO
Gonna copy over a few snippets from the sections that I’m most curious about below, is there any important context I’m missing or that’s being left out or exaggerated by this author? Trying to see past the guy’s clear bearish bias (the same type of bias I’ve been tending to easier fall into myself the past year) and to sus out what if any of this info could be actionable and how much is just clickbait hopium aimed dead on at those of us who feel like the market hasn’t been doing what it ‘should have been doing’ lately. The top comment talking about the guy having a history of shorting bottoms definitely stands out as a red flag, but a few of these points do seem to be worth thinking about.
Alright, here’s text from the article, there’s a few Bloomberg charts that accompany these paragraphs but I’m on my phone and was not able to download the images directly from the archive site and screenshots I did try to snap to embed ended up jpeg-ed to illegibility before even trying to post them, but that’s why I made the archive-
Shorting The SPX Is Highly Cash Flow Positive (Is it actually though? Serious question/line of thought, there’s gotta be some bits of info or context that’s being left out in these headers, right?)
When shorting stocks, investors receive interest payments for lending the money to borrow the stock, and in return must pay any dividend payments that the stock makes. Currently, overnight USD libor is 2.9% higher than the dividend yield on the SPX, meaning that a short position will yield a steady positive return all else equal. As the chart below shows, the current spread is the highest since November 2007, following which short sellers made a killing. Chart-Overnight USD Libor Vs SPX Dividend Yield (Bloomberg)
Nominal GDP Growth Is Set To Collapse
While shorting the SPX generates positive cash flows as interest rates exceed the dividend yield, a key factor that must be taken into account is the pace at which dividends are likely to grow at, which tends to track the performance of nominal GDP. If nominal GDP growth exceeds 2.9% then shorting will likely generate losses assuming no change in valuations.
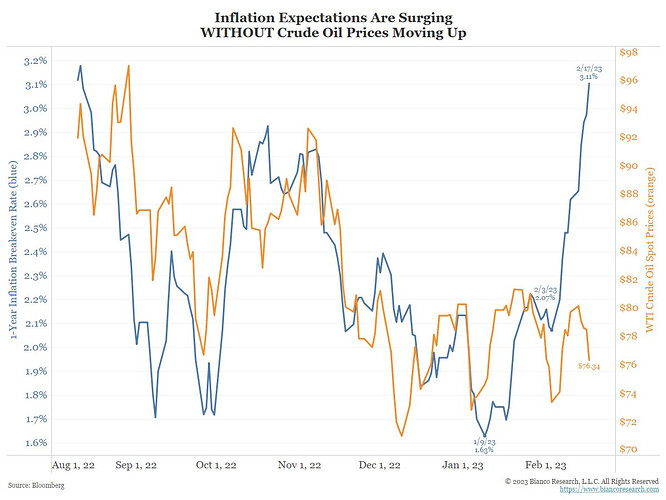
1-year breakeven inflation expectations currently sit at 2.9% and real GDP growth is likely to be negative over this period. The Conference Board’s Leading Indicator Index, for instance, sits at -6.0% which is consistent with negative real GDP growth over the next few quarters.
Chart- LEI Vs Real GDP Growth (Bloomberg, Conference Board)
Money supply growth is also pointing to a collapse in nominal GDP growth. M2 growth is often a good leading indicator of subsequent nominal GDP growth, and it is now in contraction for the first time on record. If CPI growth is faster than money supply growth as is the case at present, this suggests that real GDP is in contraction. I would not be surprised to see nominal GDP turn negative over the next 12 months, particularly if stock market sentiment turns sour and the demand for cash surges, but even if this does not occur, 2.9% seems optimistic.
Valuations Face Downside Risks
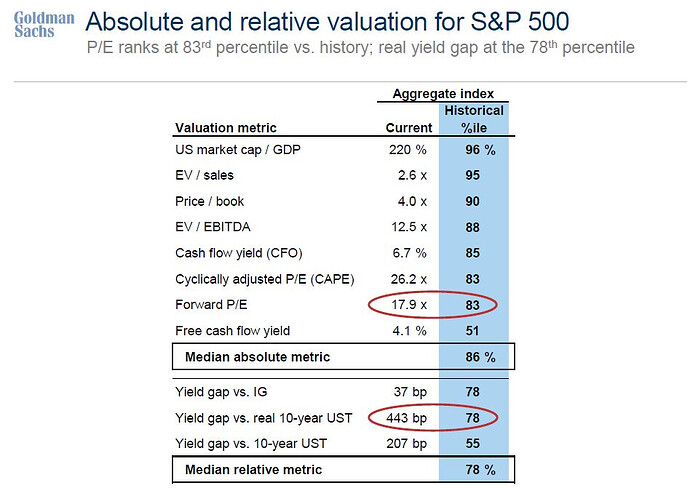
The rally in the SPX since the October lows has seen valuations rise back into extreme territory. The price-to-sales ratio is above any other point in history outside the past 2 years, and free cash flows are in decline amid intense downside margin pressure. The equity risk premium - the difference between expected returns on the SPX and expected returns on cash or bonds - may well be the lowest it has ever been from an ex-ante perspective.
Chart-SPX PE Ratio, PS Ratio, And Profit Margins (Bloomberg)
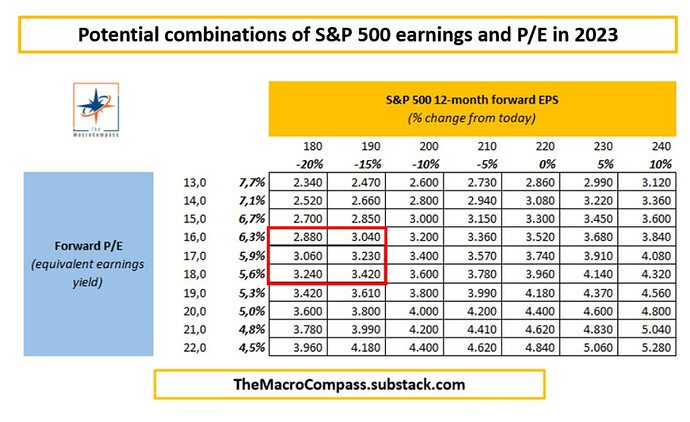
For instance, if nominal GDP growth averages 2.9% over the next 12 months and dividend payments follow suit, this would result in 4.6% total returns after taking into account the current dividend yield, which would be in line with current interest rates, meaning a zero percent equity risk premium. Considering that the long-term average equity risk premium is 5%, this suggests that stocks face major downside risks. The SPX dividend yield would have to rise to 6.7% in order for the equity risk premium to return to its long-term average based on the above assumptions, which would require a 75% decline in stock prices.
The Bond Market Is Giving An Early Warning Signal
Renewed upside pressure on US inflation-linked bond yields is putting pressure on corporate bond yields. In ‘normal’ economic conditions, rising real bond yields tend to coincide with narrowing high yield credit spreads as both are driven by improving economic conditions. However, the Fed’s increasingly restrictive policy is now occurring alongside a deterioration in economic conditions which is causing high yield corporate bond spreads to remain elevated. As a result, real high yield bond yields are rising and suggest renewed downside for the SPX.
Chart- SPX Vs Real High Yield Bond Yields (inverted) (Bloomberg)
I’m still holding three of those HYG puts, so the last portion talking about corporate bond yield spreads of course stood out to me, but I have also had issues separating out the chaff in the past, so I want to improve there…this is as good an opportunity as ever to learn a bit more about the actual mechanics of the position I’m in beyond the basic correlations. Is any of the stuff laid out in this article sounding like it holds water or am I just being pulled in by confirmation bias?
Opening long term short share positions on SPX is not quite something I’m involved with yet, how much of this, if any, can even really be applied to simple puts?
Along that train of thought and moving somewhat away from that article, a lot of the overall focus in the market feels like it’s switching to time, both in the sense of timing tops/bottoms with all these 0dtes as well as what feels like a shift more and more towards theta benefited strategies (and all that comes with those territories, either really really being on the right side of it all, or really really not, hah).
I don’t like trying to time bottoms or tops anymore, just hasn’t really ever worked out too well, and am not really in the position to be able to be playing some of the types of strategies I probably would prefer, but until I can I still want to capitalize and pull money from the market wherever I can…so yeah, all this just SA junk or any info we can work with?
