SPY Tech Anal: October is Spooky Season for Bulls

TLDR: if we don’t start bouncing here, very good chance that we just fucking drop another 20% ngl.

Now let’s look at the monthly chart for SPY. We are at the 50 MA (green line). This has been typically a strong support for SPY throughout the years. There is a good chance that we bounce off here, but that would still just be a bear market rally, rather than an actual reversal. Another thing to note is that we did not get a bullish divergence on the monthly, possibly hinting that we might not be at the bottom yet. Also since we’re starting to head lower than the 50 level on the RSI, we might be starting another 20% leg down from here. Not good, esp with these huge monthly volume red candle showing follow through on the last red candle.

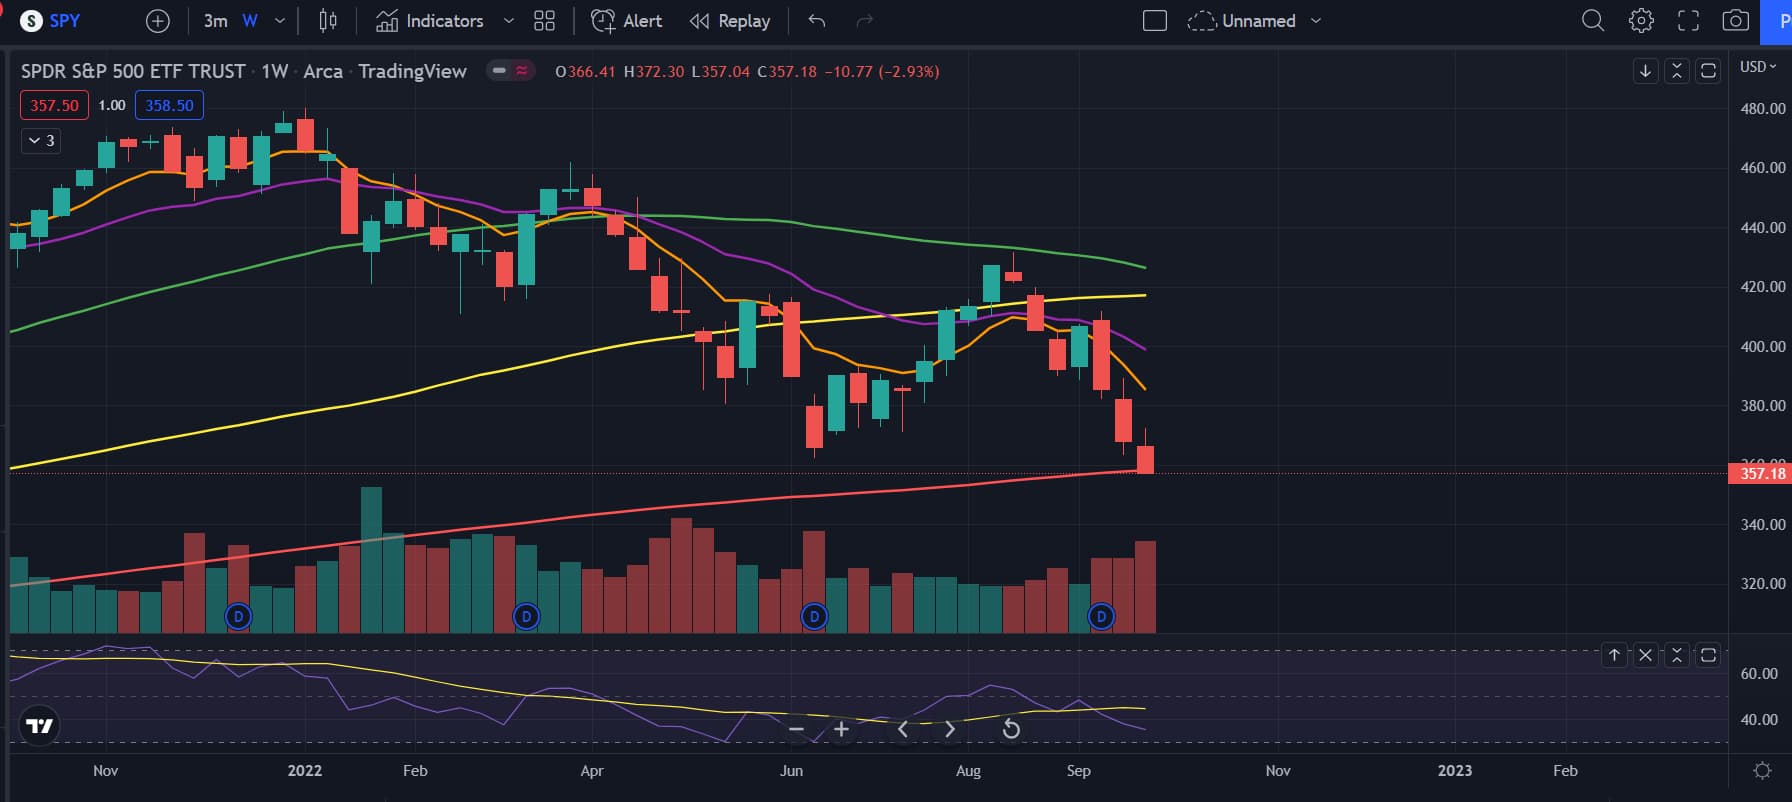
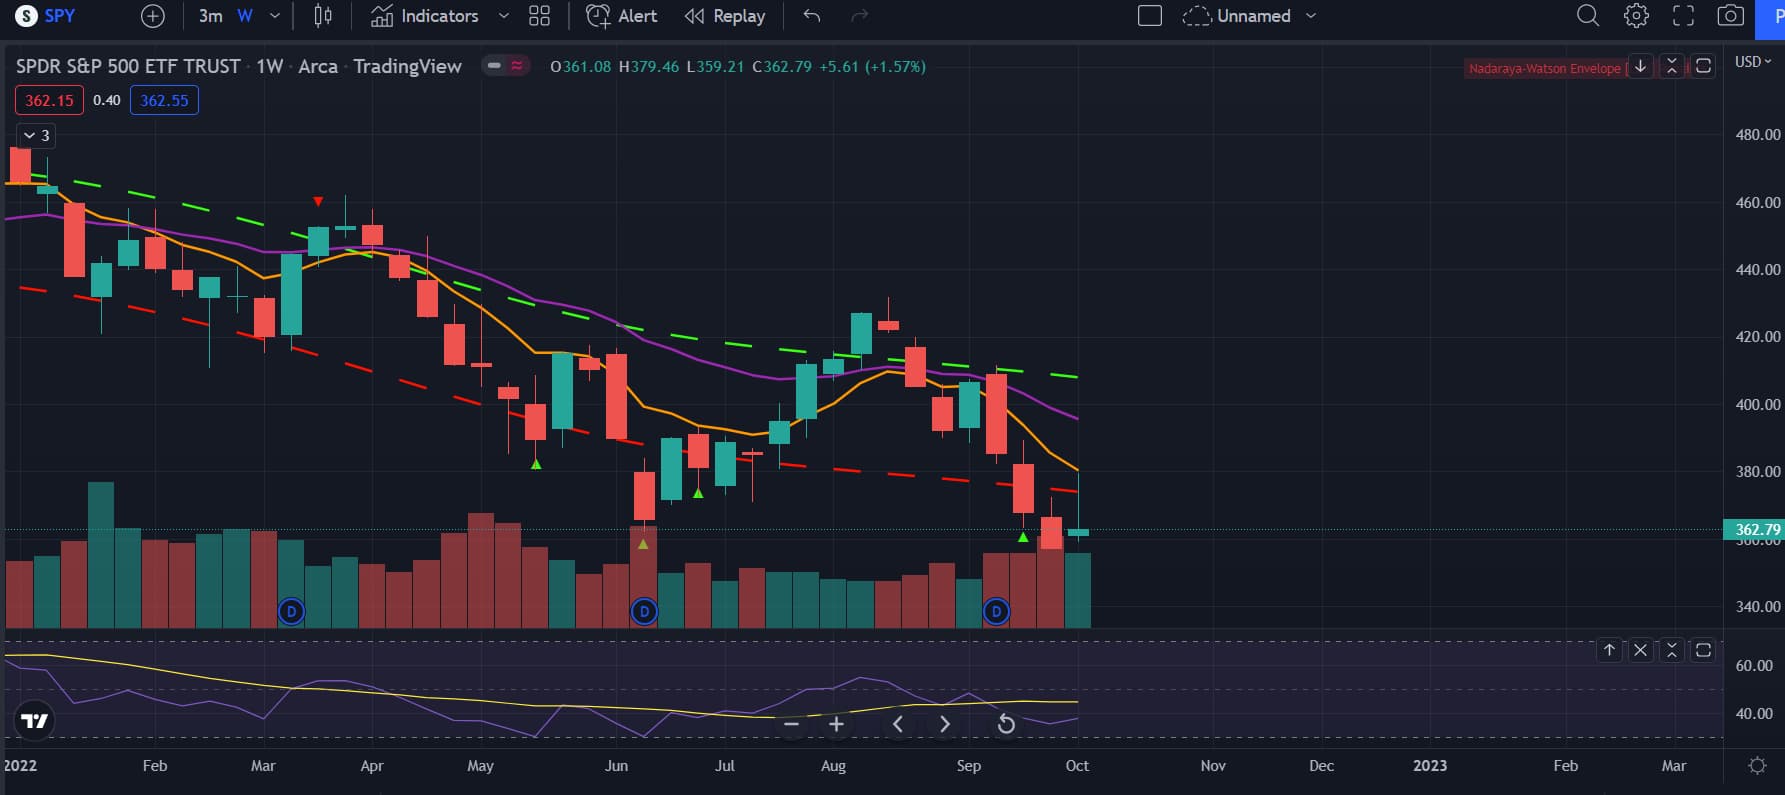
On the weekly, things aren’t looking too much better. We’re right at the 200 MA. This has acted as a strong support throughout the years so it wouldn’t be surprising if we started to rally from here. One thing to note is that there is a bullish divergence on the RSI and the MACD and we’re very very overextended to the downside using my indicator. All these signs lead me to think that we’ll have some kind of bear market rally, but the selling strength is very very strong right now. For me personally, I am looking at bullish positions, but very small positions until it actually plays out.

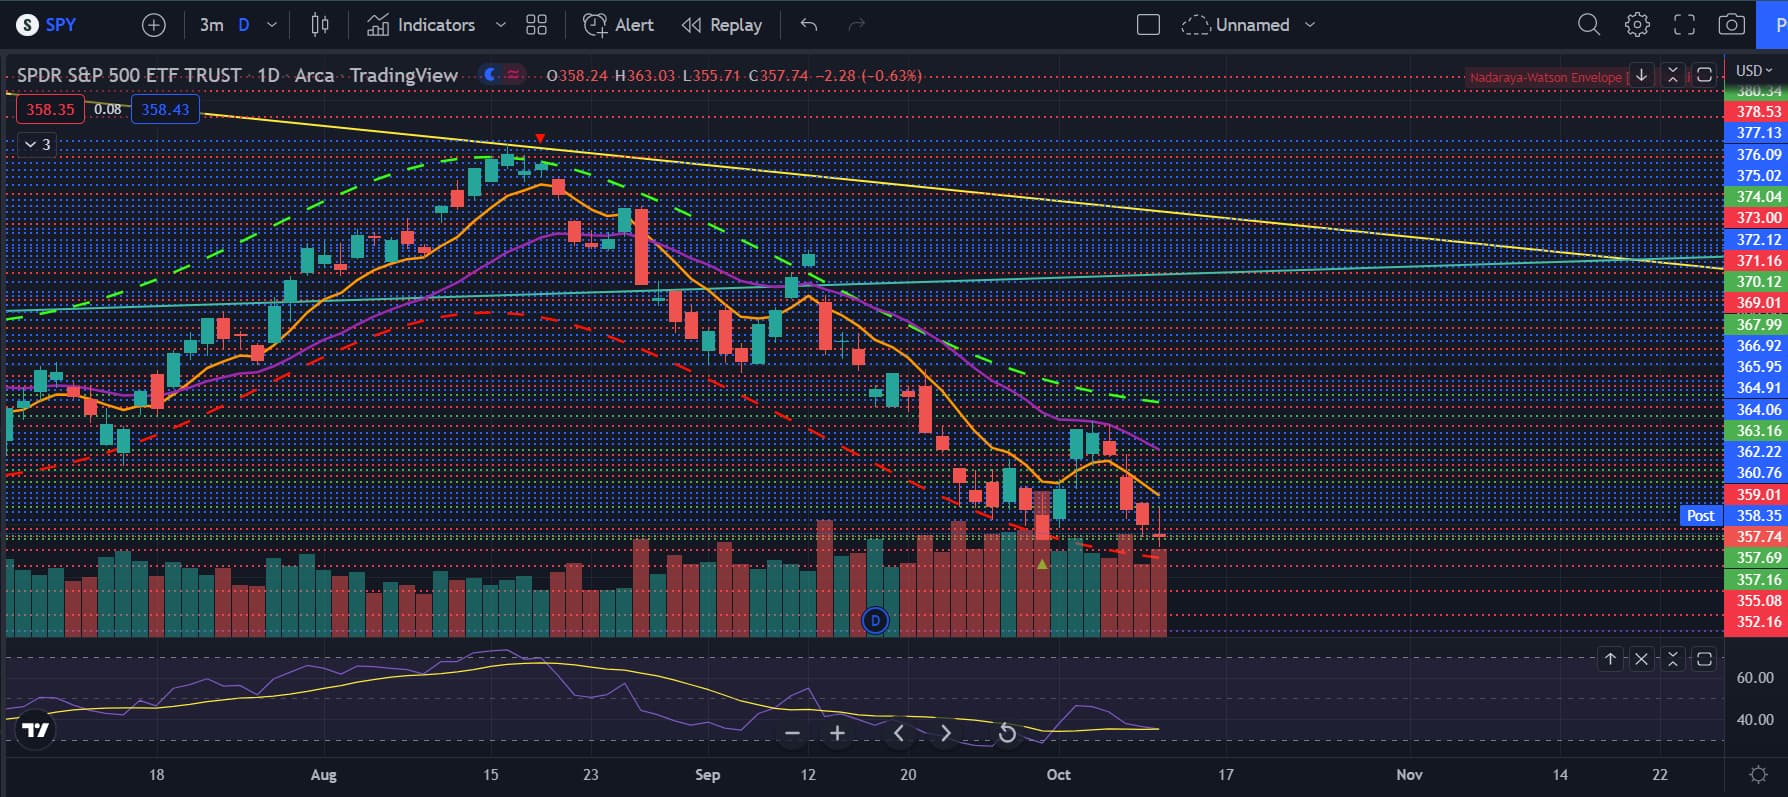
Yeah so the daily isn’t giving good hope either. Look at the huge volume today. I think that’s kinda proof that we broke through the huge support at the 360 level, but we’ll see if that’s the case or if this was a bear trap. Because we do have a bullish divergence on the RSI (none on the MACD), and overextended to the downside, right at supports. This might be just hopium though, who knows. But not looking good and we might be going straight to 350 here if the support did get broken and we’re out of our consolidation range.

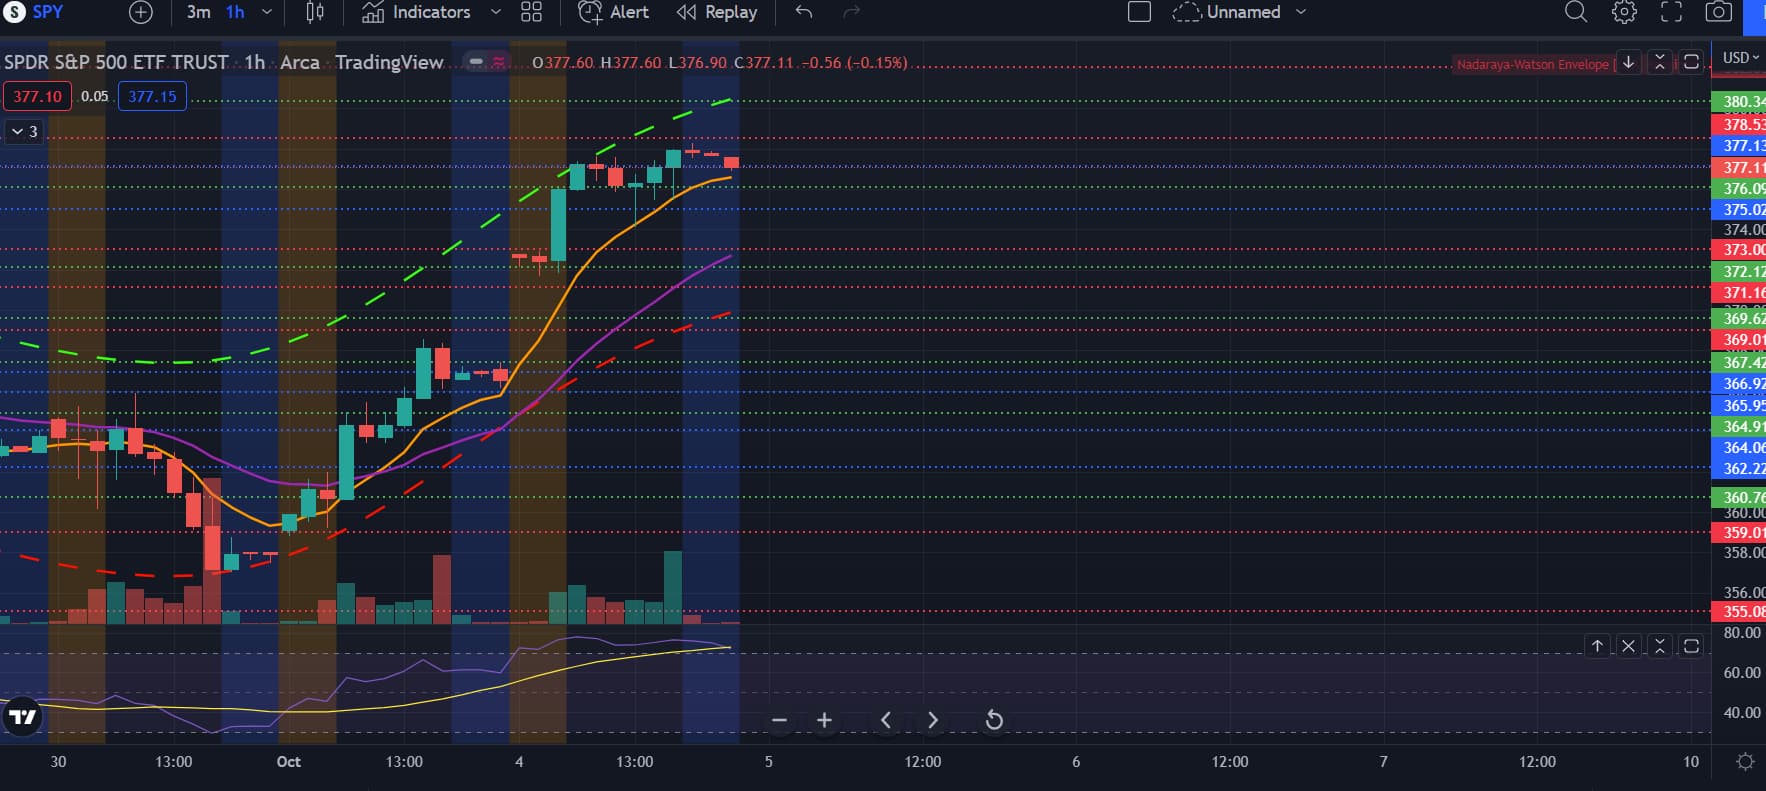
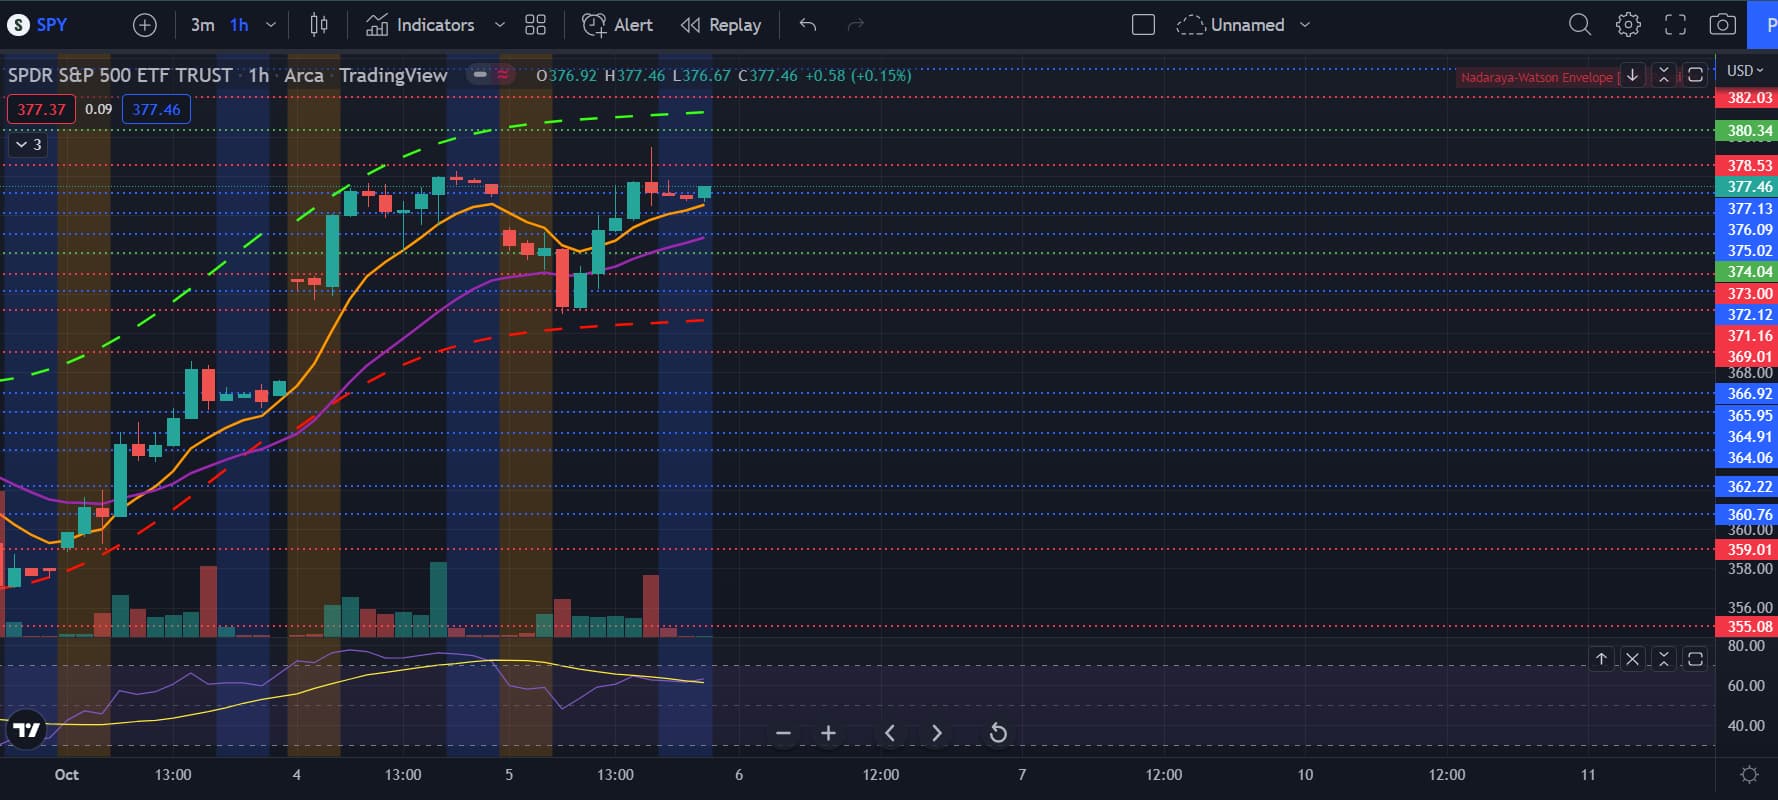
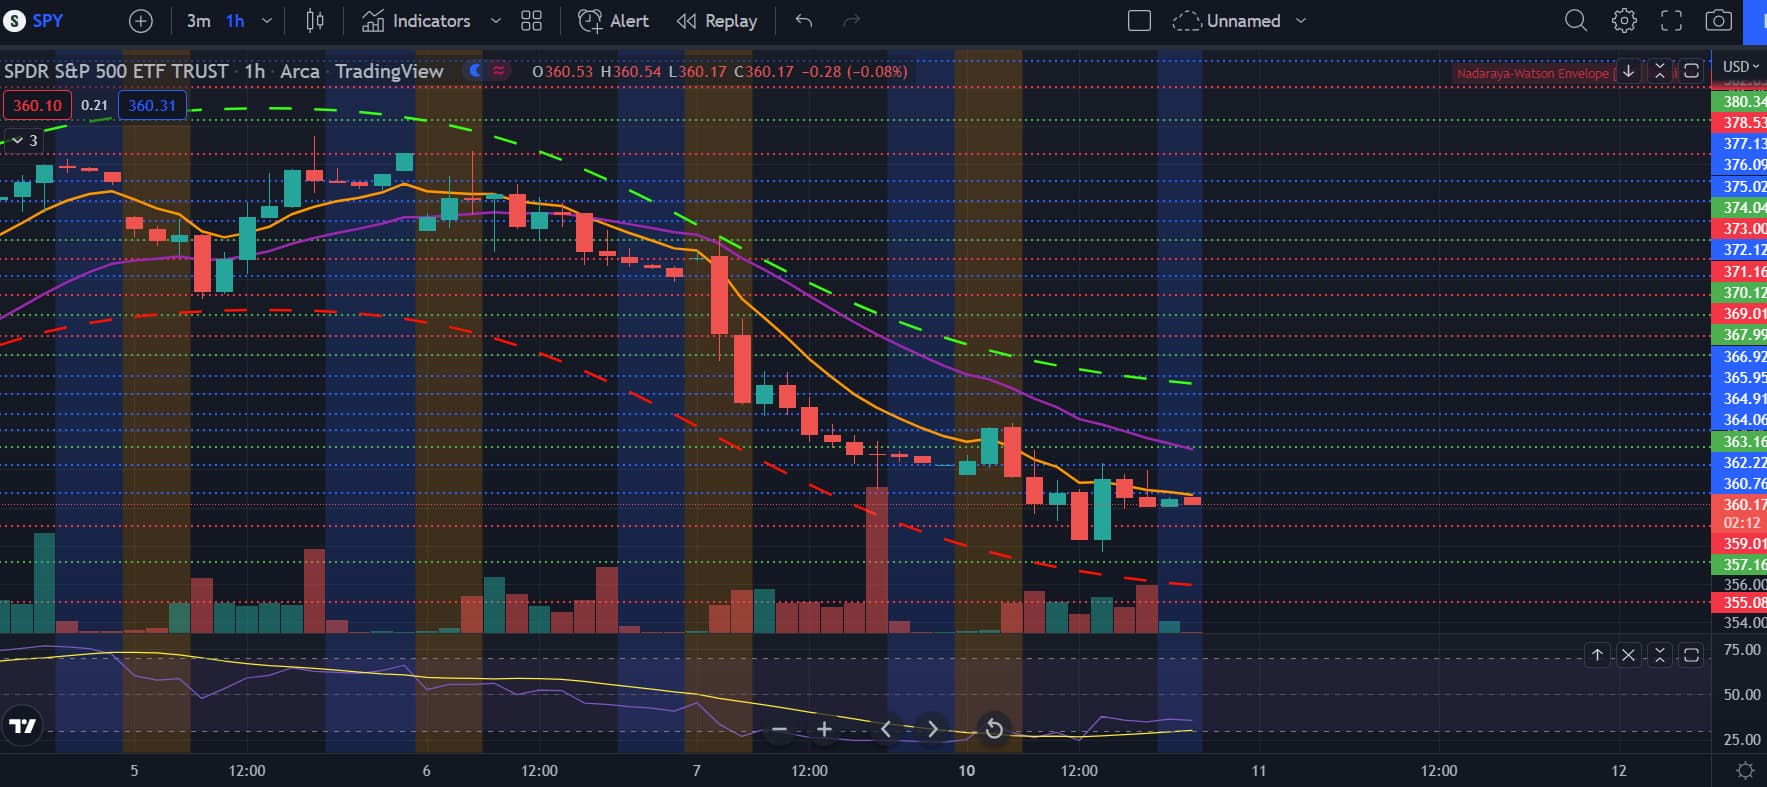
Now looking at the hourly chart, yeah buyers are not stepping in boys. Constant fails to stay over the 21 EMA and rejections at the 8 EMA. We’ll see what SPY does, but on the shorter timeframes, seems like we’re still not bottoming and have more room to go lower.

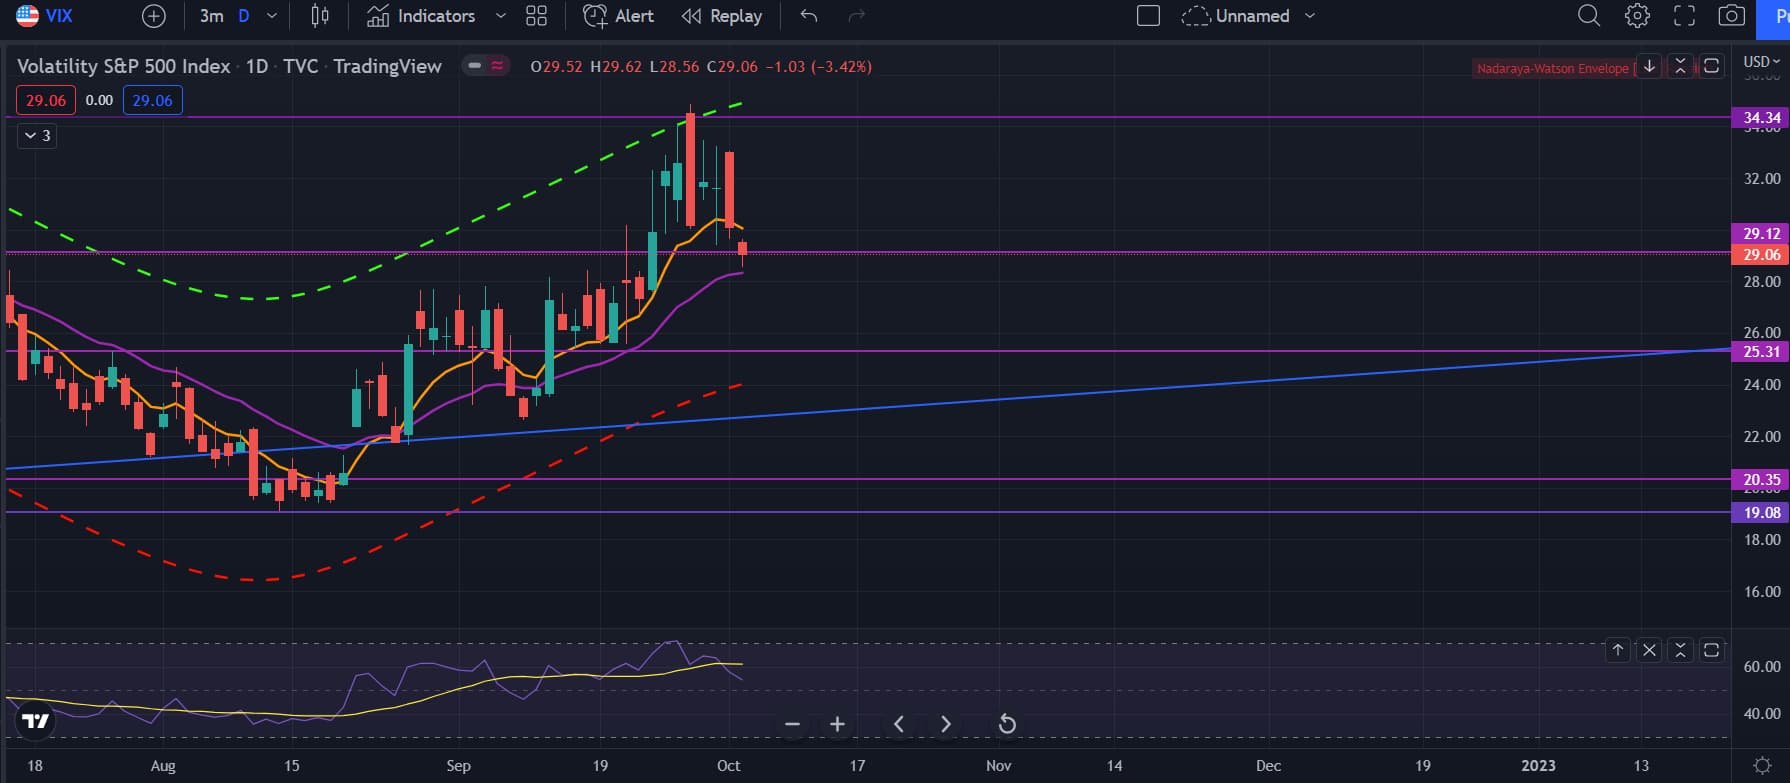
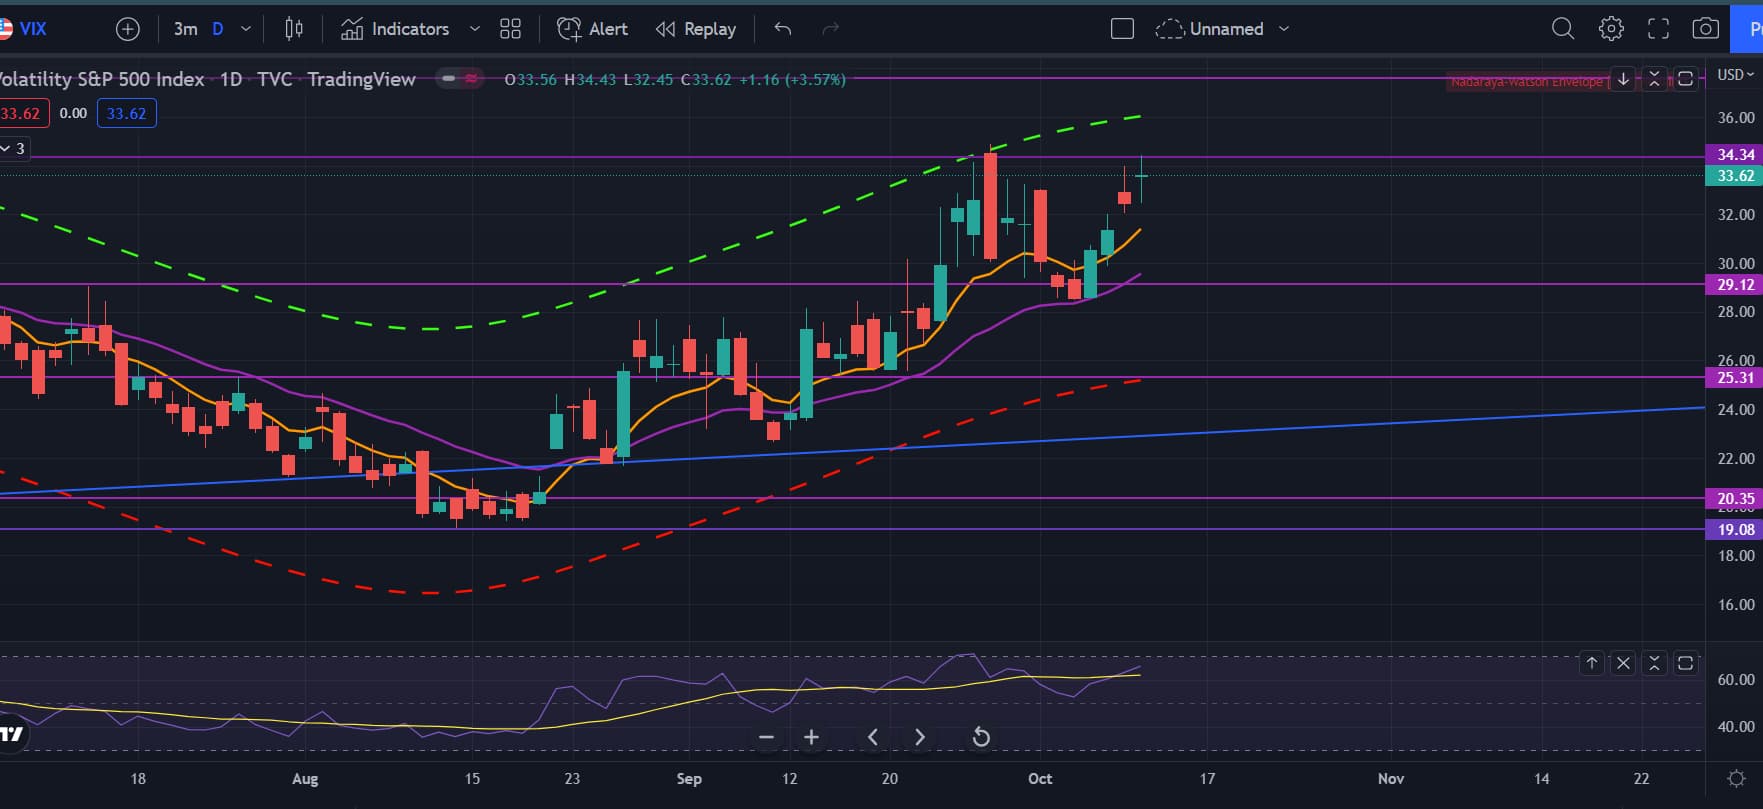
Now one thing that confuses me is that although the charts are very bearish, the other indicators aren’t too bearish. VIX just stayed flat (was actually down for Friday) and isn’t really spiking. Could this be a sign that the move on Friday was due to monthly expiry volatility and a bear trap? Who knows. But weird not seeing VIX spike over 35 by now.

One thing I am looking at also is IWM - the small caps. They did not make a new low, so did HYG. If small caps aren’t making new lows, could it be that the move we’re seeing on SPY is a bear trap? If this move was not supported. Another thing to watch is the Dow Jones Transportation Average. Apparently, that and SPY are closely correlated and SPY tends to follow the DJTA. And on the DJTA, we also did not make a new low. Very interesting to see that small caps are not shitting down more than SPY right now. Stay cautious bears.

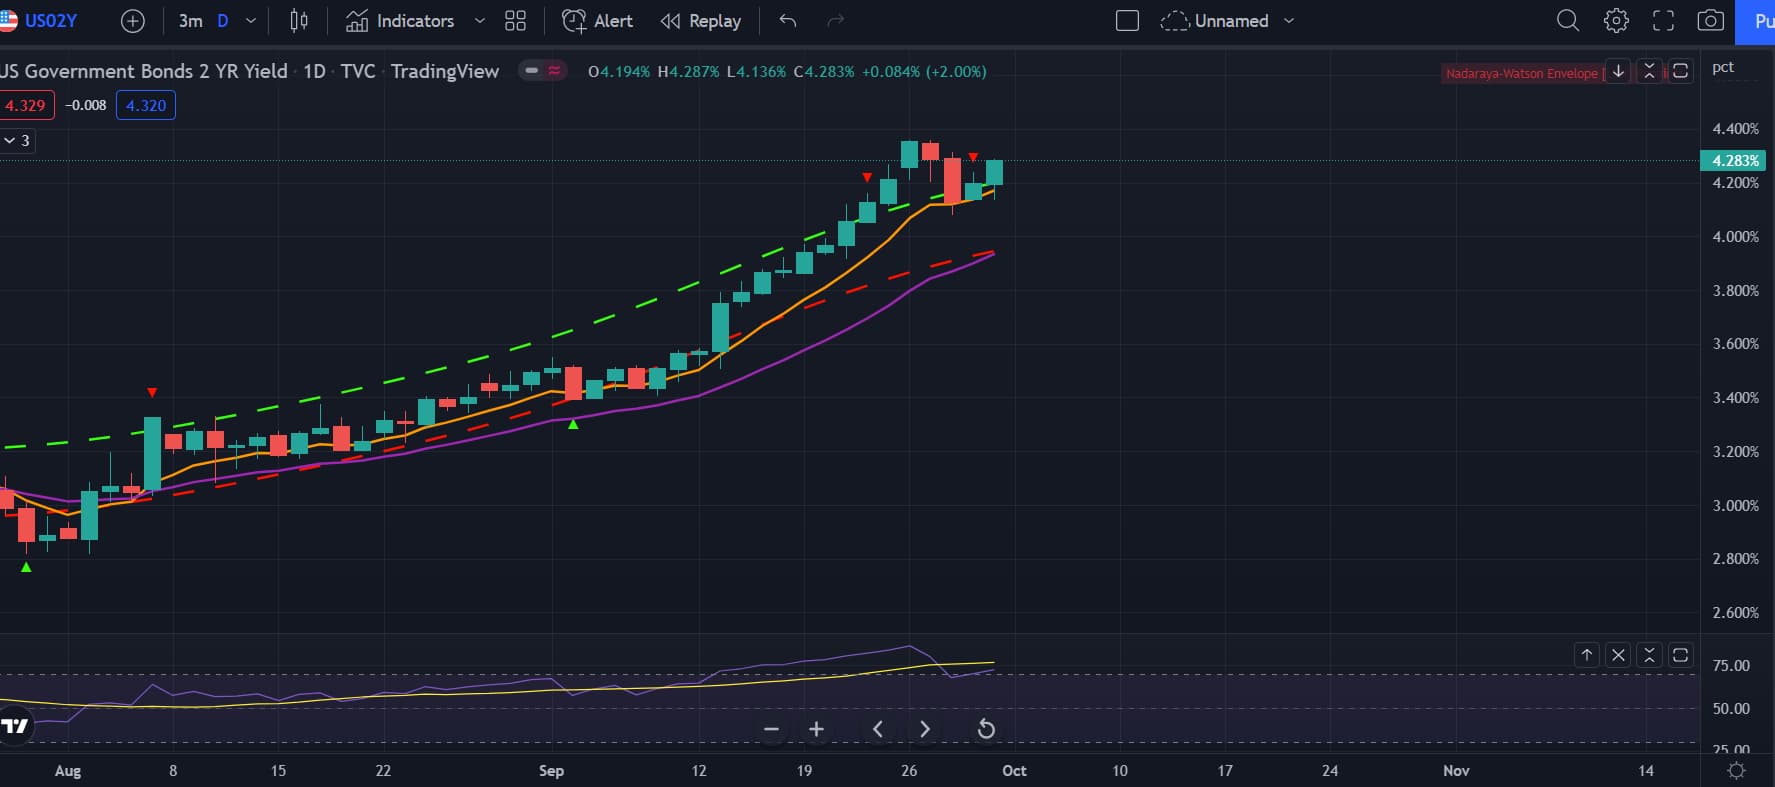
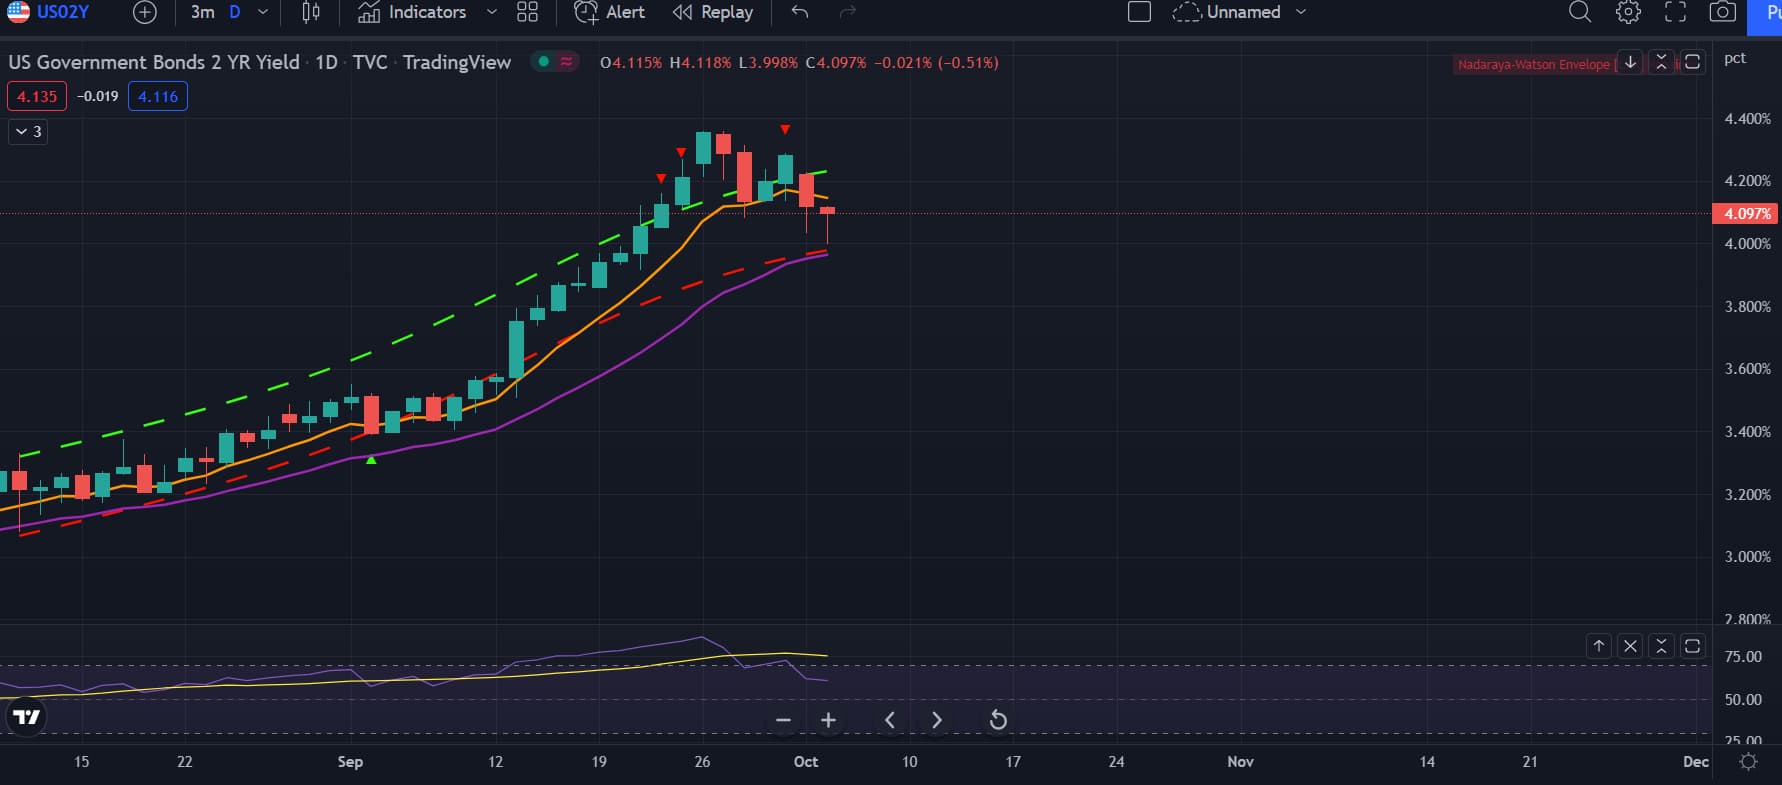
The 2 year yields are turning back up after a little breather. Not surprising, but could we be setting up a lower high or a bearish divergence to form and give SPY more room to rally? Either way, 2 year will be on an uptrend for a while longer.

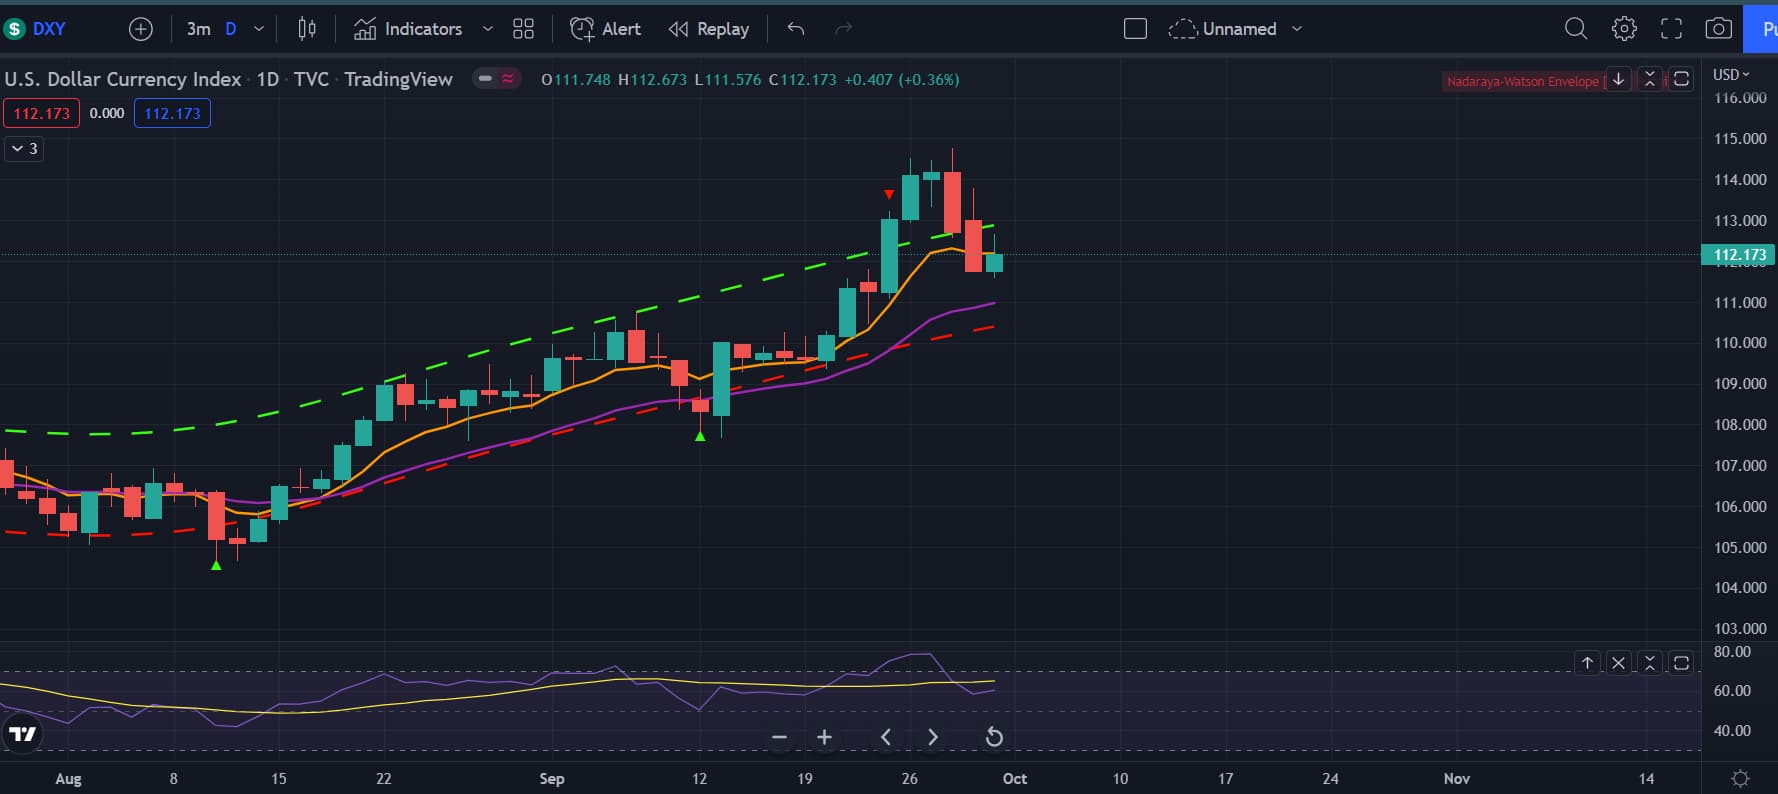
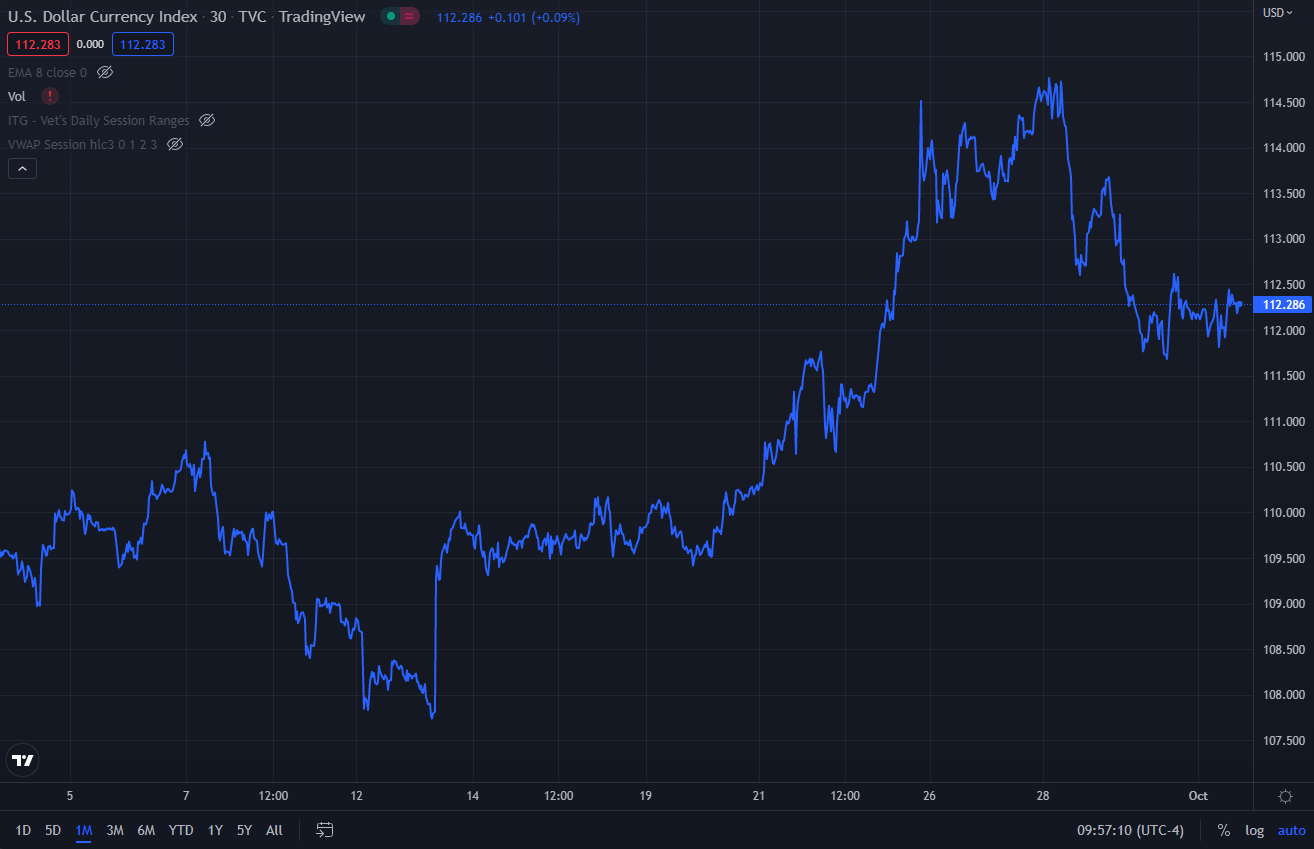
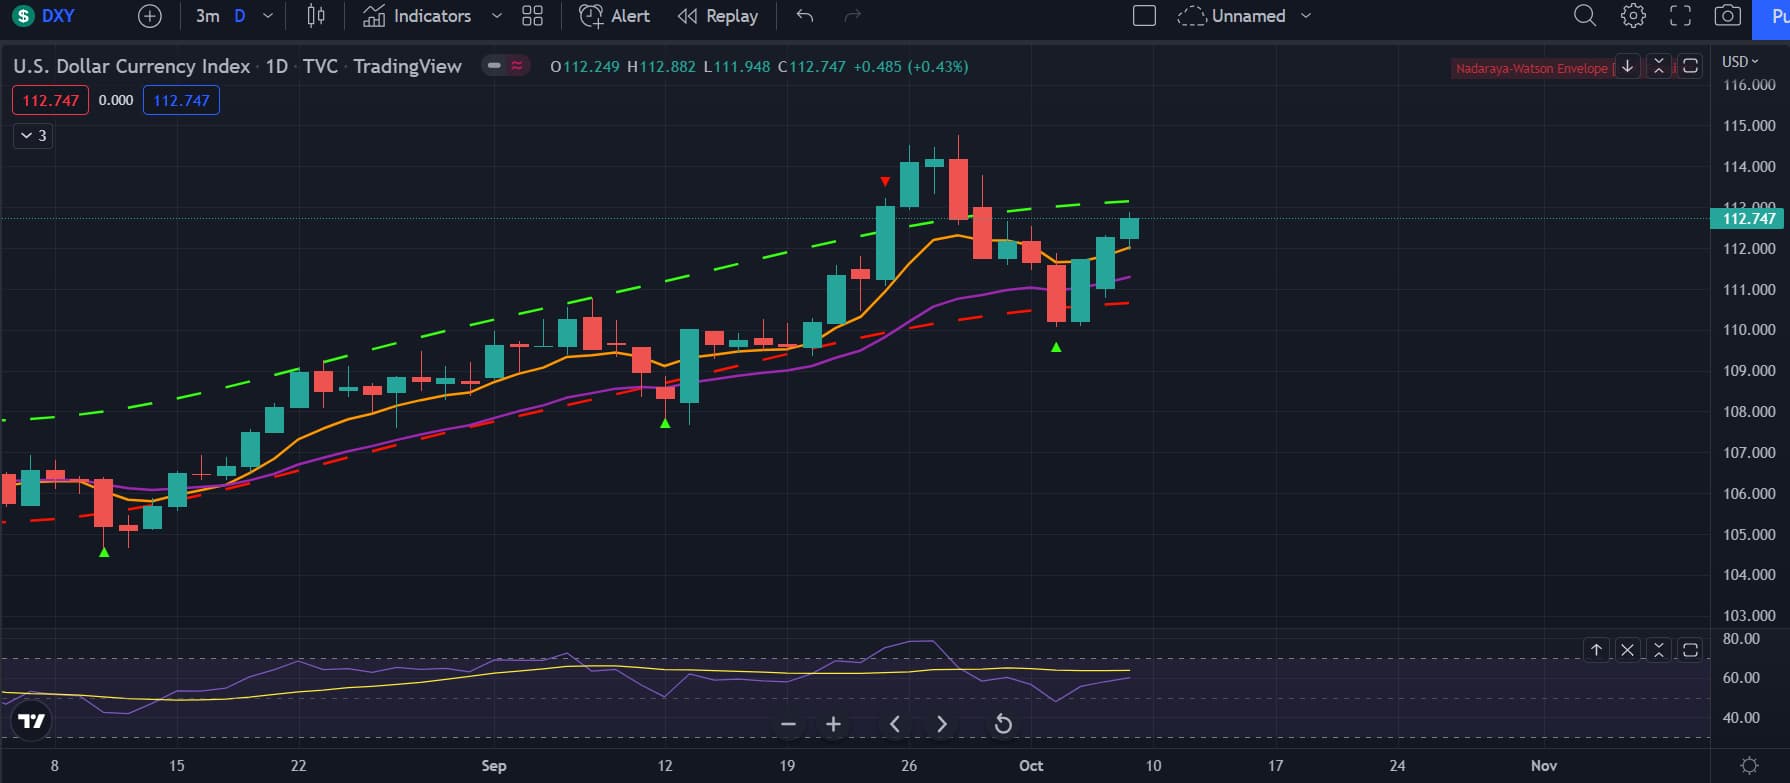
Another interesting thing I noticed. The dollar did not spike really at all Friday. Another sign that this could be a bear trap. Even if we had good pullbacks the past 2 days on the dollar, it’s weird that it didn’t go up much at all, and even had a good sized top wick. Interesting to see and curious to see how it’ll play out.

Now for the other indicator, the market breath. This is the percentage of stocks in the S&P that are above their 50 day moving average. We are at historic lows where we typically make bottoms or start bear market rallies. I’d be surprised if we continue to stay at these levels for much longer unless we have full on capitulation and have a circuit breaker. The risk reward for swing puts here is not good at all according to my system.

Overall, SPY charts are screaming bearish, but my other indicators are not really agreeing with this move down. I am leaning towards a bear market rally right now, but I’m not staying in any plays for now. I do think we will continue lower until CPI comes in better than expected and the Fed changes their tone, but the r/r here for spy to go lower is not good. So be careful to the people holding swing puts here and stay green

11 Likes

Agreed @Yong - indicators don’t quite seem to be lining up.

The SG gamma complex has rolled lower, with 3500 and 3600 being major strikes that will act like magnets. It’s negative gamma up to 3800, so we can expect volatility. On its own, this looks bearish. However, if markets turn, this is a lot of de-hedging that needs to take place, and could fuel us to 3800 relatively easily. Not to mention the de-hedging of the puts that expired on Friday.

But then bond yields seem to be taking a breather. In fact, they were already taking a breather at the end of last week.

DXY also seemed to be taking a breather.

Since this is confusing, will wait out today maybe to see how things took. Still holding those QQQ calls.

4 Likes

One more data points from SG. Delta tilt - the ratio of call to put delta - is at the lowest levels we’ve seen. Every time we have been at these levels, we’ve seen a nice rally. Doesn’t guarantee it at all, but its one more data point to suggest chances of upside are much more than downside.

6 Likes

TLDR: We are now back in the 360-370 range. This could be the start of the bear market rally if we break above 370 so don’t just full port into puts.

So SPY on the hourly held above the 21 EMA very well and also busted above the 50 level on the RSI. We could retrace back to the 21 EMA and the 50 level on the RSI before making another leg higher. The real test would be to see if the hourly candle closes above the 371 level to confirm that we are going into a rally. Overall though, hourly seems bullish until the test at 370. I would recommend you enter swing calls IF the hourly candle closes, not the 3/5 min candles.

So on the daily, we retraced back to the 8 EMA. Could this be just the end of the rally? I personally don’t think so because the 2 year yields and DXY is shitting down, giving markets more room to run. Also looking at the volume, it was very small today. This probably indicates that there aren’t sellers here. Maybe they’re waiting at the 370 level. One thing I learned over the weekend was that you want to see low volume breakout on the daily because that’ll indicate that there are no seller waiting to push the market down. Dunno if this is true yet, but given that, we should continue to push up until we run into sellers. Overall, daily does seem like it wants to play out its bullish divergence and have a good retracement up.

Looking at VIX, it’s just dicking around here. Nothing much to say other than it’s a good sign that we’re not hulk dicking straight up from here on the VIX. Probably means that we’re not in full on capitulation yet. The 2 year and DXY are also continuing to roll over, which is good for the markets and giving them more room to run. Seems like the indicators not matching up last Friday is now playing out.

Overall, this may be the start of another huge bear market rally so don’t be retarded and keep buying puts. Buy at significant resistances, ATM/ ITM, long expiry and money to average down. Don’t be bullish at the top. Good chance that we continue to go up so make money both ways you bisexual fucks.

3 Likes

TLDR: I think that we’re either gonna start a consolidation phase with the top being around 380 then reverse. But, if we do manage to break 380, then I think we’ll try to retest the long term down trendline, which could take us to 418, which could only happen if all the news from here is bullish (which I don’t think it will)

Looking at SPY hourly, we rode up the 8 EMA. We are starting to get overextended and have not tested the 21 EMA during this run. I expect us to test the 21 EMA tomorrow and either start the new leg higher or fully reverse. The RSI is very overextended and this usually leads to pullbacks or reversals. But, it does look very bullish on the hourly, which means no betting big money on puts yet.

On the daily, we had higher volume, which is good, showing that there are more buyers coming in (or more short covering). We are very close to the 21 EMA on the daily, which I think we will stall at or get rejected at. The RSI is also heading towards the 50 level, which is when most pullbacks or countertrends have ended. Signs are starting to point towards the end of this bull rally.

For how big of a green day we had, we did not tank too much on the VIX. Could this possibly mean that we are entering the bull trap phase? We’ll see, but not a good sign that VIX is holding above 29.

Another reason why I think that stocks are about to consolidate or make a reversal is because the yields are starting to show signs that they are done dying. The 2 year has good bottom wicks and starting to look like a bull flag. Could this mean that we are going to continue higher on the 2 year? Maybe and probably. Not much macro has changed, although news recently has been showing that economy is slowing which may cause the fed to be more dovish quicker.

Now looking at the dollar, shits been tanking down. Maybe this means that we have continued fuel upwards, but we are at the 50 level on the RSI which typically leads to the end pullbacks. We’ll see what happens.

Overall, we are nearing some critical turning points in markets. I am expecting us to top at 380 and start to consolidate or sell off. I do not think we have bottomed yet, although I am open to that idea. Be careful everyone, play safe and good luck.

4 Likes

What a fun day. Inside candle suggests bulls and bears are still fighting it out. Though for most of the day, bulls were the ones clawing back control. Given the gap up yesterday, perhaps the market can be forgiven if it takes a moment to ponder its life choices at this difficult time.

image

Also, I missed to check this earlier, but the SPX 4000 gamma level is back in force. It’s curious that there is so much call gamma. Also, vol trigger was at 3755, and we closed at 3783. Us being in positive gamma territory means if we stay green, MMs will not add to the volatility. This does reduce the possibility of large positive days though.

Big picture, there’s a lot of path dependency for sure, but these are the major events we have lined up over the next month:

  • Unemployment data this Fri
  • CPI next week
  • Earnings starting week of 10/17
  • Opex on 10/21
  • FOMC 11/2

Any of the first three has the potential to throw us off the bear market rally, but assuming they are not strong enough to do so, opex should provide rally fuel as we have a ton of puts.

Then, beginning of Nov is when we could potentially expect JPow to bludgeon the market again, beginning our decline into the end of the year. Assuming earnings misses haven’t started the process already.

4 Likes

There’s an idea going around on Twitter that a large options trade at around 9 AM PST / 12 PM EST triggered the market rally.

https://twitter.com/TommyThornton/status/1577733422113513472

The trade is described in this tweet.

However, the trader only had to pay $30M. $30M from one party to save the market? Doesn’t sound that believable to me considering that billions are spent per minute on SPX/SPY/QQQ and the large caps.

5 Likes

Seems doubtful to me as well. I would imagine it’s more of an effect than a cause.

The cause is in my opinion obvious, which is a bet on a fed pivot or more realistically a bet on conditions putting us in the realm where a fed pivot seems likely.

1 Like

I agree with conq. I think that the movement in the near term is not at all going to be TA based it’s just sentiment, news, hopium, and copium.

Wall street is mildly optimistic that a fed pivot could come, which maybe it will they’ve done it before.

4 Likes

TLDR: Like I’ve been saying, we’re either approaching consolidation days or a reversal here. I don’t think we’ll bust through upwards, but we’ll see.

So SPY on the hourly “tested” the 21 EMA. Seems like it was just a bear trap if anyone was using this indicator. We do have a bearish divergence on the hourly now, but I don’t think it matters too much right now. I think we’re going to the right to finish off the weak, but yeah the charts are looking bullish.

SPY on the daily did show lower volume today, maybe showing that there aren’t as many sellers as we thought? We’ll see. But we did reject off the 21 EMA and just trapped between the 21 and 8 EMA, which I expect us to continue into tomorrow. We are also stalling at the 50 level on the RSI so I don’t really see this as bullish until we hold above the 21 EMA with good volume.

VIX was down today. Good sign for bulls, but overall just flat.

Looking at the 2 year and the dollar, also flat. Seems like today was just a day to consolidate and shake some people out. Looking at the megas, again, they’re flat, although some did make some new highs. We’ll see what happens from here.

Overall, really nothing much to say other than we might be entering a choppy flat days ahead. Good luck everyone

5 Likes

This is the current option gamma complex. Lots of puts and calls, with 4000 as the strongest level. Vol trigger is 3800. We’re bouncing just under this level. If we cross it, it should make for a more gentle move up.

Btw we can see the massive 4400 and 4500 SPX call buys below; apparently this is what moved the markets at noon yesterday.

3 Likes

TLDR: Seems like next week will be another red week just based off the technicals.

Now starting from the weekly chart, we can see a very bearish weekly candle. We attempted to rebound and then got shot down at the 8 EMA. This probably means another red week ahead of us. What a wild week that we had. We were back in not oversold range, and now we’re heading back towards into it. One thing that I’ll be watching is if bullish divergences continues to form on the RSI and the MACD on the weekly if we do fall lower. At this current moment, it honestly doesn’t look like there will be, but we’ll see what happens.

On the daily, we had an uptick in the sell volume. Not good, it seems like the previous rallies were just short covering and a bull trap. We failed at the 21 EMA, consolidated and now pushing back below like I predicted. Now we’ll see how we react at the weekly 200 MA again. Do we break below this time or bounce again? Again, I’ll be looking at the RSI and MACD for potential bullish divergences to form. But currently, doesn’t seem like the bullish divergence will form if we do drop lower, which makes me think that we’ll get 2 more lower lows before we bottom again for a rally.

Now looking at the hourly chart, we died. That’s all, we’re very bearish on the hourly, although we are very oversold so I would look for a consolidation or a pullback to the 21 EMA before another drop. Considering the news ahead of next week, I believe that we’ll just range trade for Monday and Tuesday before choosing the direction that the news gives us.

VIX is starting to climb back up, not good for stocks. But it’s not aggressively spiking which is good I guess, since there probably won’t be a circuit breaker incumming.

Now the 2 year yields are back to their top. Not good for stocks, but seems like markets are still looking for stronger rate hikes. It looks like we have more downside upcoming.

The dollar is trickling back up, but not at the same pace as the yields. Possibly due to markets starting to believe that the end of this inflation rate hikes are coming? Who the fuck knows, but either way, dollar is climbing which isn’t good for stocks.

Overall, I do expect more downside, at least until 340-350. The fed doesn’t seem like they’ll be dovish anytime soon and that’ll cause the markets to continue to head lower. I expect range trading and relatively flat movements for Monday and Tuesday since the major news start from Wednesday. Maybe we’ll get a hella strong end of day selloff on Tuesday, but beyond that, I don’t really see anything that can move the markets a lot on Monday and Tuesday. Good luck all and stay green.

10 Likes

Always love these, thanks @Yong

3 Likes

Ofc you respond when I promote bears :ded;

5 Likes

I just thought it was your best work so far! :smile:

5 Likes

Large put complex at play - the calls we saw last week seems to have been taken off. 3700 got beefed up on Friday. Vol trigger is 3800, so we’re negative gamma territory. In other words, usual programming - preference of market is to go lower.

7 Likes

TLDR: Probably a flat day tomorrow, but we’ll see.

So on the hourly chart, SPY rode down the 8 EMA, but what’s interesting to see is that the RSI is not heading any lower. Possibly means that we’re either going to have another dump downwards to form a bullish divergence and bounce or start bouncing here. Either way, I’m looking for a test of the 21 EMA before we move much lower.

On the daily, we’re just making our way lower slowly and with less volume. Maybe means that sellers are pulling back or the markets are waiting for the big news up ahead this week (which probably is the case). One thing to note is that the options chain points us to heading lower, which probably means that even if we don’t get much big moves, we should just drift down slowly until any major news comes out to change that.

The VIX formed a topping candle today, but we’ll see what happens with it. Just interesting to see that VIX isn’t spiking any higher than here. The 2 year yields did nothing - because of bank holiday so we’ll see how they come out tomorrow. The dollar rose up higher today, validating this move down.

Overall, I don’t think TA really matters here because of the major news up ahead which will most likely direct our move. TA does seem like it’s bearish, but the momentum is weakening for a bounce. I would personally only really use TA to guess the very short term moves for now until CPI and other news come out this week.

3 Likes

TLDR: Seems like SPY is just waiting for news to drop before it decides its movement.

So on the SPY hourly, we have a triple bullish divergence. Either this will lead to a huge bottom and a rally or we’ll fucking die soon. I think news starting from tomorrow will determine the trend, especially starting with PPI. But yeah, hourly looks bearish.

On the daily, another bullish divergence, but doesn’t really give good signs with the top wick with huge volume. Not a good sign for bulls. Also looks bearish on the daily, but we’ll see how SPY reacts to news starting tomorrow.

VIX, Dollar and yields are also doing jack shit. Literally nothing to talk about.

Overall, it seems like markets are just waiting for the PPI, FOMC minutes and CPI. The trend will be determined very soon so if you want, you can just wait until Thursday to take swing positions.

On a side note, lots of personal shit is happening in my life and since my med school decision comes out this week and I have fall break this weekend, I’m going to take a week or so break from trading. So no TA updates or anything for a bit. Sorry about that but I’m sure other smart people will keep you autists updated. See yall sometime later

9 Likes

Die

6 Likes

In preparation for tomorrow, wanted to share again the analysis from about two weeks ago on PCE day, and the post-mortem.

It is quite likely that we could see a similar two-part action sequence play out again tomorrow.

We know that there will be an unwind of vol. The unknown is reaction to the CPI print. There are four possibilities:

  • Up, and more up: CPI print is bullish, so people start buying and close out hedges. At the same time, vol unwinds, leads to MMs de-hedging in a negative environment (aka vanna rally). One feeds the other and we have an explosive rally. And this can last days.
  • Up, then down or flat: This will happen if CPI print is :meh:, but we still have the vol unwind fuel. So we go up some, and then the market returns to regular programming.
  • Down, and more down: CPI print is sufficiently bearish, so people sell more and get more hedges. We’re in negative gamma, so MMs hedge on those hedges (Xzibit meme opportunity here) and we spiral down into 3500.
  • Down, and then up: I don’t see a situation where this happens. Though it could be down, and then flat, if the print is bearish, but not too bearish.

Three out of four possibilities is not great in terms of predictions, but let’s keep these in mind so that a mid-day reversal does not catch us unawares.

13 Likes