VIX and its volatile shenanigans

Another masterclass from Cem Karsan. Main takeaway - puts are disappearing as people get complacent, but also, puts are providing less by way of protection as VIX is much lower. So once market starts gliding down again and people realize puts are not protecting them to the downside as much, they’ll start selling more to get out. Setting up a feedback loop of selling.

Here’s an overview of the general vol situation from Imran, a SG affiliate: https://www.youtube.com/watch?v=PAcw8_FPNqc

Btw this is where VIX is now:

Compared to 3 weeks ago.

Will probably wait to get some VIX/UVXY calls as Dec rolls around.

8 Likes

UVXY limit buys filled at $8 earlier today :sweat_smile:

Also got lotto 11/25 UVXY 9Cs for 0.04 for FOMC tomorrow, just in case there are fireworks.

5 Likes

My 12/2 were filled today at .08. Don’t know why I didn’t go with 11/25
image

1 Like

Tl;dr: Peace and tranquility prevail in the world of VIX. Should be bullish.

After spending large periods of time in backwardation, the VIX term structure is decidedly in contango now:

We see continued consolidation around the 20-24 level:

Vol of vol (VVIX) is showing a 5-year low(!):

Even the bond-VIX (MOVE index) concurs on this state of peace and tranquility:

This is all to say that the market is not expecting any bad surprises in the near future whatsoever. This is bullish. If CPI is anything close to what is expected - a high 5-handle - we might be looking at a nice setup for a nice bull run.

Will play next week with this bias in mind.

Now… this is also the perfect setup for things to unravel very quickly when a shock happens, so I did get Aug '23 VIX call spreads just in case we wake up one day to find something really big went bump at night. It will keep its value for months, and will make it more comfortable to partake in bullish plays overall.

6 Likes

On the Eve of FOMC, all is super quiet in vol land. Term structure is appreciably lower across the board, and this is reflected in VIX and VVIX. (The very recent uptick is likely due to FOMC, and likely to fall even more, barring some shock.) MOVE (the bond index) has also not been this low since June, suggesting bonds are not feeling my uncertainty either. This may be a good time to start considering long dated VIX call spreads.

5 Likes

“Volmaggedon” and the impact of 0DTE options has become all the rage after JPM’s chief global market strategist dished out some good old-fashioned fear mongering spree yesterday. Markets seldom do what consensus amongst “chief strategists” and the like suggest it has to do. Nevertheless, sharing these two resources that note some of challenges that 0DTE has brought to the markets:

This is a developing situation, and could very well end up lighting some things on fire. Will be tracking this closely.

3 Likes

Except that this time around will be the opposite direction which is probably 5-10% down. Correct me if I’m wrong.

In terms of the 0DTE effect? Gosh, who knows - kinda depends on what side the coin lands for tutes who decide to play 0DTE tomorrow.

We can keep running tr-netflow spx|spy and tr-netflow market to guesstimate. It is impossible to say which causes which, but if we a trend in the option flow, it may confirm overall movement:

2 Likes

It looks like we might be heading back to lower VIX days in the coming week or two.

VVIX is still a little elevated, but is on its way down.

I missed out on capitalizing on the VIX spike from the banking crisis - sell order of $3 missed by about 20 cents I think. Will roll the Aug '23 VIX spreads I got at the beginning of the year to Dec spreads next week.

1 Like

Fascinating presentation from Brent of SpotGamma on the impact of 0DTEs. It’s mostly about volatility, so parking it here.

Worth watching the whole thing.

Tl;dw:

  1. Positive deltas come in when market is at lows, negative deltas come in when market is at highs. 0DTE options are thus mean reverting when moves are outsized, though are in the direction of movement when movement is 1% or less.
  2. Significant vol dampening observed between days after 0DTE SPX came out
  3. SPX and VIX are now much less correlated than before: -0.55 now versus -0.85 a year ago

What does this mean? Big picture…

  • Good news: 0DTE unlikely to cause something like a volmaggedon event from trader actions itself, as long as traders keep behaving like they are :sweat_smile:
  • Bad news: Confirms old signals we used to rely on around gamma and delta levels are much less useful :frowning_face:
3 Likes

Doubled down on the “something will go bump in the next few months” and got a 12/20 23C/29C VIX bullish call spread for $1.45. Yup, 253DTE.

P&L Table

Will likely liquidate the existing Aug call spread with the same strikes on the next vol spike, and then roll it to even further out.

1 Like

VIX is at its lowest levels over the last year, and VVIX is also down quite a bit. Looks great, right?

Turns out this is an artifact of how the VIX is calculated. What seems to be more important is the that “fixed strike vol” is actually up (refer to image below). In other words, the vol of higher strikes are lower than those of lower strikes, so VIX went down because it is calculated. But the vol of each of the strikes themselves went up.

Had never really dug into this “fixed strike vol” business before, but after hearing the vol master Cem Karsan mention it yet once again, dug into it a bit.

image

Andy Constan has a great explanation that goes into the details.

image

The long and short of it is, despite what the VIX be suggesting, underlying vol is actually going up.

4 Likes

CBOE came out with a paper yesterday that basically says, “MMs are a very small part of the daily gamma sloshing around, and 0DTE doesn’t really impact intraday SPX vol either.”

:face_with_raised_eyebrow:

This flies squarely against all the biases I have that say gamma and them Greeks have outsized impacts on the market. Will take my time to go thorugh this contrarian view a few more times carefully, but wanted to share so y’all can read and share what you think too.

I say “contrarian” because almost everyone from the behemoths like JPM to the cottage industry outfits like SG say the exact opposite, on both counts. But this is CBOE, the mommy and daddy of 0DTE options, so has to be taken seriously.

1 Like

Thanks for sharing. I had a read through.

I find myself a bit hesitant to accept the report’s conclusion. However, I don’t have any means to validate or challenge the conclusion. Therefore my reaction is simply “Hm. Interesting.”

Fortunately for me though, keeping this report in mind won’t impact my trading as my trading strategies don’t include looking at net gammas/deltas, max pain, etc.

Some commentary/notes on the some of the findings:

  • SPX 0dte options have risen from 5% of SPX options volume in 2016 to over 40% since introduction of Tues/Thurs expiries last year. In recent weeks it actually averaged 50% in August.

  • Despite the massive increase in ratio of 0dte options, the report found that the “flow is, in fact, remarkably balanced between buy vs. sell.” This leaves very little net exposure for market makers. Remarkably balanced indeed. Seems almost too good to be true.

  • The report was based on SPX 0dte. I wonder if the findings would differ any significantly when looking at SPY, QQQ, or futures.

  • This commentary in the report highlights the knowledge gap behind software such as Unusual Whales, e.g. never truly knowing whether options are being opened/closed or bought/sold, while stating that at Cboe they do have access to the full picture.

So just how balanced is the customer flow in reality? While many commentators have tried to estimate that (to varying degrees of success), it’s important to point out those are just estimates based on assumptions. Since 98% of the volume in SPX 0DTE options are traded electronically, most outside observers have very little visibility into the exact breakdown of the volume. However, at Cboe®, we do. As the exchange where all SPX options are traded, we can see for every transaction whether it’s customer or market maker, buy or sell, opening or closing. As a result, we are able to get an accurate sense of market maker positioning by tracking their net position (long minus short) at each strike.

2 Likes

Took me a few times to read this article and I’m still trying to digest everything but definitely seems interesting. Also seems like they left more to be desired given cboe claims to know the exact breakdown of the 0dte volume.

I’m curious if there is a correlation between itm vs otm 0dte activity based on this reports’ findings? Would the net positioning, that cboe claims is fairly balanced, impact SPX based on the number of 0dte contracts are are exercised or assigned at close? This is where it gets to be a little out of my ballpark and I’m not sure if these questions are accurate or applicable for this assessment.

So if it’s not MMs, are they implying the massive volume is large nudge funds AND retail? (Who’s left?!)

2 Likes

Thanks for sharing your thoughts, Kevin and DankeDeNada! Generally am in agreement with what you said.

The most glaring thing for me was that they are looking at gamma alone, and not delta. Gamma is the second derivative, but it’s the first derivative is delta. It’s like talking about how a car decelerated at 10mph², but whether it does it from 10mp or 100mph makes a big difference in terms of stopping distance.

Second, they seem to rely too much on averages - they say the following, even thuogh we can see the range to be in the millions:

On average, market maker positioning is fairly de minimis, with net gamma exposure ranging from $170mm to $670mm throughout the day

This is how people drown in fords that are, on average, just six inches deep.

image

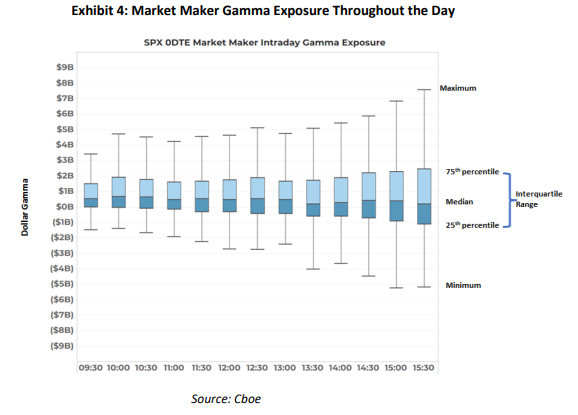
Third, they only take a day-long window. But that’s not how MMs hedge - they do so dynamically and usually fully, since this is: a) the SPX complex and b) the 0th day. Imagine the extremes of the flows below happening in a 30 minute window (which we have seen on some days) vs the full 6.5 trading hours. That immediately shoots up the 1.3%-1.9% below to ~20%. 20% of notional will move markets, no?

Even if we focus on the “whiskers” on the box plot, the range of -$5bn to
+$7.7bn represents just 1.3% to 1.9% of the S&P futures daily notional volume. Hardly the tail wagging the dog.

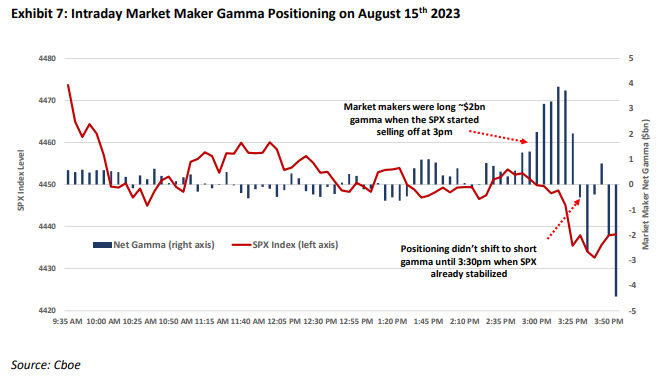
Finally, their take on what transpired on Aug 15 seemed a bit myopic. They note that markets were in positive gamma territory just before the dump started. Yet note how there was a positive spike in gamma just when the alleged 100K 4440P contracts hit the market. A spike that was concidental to the trade.

image

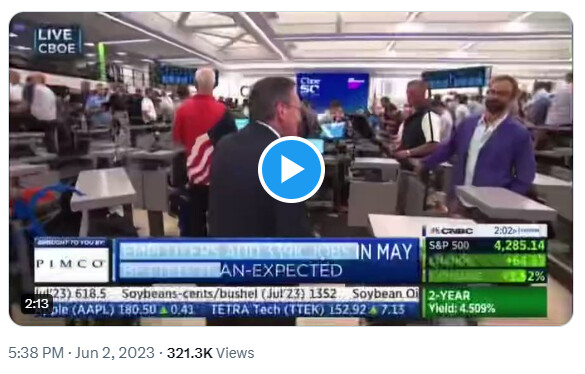
SG has one explanation for this in the following video, around the 10 min mark. And talks about the delta drop from these puts around the 11:35 min mark - they track the negative delta while CBOE reported on the positive gamma.

Generally this video is worth checking out, though Brent is clearly trying not to bite the CBOE hand that feeds him. Which, on top of his signature mumbling, waters down some of the underlying points he’s making.

Overall, I don’t find the CBOE paper convincing enough to walk away from continuing to rely on this delta/gamma hedging stuff, especially around opex. The pivots around opex have worked out too often (yellow lines). But it is a call to be more discerning as not delta/gamma is created the same, and folks orders of magnitude more sophisticated that what we can track are likely front-running this stuff more than ever.

1 Like

Siwtched out from long vol to short vol yesterday. Got these bad boys, on assumption that current excitement in markets is short lived.

Will hurt if markets explode downward, but then we’ll have bigger problems (and opportunities).

1 Like

Doubled up (literally) on this at $0.79. Got filled AH actually, which is interesting…

VIX term structure is up markedly compared to the last two days. Part of is beacuse we’re back down at 4320 levels, but a lot of it is because of uncertainly going into the weekend.

2 Likes