Before we start, I want to give a quick shout out to @KneifKneif and @notmisa . They’re doing a great job in the “Bonds R Screwed” Thread. This is only meant as a general discussion for educative purposes. If you want to discuss bonds in real time, I recommend going over to that thread:
Firstly, why should you even care about bonds? Aren’t they just boring things my boomer grandpa gives me on Christmas that gives me 1% payments once a decade?
Well, the reasons that you should care about bonds basically boils down to two things:
-
The cost of money
-
Growth expectations
What are bonds?
Bonds are securities that issuers (i.e. the Government) use in order to raise funds to spend on whatever. Tendies at Wendy’s is the most common use if I remember correctly. Anyways, these bonds pay a coupon, usually payable at fixed intervals (i.e., semi-annually) and pay the principal amount once the bond matures (or expires). Once the bond is issued, it can be traded in the open market. This is where the yield of the bond comes in. The coupon of the bond is fixed at the time that the bond is issued, however the price of the bond itself can change. Let’s say you buy a bond for $1,000 and it pays a 6% coupon semi-annually. That means you get $60 every 6 months. However, let’s say, on the open market, you manage to buy the bond for $800. The coupon is still 6% ($60 semi-annually) but the yield has changed to reflect the price you paid for the bond. The yield is now 7.5% ($60 semi-annually for $800 paid). There’s more complex forms of yields like yield to maturity (important), yield to worst, etc., but the main relationship you have to be aware of is when the price of a bond goes down, its yield goes up (and vice versa).
Bond Yields
There are three main factors that investors consider when investing in bonds. The first one is inflation expectations. Are inflation expectations going to eat into my returns? In other words, are the real yields (yields compared to inflation) the bond gives me attractive enough? The second thing that investors consider is growth expectations. Is the growth that I think the issuer will achieve (whether it be Governments or Corporations) matching the yield I’m getting? The third thing is the term premium. This is a bit more complicated, but the term premium is basically the additional reward that investors require in order to invest in longer term bonds. This takes into account things like interest rate risk (are rates going to rise before my bond matures? If so, does the yield I’m getting reflect the expected average path in rates?) credit risk (is the issuer at risk of defaulting on their debt? If so, is the yield I’m getting enticing enough to invest in the company/government issuing these bonds? This is the basic idea of credit spreads, which we’ll get into later) and other things such as additional premium to account for fluctuations in inflation and growth expectations. Other technical aspects to consider when taking into account drivers of yields could also be supply and demand dynamics (i.e. the Treasury Bill shortage we currently have), liquidity shocks (such as wide bid-ask spreads), and large quantities of foreign investments (which we’ll dive into later). Now, what’s important to keep in mind is how much each driver affects a certain bond. A general rule of thumb is the closer the maturity, the more the yield of said maturity will follow interest rates from Central Banks. If your bond is maturing in three months, then you won’t have to think of the demographic composition of the United States in ten years and how it will affect GDP from now until then. All you care about is the path the Central Bank is taking with its policy rate. Here is an example of a 3-month bill when compared to the Federal Funds Rate.

Basically no difference. Now let’s compare the yield of a 10-Year security and the Federal Funds Rate.
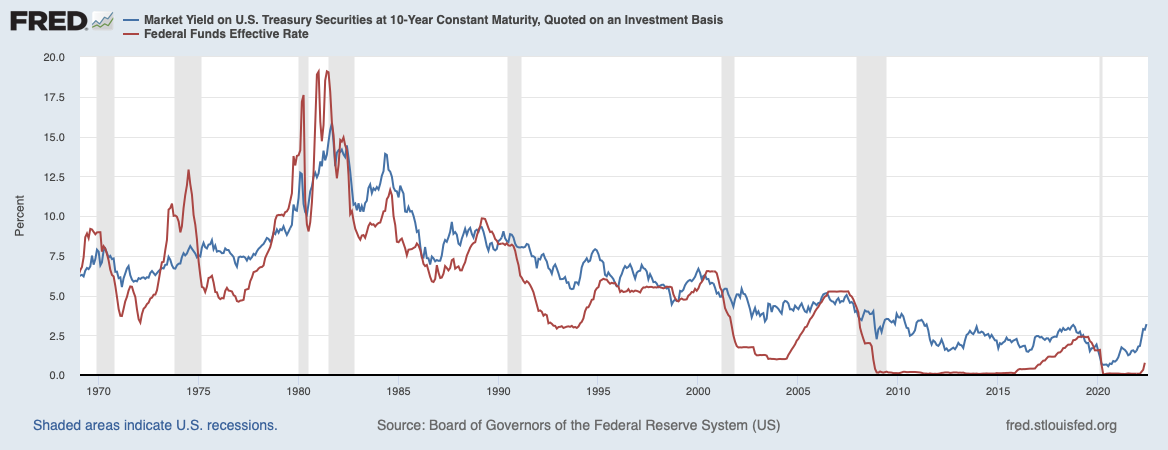
Not as correlated as the 3-Month bill. One could say that it could be used as a leading indicator, and we’ll get more in-depth into that idea later.
Yield Curve
Now that we’ve talked about the basic things that investors consider when buying bonds, let’s talk about the bonds themselves. Bonds often have different maturities, anywhere from weeks up to decades. When you plot the yields of these bonds from the short end (usually considered to be from the smallest maturity up to the 1-Year or 2-Year, and sometimes up to the 5-Year depending on who you ask) to the long end (any maturity after the short end cutoff) you get what is called the Yield Curve. If we take into account all the factors affecting yields that we’ve talked about previously, we can understand what type of shapes are generally considered good or bad, and why they’re viewed that way. If we think of a healthy economy, we usually think of a growing GDP and a healthy level of inflation due to its growth. Now, if we think of the general times that governments tend to hike and cut rates, we can get additional insights into the yield curve. If a country is healthy and has a growing GDP/healthy inflation, then Central Banks tend to want to hike rates in order to maintain a neutral interest rates. Due to all of this, we can infer that the farther out you go on the yield curve, the higher the yields should be. If GDP is growing, the economy is healthy, and a hike in rates is expected; then that would be reflected in the yield curve. Usually, a “steep” curve is considered a healthy yield curve. On the other hand, if we think about a recession, then we usually think of some type of deflation due to decreasing GDP which leads to lower interest rates from Central Banks. When we think of a recessionary signal in the yield curve, we usually think of inversion. This means that yields on the short end of the curve are higher than the longer end of the curve due to the average anticipated path of interest rates from Central Banks. One thing to always keep in mind is that there are two ways a bond investor can get a return. Either constantly buy securities on the short-end and reinvest the proceeds or buy securities on the long-end. As we talked about earlier, most of what an investor considers for the short end of the curve is monetary policy. However, if you’re an investor who’s deciding whether or not to invest in the long end of the curve, you have to consider the average path that interest rates could take from now until the maturity of your security (and other factors which influence that path like growth rates, inflation expectations, and so much more but we won’t get too deep into the weeds in this thread).
QE vs QT?
We can’t talk about yields and yield curves without talking about monetary policy. We’ll get into what indicators the markets give you in terms of the health of the issuer (in this case, the government and its economy) in the next section. Before we start, what even is QE and QT. Quantitative easing (or QE) is a monetary policy tool that Central Banks use in order to support the bond market during times of distress. The basic idea of QE is this: a Central Bank uses its balance sheet in order to take on more assets (for simplicity, we’re only considering US Treasuries, but there are more assets that CB’s can take on). When the asset side of the balance sheet increases, the liability side increases, as well. This would be bank reserves. Bank reserves are either physical currency or electronic deposits that banks with Federal Reserve accounts use in order to lend to each other in times of need. Due to regulation, there isn’t much banks can do with Bank Reserves, but what they can do under this regulation (mainly Basel 3) is buy treasury assets (or other High Quality Liquid Assets, but for simplicity, we’ll focus on treasuries for now) in order to get a return on their cash. Due to the excess demand on treasuries from the Fed and from Banks, interest rates tend to go down during QE. When we talk about Quantitative Tightening, or QT, then the inverse happens. The CB’s balance sheet is shrinking on the asset and liability side. There are two ways to shrink the balance sheet that CB’s use. Either let the bond’s mature and elect to not reinvest the proceeds or, the much more aggressive, active selling of securities. As the assets side of the CB’s balance sheet shrinks, the liabilities (the bank reserves) side shrinks, as well. There is less demand on the Treasury Securities, and so interest rates go up. Remember, bond prices and bond yields have an inverse relationship. Now, before we move on, there is debate on what actually happens to interest rates during QE and QT. On one side, we have “interest rates go up during QT and down during QE” (which is what we’ve discussed). On the other side, there is a slightly more nuanced view. This side says, well, if you take into account when CB’s actually implement QE and QT, you would realize that the opposite effect tends to happen. When CB’s use QE, there usually is some type of systemic distress or shock. Due to this, there is heightened concerns about lending money out due to credit risks. Therefore, when banks do QE during these times, interest rates actually go up because investors are demanding more return for taking on the risk of lending during a risky time. And when we think of QT, the inverse tends to happen, as well. When CB’s usually undergo QT, the economy tends to be healthy. Therefore, investors might actually demand less of a return on investment because the credit risk isn’t as heightened as usual. I think both camps raise good points, but I’ll let you decide for yourselves which camp you’re in. Of course there’s also the third camp which says that QE and QT doesn’t really matter for interest rates at all, but they also were the edgy kids who sat alone in lunch and no one cares about them.
If you want to read more about the basics of QT, I wrote some stuff in @TheHouse 's amazing Stagflation thread:
Bond Indicators
The Yield Curve
The first indicator I want to dive into is one we’ve already talked about, the yield curve. When we talk about the yield curve as an indicator, we usually talk about a specific spread (difference in yield between two bonds, in this case, of different maturities by the same issuer). There’s much debate about which spread to use, so I’ll introduce you to the popular ones and you can decide for yourself. The first one is the 2-10 spread. The 2-10 spread tries to take into account monetary policy on the shorter end and growth expectations on the longer end. If the 2-10 spread is negative; that is, if the yield curve is inverted; then market participants believe that the Central Bank is currently hiking rates and will continue to do so (the 2-year reflects this), but will most likely have to cut rates due to an economic slowdown in growth or some other shock to the system (the 10-year reflects this). The reason we use the 2-10 is because rate hiking cycles tend to last anywhere between 2-5 years. Given this, the 2-year should encompass most of the rate hiking cycle, while the 10-year should encompass the cycle plus whatever should come after. The same reasoning goes into the next spread, the 5-30. The 5-30 wants to take into account the rate hiking cycle and try to predict whether or not the Fed will break anything, leading to the cutting of rates. The last one we will talk about is the 3-month 10-year spread. The 3-month 10-year spread wants to predict the same thing the others are trying to predict, but with less variables in the equation. When we talked about the 3-month previously compared to the Fed Funds rate, we saw how tight the correlation is between the two. This is the main reason as to why the 3-month 10-year is used, in other words “is growth going to slow in the short- to mid-term, and are rates in the future going to be lower than where rates are now?”. Here are some charts comparing the 3-month, the 2-year, and the 5-year with the Federal Funds rate.


As you can see, the 2- and 5-year tend to lead the Fed Funds rate, with the 2-year having a bit of a smoother correlation when compared to the 5-year’s correlation to the FFR. Given that the average rate hiking cycle tends to be between 2-5 years, this makes sense. Investors in the 2- and 5-year have to take into account monetary policy between now and by the time their security matures, and that time frame encompasses the average tightening cycle. I’m going to let you decide which yield spread to use, however, my unsolicited advice would be to monitor the 2-year, or some other short end maturity, in order to gauge when market participants expect a peak in rates. In terms of the yield spread, I tend to monitor changes to the yield-curve as a whole. Is it flattening? Is it steepening? Is it about to invert? A real-world example would be the following:
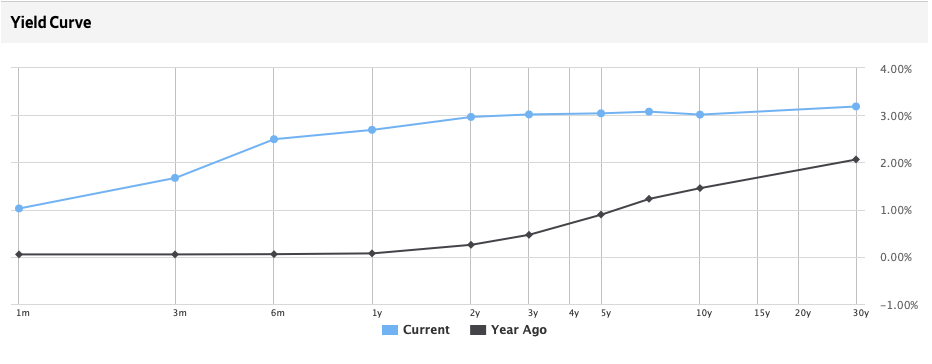
This is a picture of the US Treasury yield curve yesterday (June 30th 2022) compared to a year ago, courtesy of The Wall Street Journal’s Bond page. Last year’s yield curve was healthy, with yields on the longer end of the curve being higher than the shorter end. Today’s yield curve not only has moved up due to hikes in the Federal Reserve’s policy rate, but is much flatter than it was a year ago. This could mean that market participants see where we are as an inflection point, with some starting to buy longer end treasuries at a higher rate than they are shorter end treasuries because they see risks of an economic slowdown in the future.
Just as a side note, yield curves can be applied to any credit security, and steep yield curves aren’t always “healthy”. One example we could take into account is a yield curve on fixed mortgages. If the yield on the 30-year fixed mortgage is much higher when compared to the 15-year fixed mortgage, in other words if the mortgage yield curve is very steep, then that could have implications other than “healthy economy” such as increased concerns on things such as credit risks.
Yields
Next we’ll dive into yields themselves. We’ve already talked about how we can use some treasuries, specifically shorter end treasuries like the 2- or 5-year, in order to gauge when a peak in the FFR might come. In this section, we’re going to dive into another important aspect of bonds: real yields. Firstly, we have to differentiate real and nominal yields. Nominal yields are what a treasury security is quoted with having this instant. If you log into your trading platform and the yield on a 10-year treasury reads 3%, then the nominal yield on that treasury security is 3%. Real yields, on the other hand, are yields on a treasury security minus inflation expectations. If we think of debt relative to inflation, we can realize why this type of yield is important to investors. Let’s say I lend you $1,000 at a 5% interest rate for one year. After one year, the annualized inflation rate comes in at 6%. I haven’t lost any money in nominal terms, in fact I’ve gained a 5% return on my investment. When we take inflation into account, however, I’ve actually lost money, in real terms, because my return on investment didn’t beat the annualized inflation rate. Now we can extrapolate this concept to treasury securities. If real yields are decreasing, or even negative, then bonds would tend to be less attractive when compared to other forms of investments (there are other implications, such as a flight to safety, with a “I’ll buy what I can get” mindset amongst market participants, but, for simplicity, we’ll focus on the basics). However, if real yields are positive, then we can start seriously considering whether or not to invest in certain treasury securities. Calculating real yields is actually pretty simple. All you have to do is look up what the yield on a certain Treasury Inflation-Protected Security is. Treasury Inflation-Protected Securities, or TIPS, take into account what the market thinks the inflation breakeven rate is from now until the security matures. In other words, TIPS yields tell you the real yield on a treasury security when taking into account the consensus inflation expectation. For that reason, using TIPS is also useful to gauge inflation expectations, as well. Simply taking the nominal yield on a 2-year treasury, for example, and subtracting the yield on a 2-year TIPS would give you what the market thinks the inflation breakeven rate would be in 2-years, or, in other words, the average inflation rate between now and 2 years time. Of course, this is a very simplified way of viewing it, but, as I said, I don’t want to get too deep into the weeds, so for our purposes, this is enough.
As a quick side note before going on, yields also affect equity risk premiums. As we said before, if real yields are attractive enough, then, all else equal, we can seriously consider investing in those bonds. Due to the attractiveness in a guaranteed rate of return on a bond (in this case, risk-free US Treasuries), then other riskier investments should have a higher return in order for them to be attractive enough to invest in. This is where the equity risk premium comes in. All the equity risk premium means is how much am I, as an investor, getting compensated for taking on risk when compared to a risk-free rate. If expected returns on equities aren’t attractive enough when compared to a risk-free rate, then the added risk equities bring with them aren’t being reflected in the reward they should be giving. Due to this, then we can assume that when the equity risk premium is low, then valuations are too high and aren’t attractive enough to invest in.
Price Action
The last thing we’ll get into in this section is the actual price action of the bond market itself. There’s two aspects of price action I’d like to dive into. The first I’d like to mention is volatility. When it comes to the bond market, nothing is black and white. Instead, think of the bond market as a consensus machine, a place where every market participant can decide for themselves and where majority wins. Of course, the majority can be wrong, and has been wrong before. Now, when it comes to the bond market, the last thing you would think of, I’d imagine, is volatile. However, rising volatility in the price action of the bond market can imply very important things. Remember, the bond market is built on consensus, however if the market can’t agree on what consensus is, then volatility increases. Rising volatility in the bond market can usually imply uncertain times to come. Using an indicator such as the MOVE Bond Volatility Index can help you gauge how much volatility there is, and compare it to historic levels. Volatility isn’t only bad in terms of indicating uncertain times to come, it’s also bad for lending conditions. If issuers aren’t certain on what interest rate they can get when entering the credit market, then they won’t be able to forecast future financials, confidently borrow, or even take risks. As an additional bonus, I’ll leave you with this picture:

Here, you can see the MOVE compared to SPX. Usually, they are inversely correlated, much like the VIX and SPX. H2 of 2021 saw a bearish divergence when the MOVE and SPX started moving in the same direction. This started roughly around the time the Fed started becoming hawkish and mentioning Tapering, QT, and Rate Hikes (November-December). The Bond market, or smart money, is useful to follow alongside equities.
The last thing I’d like to mention in this section is intraday price action to gauge the market’s reaction to economic data. It’s useful to have a live chart of treasury yields alongside Powell’s speech at the FOMC in order to gauge what participants think is consensus from the meeting, or from the CPI report, or any other data release. Is the long end of the yield curve rallying (yields declining. Remember, price and yields have an inverse relationship) even while the Fed is being ultra-mega hawkish? That could mean that market participants expect the Fed to break something and could expect a Fed pivot in the near future. Hint hint, this has happened recently:
Central Bank Speak
Central Bank members today often engage in forward guidance. Being as clear as possible is important to CB’s in order to maintain credit markets stable. Of course, CB credibility should be taken into consideration when considering forward guidance; but, for our discussion, we’re going to focus on the remarks that Central Bankers actually make. During his tenure, Bernanke occasionally noted that 21st century monetary policy is “98% talk and 2% action”. When it comes to gauging potential decisions in monetary policy, there are few things that come before the views of the people that set said policy. One important example would be Mario Draghi during the European Debt Crisis. During the European Debt Crisis, then-ECB president famously said that the ECB would “do whatever it takes” to preserve the euro. This entailed bailout programs, QE, and even negative interest rates, which, until then, were pretty much unprecedented in nominal terms. The point of all this, however, is to say what Central Bank members say matters when it comes to the credit market. One example of when to really listen is when both Doves and Hawks start parroting the same tune. This could mean that the underlying message is key to something fundamental in future monetary policy. Of course, when it comes to speeches from Central Bankers, nothing is in a vacuum. It’s always good to gauge the bond market’s reaction to any remarks that a Central Banker makes. Is the bond market going against what they’re saying (i.e., the aforementioned ultra hawkish Powell versus the rally in the long end of the curve)? Is the bond market becoming increasingly volatile in response to the remarks? Are they supporting the remarks? Are they indifferent?
Credit Spreads
Now that we’ve talked about the basics of the Bond market in terms of risk-free rates on Treasuries, it’s time to dive into other sectors of the credit market. When we talk about other credit securities, we could be speaking about Asset Backed Securities, Mortgage Backed Securities, Corporate Bonds, or any other securitized debt obligation. For any of these securities, there will be demand from investors for an additional reward for taking on additional risk when compared to a risk-free UST investment. These additional returns on top of a benchmark risk-free rate are what we call credit spreads. Credit spreads are usually measured in basis points (or bps for short, pronounced “bips”). 100 basis points, or bps, is 1%. For example, let’s say that we are looking for a credit security to invest in. The first thing we have to consider is the risk-free rate. For our example, let’s say a 10-year US Treasury is currently yielding 3%. We, as diligent investors, would then want to look at the return on a corporate bond compared to the risk-free rate in order to gauge how much we’re being rewarded for taking on added risk. Let’s say our MSFT 10-Year Bond is yielding 3.75%. We would then say that the credit spread between the MSFT bond and the 10-year treasury is 75 bps (0.75%). This, in and of itself, doesn’t mean much, however if we compare the current credit spread on the bond (or ones like it) to its historical level, then we can gauge how much risk the market considers there to be in this investment. Here is an example of yesterday’s (June 30th 2022) credit spread levels on an Investment Grade Corporate Bond:
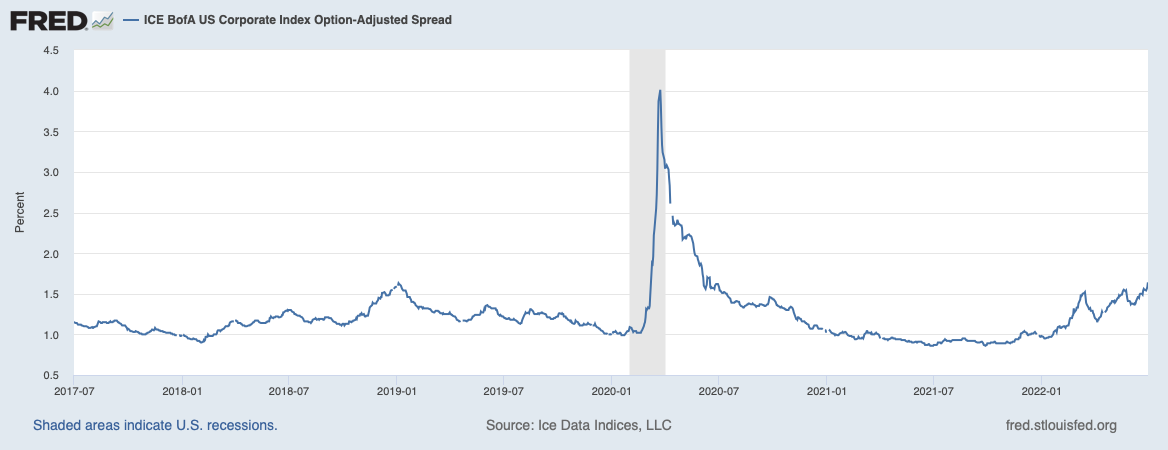
Investment grade spreads are above their 2019 taper tantrum levels. This means that investors see some risks hitting the Investment Grade market. We could also extrapolate this risk to equities. For example, here’s a graph comparing this same spread to the VIX:

Credit spreads usually tend to rise in times of uncertainty or distress. Let’s take a step back and view historical levels for the spreads we’re talking about.

As you can see, credit spreads tend to rise in times of uncertainty, including the 2013 and 2018 taper tantrum, 2016 Latin American Debt crisis, 2008, 2020, and now.
One More Thing
We previously touched on how increased levels of foreign investments can impact bond yields. This is very important to keep in mind not only as a bond investor, but as an equity investor, as well. When countries decide they want to buy UST securities, they have to purchase dollars in order to do so. When added demand from abroad, such as from Foreign Reserve managers, appears in the bond market, it can hit equities as well. We’ve recently hit decade highs in the US Dollar mostly due to foreign investments in the dollar. You can read more about how record levels in the US Dollar is impacting equities today here:
Links to Resources
Yields: Bonds & Rates
TIPS: Treasury Inflation-Protected Securities
https://www.treasurydirect.gov/instit/annceresult/tipscpi/tipscpi.htm
Yield Curve: Bonds & Rates
Move Index: ICE BofAML MOVE Index (^MOVE) Stock Price, News, Quote & History - Yahoo Finance
Dollar Index (DXY): https://www.marketwatch.com/investing/index/dxy
Credit Spreads: https://indices.theice.com
Literally Everything and Anything: https://fred.stlouisfed.org